Department of Agricultural & Resource Economics, UCD ARE Working Papers (University of California, Davis) Year
Paper -
The International Coffee Agreement: a tax on coffee producers and consumers? Mary Bohman
Lovell S. Jarvis
University of British Columbia
University of California, Davis
This paper is posted at the eScholarship Repository, University of California. http://repositories.cdlib.org/are/arewp/99-004 c Copyright 1999 by the authors.
The International Coffee Agreement: a tax on coffee producers and consumers? Abstract The International Coffee Agreement (ICA) used export quotas to restrict coffee trade in order to increase and stabilize the international price. A model of domestic pricing policy is developed which shows that the producer price should have fallen in response to ICA quotas. Econometric analysis supports the hypothesis that use of quotas resulted in lower producer prices in most coffee producing countries. The income lost by producers was largely captured by governments and/or exporters to whom the governments assigned quota rights. Since coffee is produced by small farmers in most exporting countries, income distribution within those countries probably worsened.
Department of Agricultural and Resource Economics University of California, Davis
The International Coffee Agreement: a tax on coffee producers and consumers? By
Mary Bohman and Lovell Jarvis
Working Paper No. 99-004
1999
Copyright @ 1999 by Mary Bohman and Lovell Jarvis All Rights Reserved. Readers May Make Verbatim Copies Of This Document For Non-Commercial Purposes By Any Means, Provided That This Copyright Notice Appears On All Such Copies.
Giannini Foundation of Agricultural Economics
The International Coffee Agreement: a tax on coffee producers and consumers? Mary Bohman* Department of Agricultural Economics University of British Columbia and Lovell Jarvis Department of Agricultural and Resource Economics and Giannini Foundation University of California, Davis 1999 ABSTRACT: The International Coffee Agreement (ICA) used export quotas to restrict coffee trade in order to increase and stabilize the international price. A model of domestic pricing policy is developed which shows that the producer price should have fallen in response to ICA quotas. Econometric analysis supports the hypothesis that use of quotas resulted in lower producer prices in most coffee producing countries. The income lost by producers was largely captured by governments and/or exporters to whom the governments assigned quota rights. Since coffee is produced by small farmers in most exporting countries, income distribution within those countries probably worsened. JEL CLASSIFICATION: O1, F1 KEYWORDS: commodity agreements, cartels, trade policy, coffee
*Corresponding author: Department of Agricultural Economics, University of British Columbia, 2053 Main Mall, Vancouver, B.C. V6T 1Z2 Canada. Telephone: (604) 822-4382, Fax: (604) 822-2184, e-mail:
[email protected]
The International Coffee Agreement: a tax on coffee producers and consumers?* The International Coffee Agreement (ICA) is an agreement between the principal coffee exporting and importing countries1 that imposed export quotas in order to raise the price at which member country exporters sold coffee to member country importers. Member importing countries have accepted the higher prices paid by their consumers in order to benefit governments and farmers in less developed coffee exporting countries (Kravis, 1968). Participation in the ICA by developed country importers like the United States has been explained primarily in political terms. This paper argues that ICA quotas imposed an implicit tax on coffee producers as well as on consumers. The model of domestic pricing policy developed in this paper shows that under a wide range of government preferences, the producer price falls in response to quota induced restrictions on output. Government treasuries and/or middlemen in exporting countries tend to capture any benefits from the quotas.2 This result raises concerns about the effect of the ICA on income distribution because in many countries coffee is produced by small farmers. The paper hopes to raise and sufficiently document the issue such that it enters the debate on the ICA and other export quota based commodity agreements. The paper proceeds as follows. First, the specific propositions that affect exporting countries are explained and background information on exporting countries' policy environment is *
This paper is partially based upon research supported by the US Department of Agriculture under a Co-operative Agreement with the University of California, Davis. Any opinions, findings, and conclusions or recommendations expressed in this publication are those of the authors and do not necessarily reflect the view of the US Department of Agriculture. Research support was also received from a University of British Columbia Humanities and Social Sciences Research Grant. We would like to thank the International Coffee Organization for data and Giovanni Anania, Colin Carter, Keith Head, Felipe Jaramillo, Alex McCalla, and Dan Sumner for comments with the usual disclaimer. 1
Gilbert (1996 and 1987) presents more information about the operation of the ICA. Bohman and Jarvis (1990) review events during the 1980s in greater detail. 2
This paper does not explicitly treat middlemen in importing countries. However, a high degree of concentration is known to exist and these firms had access to information such that they may have benefited from quotas. European firms are known to have profited from smuggling nonmember market coffee from Eastern Europe into Western Europe during the 1980s.
2 provided to motivate the model. Second, a theoretical analysis of policy with the producer price as the choice variable is presented. Third, results are given from empirical analysis of data including an econometric test. We conclude with policy implications of the research for any future ICA or other export quota based agreement. The impact of the ICA on the coffee market The ICA established a target range for the member market price (a weighted average of different types of coffee) and fixed a global export quota to achieve the desired price. Each exporting country received a percentage of the global export quota. When prices fell below the target range, the quota was cut. If prices rose above the ceiling price for more than 45 days, quotas were suspended until prices returned to the target range. The first ICA was signed in 1962 and renewed at approximately six-year intervals through the 1983 ICA. In July 1989, negotiations to renew the ICA collapsed and export quotas were removed. Quotas have not been reimposed since then.3 From 1962 to 1989, export quotas were in effect for two-thirds of the period. They were removed on several occasions--either when the member market price rose above a preestablished level or when member nations were unable to agree on the distribution of the global quota. In the model presented in this paper, each country’s quota share is assumed to be exogenous, reflecting ICA operation until 1987. At that time ICA rules were modified to make country quota shares partially dependent on exports and stocks, but changes in quota allocation were limited. Quota shares were also varied slightly in response to lobbying within the International Coffee Organization (ICO).
3
A new ICA took effect in 1994 that does not contain provisions for export quotas. The current ICA is primarily a vehicle for information dissemination and promotion of coffee. This paper employs the past tense when discussing ICA quotas as, if it were to take effect, any new quota regime would involve substantive changes.
3 A secondary or nonmember market existed alongside the member market because several importing countries, representing approximately 10 to 20 percent of import volume, elected not to join the ICA. (Almost all coffee exporting countries, representing over 99 percent of exports, were members of the ICA.) The ICA allowed exporters to sell to nonmember importers, but technically only at the same prices prevailing in the member market (Resolution 336). In fact, exports to the nonmember market generally occurred with large price discounts whenever ICA quotas were in effect. Neither the exporting countries nor the nonmember importing countries had any incentive to restrict such sales (Bohman and Jarvis, 1990). Coffee exporters faced two distinct markets--one with a high price, constrained by quota, and the other with a low price, unconstrained by quota. Impact of ICA on domestic prices Before developing a formal model to analyze how exporting countries adjusted domestic policy to accommodate export quotas and the two tiered world prices, an overview of twenty exporting countries is presented. The overview is intended to show the diversity in policy across exporting countries. Eighteen of the countries represent the largest coffee exporting countries and faced binding export quotas from the ICA. Two countries, Burundi and Rwanda, have been included because they did not face binding export quotas as a result of an exemption accorded by the ICA based on their dependence on coffee exports. Table 1 provides data on the selected countries grouped by the type of coffee exported. Only two countries, Brazil and Colombia, have any ability to independently affect world market prices as shown by data on market shares in member and nonmember markets (columns (2) and (3)). The amount of taxation of coffee varies across the exporting countries. Column (4) gives the share of producer price (PD) in the world market price set by the ICA (PA) during the 1980s when quotas were in effect. The shares range from 37 percent for Madagascar to 83 percent for
4 Kenya. The data reveals that a large number of countries tax4 coffee exports heavily -- in eight countries producers receive less than 50 percent of the member market price (including six African countries). Although not shown, the tendency towards heavy taxation and diversity in policy exists during periods without quotas. Several factors possibly explain the diversity in the share producers receive of the world price. The role of coffee in the domestic economy as a source of export earnings and taxation influences policy in some countries. Coffee is an important source of export earnings for most countries. From 1981 to 1988, coffee contributed more than one-third of export earnings in seven countries and less than 10 percent in only 5 countries.5 Coffee exports could also serve as a source of taxation, and available data shows this to be the case for a small number of countries.6 Market power by domestic coffee exporters or by the exporting country could also contribute to the low producer prices. Meaningful data on concentration among exporters is not available, but anecdotal evidence from a number of countries indicates that this is a possibility. As shown in Table 1, only two countries, Brazil and Colombia, have the potential to improve the terms of trade with an export tax. However, with export quotas in place during the 1980s neither Brazil nor Colombia restricted exports below the quota level which would be necessary to affect the world price. Political economy reasons provide a third explanation for the pattern of producer prices. Exporters can be highly concentrated and exercise monopsony power and/or lobby the government 4
The ratio represents one minus the nominal protection coefficient. Taxes and marketing costs are included in the part of the world price not received by farmers. 5 6
Authors’ calculations using IMF, International Financial Statistics.
Data from the IMF "Government Finance Statistics" were analyzed if a separate category for coffee revenues was listed. Coffee contributes over 15 percent to tax revenues in only three countries: Rwanda, 24% (1973-80), El Salvador, 23% (1978-87), and Ethiopia, 15% (1972-81) where years covered by data are in parentheses. Actual
5 for favorable policies. Producers are less likely to lobby the government as in most countries coffee is grown by large numbers of small farmers, often living far from the capital city. However, concerns about producer welfare could still influence government policy. Literature review Other research that analyzes the effect of government policy in exporting countries, with a focus on coffee policy, is reviewed in this section. There are two papers which develop general models that are applied to several countries and other papers focusing on a specific country. Cardenas (1994) analyzes the benefits to producers from consumption smoothing through price stabilization by marketing boards. The model assumes that producers must assign price setting power to the marketing board. In Cardenas’ model, a parameter represents the weight assigned by the marketing board to producer welfare. The theoretical results show that producers are willing to pay for price stabilization. Statistical analysis of world coffee prices, domestic producer prices, and exchange rates are carried out for four coffee exporting countries: Colombia, Costa Rica, Co^te d'Ivoire, and Kenya. The analysis finds differences in policies across the countries for both the share producers receive of the world price and the influence of exchange rates on producer prices. Gersovitz and Paxson (1992) also focus on the intertemporal aspects of exporting country policy and, similar to this paper, analyze an international commodity market institution. The paper focuses on sugar quotas to the EC where an exporter can sell to the EC and/or a residual market where the price has been both above and below the EC price. An exporter's quota is equal to previous exports so undershipping the quota reduces the quota for future periods. Gersovitz and Paxson develop a dynamic, stochastic programming model that solves for the optimal allocation of dependence may be higher and significant in more countries because marketing board profits are not included in the data.
6 exports. Their discussion focuses on the situation where exporters have an incentive to fill their quota even though the EC price is below the residual market price. Future access to this market at possibly high prices can provide an incentive to sell at a loss in the short run. Their model calculates the relative price at which an exporter will fill the EC quota. Gersovitz and Paxson discuss how their model could be extended to analyze optimal exporting country policy with ICA quotas. They believe that the important complications are that ICA export quota quantities are not fixed and that, "ICA quotas have been sufficiently high and coffee production sufficiently variable that many countries sometimes produced less than their quota." (p. 184) Given these assumptions, ICA quotas change the incentives for a country to hold stocks. Several papers analyze coffee policy in an individual exporting country. Bohman et al. (1996) analyze rent seeking caused by ICA quotas and focus on Indonesia where ICA quotas are found to have reduced producer prices slightly. Lopez and Yao (1993) estimate the oligopsony power traders have on the producer price in Haiti. They include ICA quotas as an explanatory variable and find that quotas increase middlemen market power. Jaramillo (1989) develops a dynamic model of optimal policy for Colombia incorporating stocks, but not the nonmember market. The optimal policy is to lower the producer price to reduce stocks to their optimal level as soon as possible. McMahon (1989) analyzes Kenyan policies that restrict planting of coffee to meet ICA quota limits using a computable general equilibrium (CGE) model. He finds that a coffee tax combined with increased coffee plantings would have reduced income inequalities because coffee has been a lucrative crop.
7 Theoretical model The objective of the theoretical model is to predict the policy response of exporting countries to ICA export quotas and to determine the resulting effect on the income distribution. To find the impact of ICA quotas, an objective function, which allows for a range of government policy preferences, is specified both with and without quotas. The optimal pricing rule is derived for both objective functions and compared for three benchmark cases representing different government preferences. The policy problem can be stated with the domestic producer price as the sole decision variable. The government maximizes utility from the coffee sector, subject to varying weights on the welfare of two types of income, producer surplus and the domestic rents associated with coffee exports. Producer surplus measures the government's concern for producer welfare and/or foreign exchange earnings (through the relationship between available supply for exports and producer incentives). Rents from exports measure either government revenue and/or private gains.7 The model assumes that the exporting country does not affect the world market price.8 The supply curve represents the long run situation after producers have adjusted their capital stock of trees. Other assumptions are that domestic markets are assumed to clear and there is no long run change in stocks, no domestic consumption occurs,9 and quota shares are exogenously determined by the ICA.
7
Previous research on coffee that includes different government preferences are Cardenas (1994) and Bohman et al. (1996). Other papers on coffee or export quotas assume the same weights on all groups. 8
Although not given in the paper, we have generalized the results to the large country case. The only difference between the large and small country cases is that a country should impose the optimal export tax when it has market power in either the member or nonmember markets. 9
In most, but not all countries, consumption is a small proportion of output. Including consumption in the model did not change the results regarding the effect of ICA quotas on the optimal producer price which is the focus of this paper.
8 The policy objective function with ICA quotas in effect is given by equation (1). The member market price is PA, the nonmember market price is PN, the ICA quota is q , the supply function is f(p), and the domestic producer price is p. Weights on producer surplus and rents from coffee exporting are given by δ1 and δ2, respectively. The first constraint limits producers’ revenue to total export revenues and thus eliminates the possibility of subsidies to the coffee sector (not a strong assumption given that export crops are usually a source of government revenues). The second constraint limits member market exports to the quota amount. p
Max W = ! 1 [ " f(x)dx] + ! 2 [( P A - p)q A + ( P N - p)(f(p) - q A )] p
0
s.t. (i) ( P A - p)q A + ( P N - p)(f(p) - q A ) # 0
(1)
(ii) q A $ q The Kuhn-Tucker conditions from (1) are given by equations (2) to (5) where the Lagrangean multiplier for the first constraint is λ and the second constraint is assumed to hold and has been substituted into the objective function. The quota will be nonbinding only if the exporting country cannot supply the quota amount at the member market price (e.g., supply shortage).10 ∂W/∂p = δ1 f(p) + δ2 [(PNf '(p) - pf '(p) - f(p)] + λ[(PNf '(p) - pf '(p) - f(p)] ≤ 0
(2)
p [∂W/∂p] = 0
(3)
∂W/∂λ = (PA - p) q + (PN - p)(f(p) - q ) ≥ 0
(4)
λ [∂W/∂λ] = 0
(5)
The objective function without ICA quotas is given by equation (6). The (sole) world price is PF . The first order conditions are not given to save space. 10
The model and empirical analysis focus on the 23 largest coffee exporting countries that had a “Basic Quota” under the 1983 ICA and accounted for 95 percent of coffee exports. Data show that these countries exported their full quota amount and were constrained by ICA quotas. The 23 smaller exporting countries (Article 31 list) included countries that did not always export their quota amount (e.g., Burundi and Rwanda).
9
p
Max W = " 1 [ # f(x)dx] + " 2 [( P F - p)(f(p)] p
0
(6)
s.t. ( P F - p)(f(p) $ 0
!
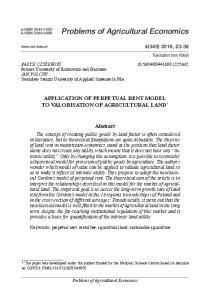
To examine the effects of imposing ICA quotas on the optimal producer price, three benchmark cases are used, each defined in terms of a specific weighting of coffee sector revenue: δ1 = δ2 , δ1 = 0, and δ2 = 0. In each case, the optimal producer price is derived with and without quotas. The two producer prices are compared to determine the impact of ICA quotas. See Appendix 1 for details on the derivation of the pricing rules. Efficient pricing: δ1 = δ2 This case, which can be interpreted as maximizing the equally weighted sum of producer surplus and government revenue, yields the efficient outcome in terms of world price signals. If p* represents the optimal price with quotas, the pricing rule reduces to p* = PN, i.e., the optimal domestic price equals the marginal return from world markets. Figure 1 illustrates the outcome for this case. In Figure 1, f(p) represents domestic supply. Marginal revenue with quotas is discontinuous at q and the two segments are given by the perfectly elastic member and nonmember market demand curves, PA and PN. The optimal producer price equals PN and rents, equal to (PA - PN) q , accrue to quota holders. Under free trade, exporting countries set the optimal domestic price equal to the free trade price, p** = PF where p** represents the optimal domestic price under free trade. Therefore, the effect of quotas on producers depends on the relationship between PN and PF. ICA quotas make producers worse off if PN lies below PF. Producers may benefit indirectly from the rents via government
10 expenditure effects, reductions in other taxes, or ownership of export firms that obtain quota rents. Maximize export rents: δ1 = 0 This case can be interpreted as placing no weight on producer surplus in pricing policy and permitting either the government or a private monopsonist to maximize rents from coffee exports. This case has two solutions because marginal revenue is discontinuous at q . Over the first segment (zero to q ), and if the supply curve intersects marginal revenue where it is discontinuous, the country only exports the quota amount and the producer price equals the supply price for the quota amount, f -1( q ). The pricing rule for the second segment (quantities greater than q ) is derived from the Kuhn-Tucker conditions and equals the familiar formula for the optimal revenue tax where εS is the supply elasticity: (PN - p*)/p* = 1/εS. This relationship can be re-written to solve for the optimal producer price: p* = [PN/(1 + PN)] εS . Figure 1 shows the result when no exports are sold to the nonmember market. The optimal producer price equals the supply price for the ICA quota amount. Per-unit quota rents equal the difference between PA and the quota supply price, PQS. Under free trade, when δ1 = 0, the optimal producer price is also determined by the formula for the optimal revenue export tax: p** = [PF/(1 + PF)] εS. In Figure 1, without quotas, the equilibrium quantity is determined by the intersection of f '(p) and PF. The optimal producer price is the supply price for the equilibrium quantity. The imposition of quotas in Case 2 causes the optimal producer price to fall under easily satisfied conditions. If there are no exports to the nonmember market, the optimal producer price falls if the quota is less than free trade exports. This is the likely case given that quotas were designed to decrease exports. If there are exports to the nonmember market, the optimal producer
11 price falls if PN < PF. This can be shown by taking the derivative of p** with respect to PF: dp**/dPF = εS(1/(1+PF)2) + (dεS/dp)(dp/dPF) = εS(1/(1+PF)2) (1/(1-dεS/dp)) > 0 . Maximize producer revenue: δ2 = 0 This case can be interpreted as placing a weight only on producer surplus, leading to a policy that provides producers with all export revenues. The constraint against subsidies is always binding and the producer price equals the average revenue from member and nonmember market sales. The optimal producer price depends on the shape of the domestic supply curve as well purely exogenous variables.
p* =
P A q + P N (f(p*) - q ) f(p*)
In Figure 1, the AR curve represents average revenue for exports assuming that the quota is filled before any sales are made to the nonmember market. The equilibrium occurs where AR intersects the supply curve, f(p). Without quotas, the producer price that maximizes producer surplus given the constraint prohibiting domestic producer subsidies equals the free trade price. Thus, with free trade, the optimal producer price with δ2=0 is the same under the efficient pricing rule (δ1 = δ2 ). The effect of quotas on the producer price when δ2 = 0 depends on the shape of the supply curve, the size of the quota relative to free trade exports, and the proportional relationships between PA, PF, and PN. In theory, producers are most likely to benefit from quotas under this case, though we believe they usually lose. Figure 1 shows the situation where PAR lies below PF and quotas cause the producer price to fall.
12 Summary of theoretical results Table 2 summarizes the pricing rules for the three cases and the conditions under which quotas lower the domestic producer price. For the cases when δ1 = δ2 and δ1 = 0, the impact of the quotas depends on whether PN is less than PF. This almost certainly occurred during the 1980s quota regime. Thus, producer prices should fall whenever quotas are introduced for all welfare weights between these two cases. δ2 = 0 is the only case where the producer price can increase as a results of ICA quotas. Data for observed values of PA relative to PN and estimates of PA relative to PF from Akiyama and Varangis (1990) can be used to order these prices. PA is observed to have exceeded PN by about 40 percent, on average (column (1), Table 2). Akiyama and Varangis use a detailed model of the world coffee market11 to estimate the impact of the ICA on coffee prices and export revenues. They estimate that PA exceeded PF by about 15 percent. Therefore, during the 1980s quota regime world prices were ordered as PA > PF > PN. The creation of a secondary market among importers and the relationship of the price in that market to both the free market and member market prices has also been analyzed in two other papers. Herrmann (1987) shows theoretically that the price effect on the non-regulated market depends on parameters of the supply and demand curves in both markets and the rigidity of the quota policy. Given accepted estimates of these parameters, his model suggests that the nonmember market price will lie below the free trade price. Herrmann (1986) estimates that the
11
Akiyama and Varangis’ (1990) model includes a detailed specification of demand, supply, and stockholding behavior. Stocks increase when quotas are in effect. The stocks are subsequently released when quotas are lifted when the price goes outside the target range (as in 1986) or the agreement collapses (after 1989). Changes in stock holding behavior cause the free trade price to be lower than it would have been if quotas had never existed (e.g., in 1986 a 24 percent decline occurs). Although the simulation does not cover the 1987 and 1988 quota years, the price collapse in 1989 following the suspension of the quotas provides, further evidence of the price depressing impact of a build-up in stocks. Overall, the ICA appears to have raised prices when quotas were in effect, but the build-up of stocks led to lower prices afterwards.
13 nonmember market price was above the free trade price in 1982 and below it in 1983. A possible explanation for the contradictory 1982 result is that quotas had just taken effect and countries were holding stocks rather than sell on the nonmember market. Empirical evidence on exporting country policy Two sources of empirical evidence regarding the policy response of specific exporting countries to ICA quotas are presented. First, we discuss available information on coffee policy during the quota regime. Second, annual data on domestic and international coffee prices are used to determine the impact of quotas on the domestic producer price. Policy information This section reports information on policies exporting countries used to allocate quotas and other policies that affected producer prices during the 1980s. This information was collected for a limited number of countries through field research, correspondence, and a review of published materials. The information reviewed shows variation across countries in the policies adopted and that these policies can be broadly categorized by Cases 1, 2, and 3. The theoretical model does not specify which policy instruments are used to set domestic prices. Cases 1 and 2 can be achieved by levying an export tax, with the appropriate tax calculated from the pricing rules in Table 2. The treasury then captures the domestic quota rents. The optimal producer price in Case 1 can also be achieved by auctioning export quotas or by granting quotas to exporters. Each case, including Case 3, can also be achieved through a parastatal marketing board, allowing either the treasury or the parastatal to extract the value of the domestic quota rents or allowing the parastatal to return total revenue to producers by pooling revenue from the two export markets. The optimal price in Case 3 can also be achieved by tying the rights to export quotas to an appropriate amount of prior exports to the nonmember market (cross-subsidization). Policies can be
14 mixed to obtain results intermediate to those derived and the choice of policy instruments can have additional welfare effects in the exporting country if it leads to rent seeking or inefficient marketing.12 Two countries had policies during part of the quota period that set the marginal export price equal to the nonmember price and also captured some or all of the quota rents as government revenues. In 1985, Honduras eliminated taxes on nonmember market exports while taxing quota exports. However, the ICA forced Honduras to tax member and nonmember exports equally to stop what the ICA said was promotion of discount sales on the nonmember market. From 1987 to 1989, Brazil auctioned quotas and the coffee marketing agency kept the revenues, thus capturing all quota rents. Each of these policies would signal traders to buy at the farmgate equivalent of the nonmember market price, provided there were no additional taxes. Several countries distributed quotas to exporters without charging a fee. Bolivia, Costa Rica, Co^te d'Ivoire, Ecuador, Guatemala, Honduras, Mexico, and the Philippines gave quotas to coffee traders, with the allocations based on past export shares of individual export firms or on other similar market-based criteria. This policy placed quota rents in private hands, with no incentive to pass them on to producers and should have resulted in a producer price approximately equal to PN as in Case 1, though private traders, rather than the government, would have captured the rents. In contrast, the African robusta exporting countries taxed exports heavily, suggesting that their governments had preferences similar to those described by Case 2. The policy instrument used by these countries was a parastatal marketing board that fixed nominal producer prices well below world prices. These policies facilitated extraction of quota rents by the marketing boards. The countries exported only small quantities to the nonmember market (column 7, Table 1) which 12
The choice of policy instrument can significantly affect welfare in the exporting country if it leads to rent seeking. See Bohman, et al. (1996) for analysis of the importance of quota rents in analyzing the effect of the ICA.
15 suggests that the marketing boards set the producer price close to the supply price for the ICA quota amount, as predicted by Case 2. The impact of quotas on monopsony power by middlemen in Haiti was tested by Lopez and Yao (1993). In Haiti, exporters belong to a producer organization that imposes internal quotas even when ICA quotas are not in effect. Lopez and Yao found that the monopsony power of coffee exporters increased when ICA quotas were in effect, suggesting that “effective international cartels result in greater collusion among exporters in agreeing how to share the ICA quotas.” (p. 9). Evidence exists that three countries followed policies consistent with Case 3. In Kenya, coffee producers exercise significant political power in the formulation of coffee policy (Bates, 1989; McMahon, 1989). Export taxes have always been minimal and, when quotas were in effect, producers received a weighted average price from member and nonmember market sales (Akiyama, 1987). New coffee plantings were regulated to restrict output (McMahon). In Indonesia, Bohman et al. (1996) found that the tying of member and nonmember market exports also raised producer prices above the nonmember market price when quotas were in effect. Temu (1991) found a similar result in Papua New Guinea. Jaramillo (1990) analyzes the policy response of exporting countries to the collapse of world prices following the end of ICA quotas in 1989.13 Brazil, Colombia, Costa Rica, El Salvador, and Ethiopia reduced export taxation rates to cushion the impact of the fall in world prices. Their response is consistent with Cases 1 and 2 of the model where countries increase taxation when quotas are imposed. For Costa Rica, Mexico and El Salvador, Jaramillo also presents detailed information on the relationship between world and domestic prices during the 1980s and calculates
13
Jaramillo (1990) does not present a formal model of optimal policy with or without export quotas. He argues that countries should maintain production incentives because prices had fallen below long term equilibrium rates and assume that the country has a long term comparative advantage in coffee production.
16 both direct taxation and indirect taxation (or subsidization) from exchange rate misalignment. Each country is discussed below. During the 1980s quota regime, Mexico followed policies that are broadly consistent with Case 1. Different policies applied to small and large farms. For small farmers, a parastatal organization set a minimum price which was sometimes above world price levels, necessitating a subsidy. Larger farmers were taxed through a requirement to sell coffee to the domestic market at subsidized prices. A special tax was levied to finance subsidized nonmember market exports, but pressure from the ICA ended these subsidies. During the 1980s when ICA quotas were in effect, the average tax on Mexican coffee exports equalled 20 percent. Although not directed towards the coffee sector, exchange rate undervaluation provided an average subsidy of 5 percent during the same years. Quotas were given to exporters based on reported stocks. Therefore, exporters and not the government captured the quota rents. Following elimination of ICA quotas, the Mexican government liberalized coffee policies, gradually eliminating the guaranteed minimum producer price and consumer price subsidies. Overall, the existence of ICA quotas appears to have increased producer prices for small farmers, reduced prices for large farmers, and increased profits of exporters who obtained the quotas. Costa Rica had a highly regulated coffee sector during the 1980s with a parastatal organization that managed taxation and the domestic marketing structure. Direct taxes on coffee averaged 23 percent during the 1980s quota years. Jaramillo (1990) states that, “Taxes in the 1980s were higher in an attempt to control over production crisis,” (p. 36) indicating that ICA quotas lowered producer prices as predicted by the model. Costa Rica appears to fall between Cases 1 and 2 with the quota rents going to coffee millers who received the quotas without a fee based on past performance. Following the lifting of quotas in 1989, Costa Rica lowered export taxes.
17 El Salvador’s coffee policy during the 1980s clearly falls into Case 3. A parastatal organization had sole authority to export all coffee and producer prices were lower than in neighboring countries. During the period when quotas were in effect during the 1980s, the average direct tax was 23 percent and the indirect tax from an overvalued exchange rate was 36 percent. The high level of total taxation resulted in falling production and El Salvador had difficulty in some years meeting the quota amount.14 In 1989, prior to the end of quotas, El Salvador reformed the coffee sector to provide better incentives to producers. Consistent with the predictions of our model, the government had an incentive to increase producer prices and output because the ICA quota did not constrain exports. Price relationships using domestic and trade data The pricing rules set forth in Table 2 indicate that the relationship between the producer price, PD, and the nonmember market price, PN, provides a general classification of the government preferences in the coffee sector. For countries with preferences as in Cases 1, 2, and 3, we expect PD = PN, PD < PN, and PD > PN, respectively. Data for the 1980s quota regime is used to calculate the ratio of PD/PN for each country and classify countries by policy orientation.15 Table 1, column 5 provides the relative price ratios for PD/ PN (expressed as percentages) constructed from data reported by the ICO for years when quotas were in effect from 1981 to 1988. The percentage PD/ PN varies from 27 to 129 percent supporting the previous observation based on 14
Jaramillo (1990) argues that producer incentives and not the war in El Salvador account for the decline in output. He states, “Coffee growers and independent observers attribute the bulk of the decline [in output] to falling production incentives caused by adverse economic policies. The latter include the substantial exchange rate overvaluation of the 1980s, the outdated export tax and the inefficient commercial policies by the ... parastatal in charge of coffee marketing.” (p. 93) 15
The 1980s quota regime is more indicative of country behavior because quotas were better enforced than the 1963-72 quota period. Quotas became effective October 1, 1980 after over eight years without quotas. In March 1976, coffee supply shortages caused by adverse weather caused the world price to rise above the upper limit of the indicator price range and quotas were lifted. Quotas were then reimposed in October 1987, remaining in effect until July 1989, when they were suspended after negotiations to renew the ICA collapsed.
18 PD/PA that coffee policy varies widely across countries. To compare the observed ratios with the pricing rules in Table 2 requires adjustment because domestic marketing costs reduce PD below PN. Reported information on marketing costs (Jaramillo, 1990; Bohman et al, 1996; Dauster, 1995) indicates that 10 percent is a reasonable assumption. The adjusted price ratios for the different cases are: Case 1, 80 to 90 percent; Case 2, less than 80 percent; Case 3, greater than 90 percent. Data on observed relationships between PD and PN must be utilized cautiously since the observed relationships can be biased by the known tendency of some countries to systematically overreport PN. No adjustment is made for overreporting of nonmember market prices such that our estimates are lower bounds for actual ratios. Also note that we have allowed for a range of values to classify countries as Case 1. The classification of countries is shown in Table 1, column 8. Two countries have ratios between 80 and 90 percent, indicating that they follow policies consistent with the preferences underlying Case 1. Thirteen countries have ratios which are less than 80 percent and may be interpreted to follow policies consistent with Case 2. Five countries have ratios greater than 90 percent and fall under Case 3. Although each case is represented, during the quota regime most countries appear to tax coffee more heavily than was economically efficient (i.e., assuming δ1=δ2) during the quota regime. This result is consistent with the general treatment of agricultural export crops in developing countries (e.g., Krueger et al., 1988). Nearly all countries that tax heavily are African, but include Brazil, long the world’s largest coffee exporter.16 Most of the countries follow policies represented by Cases 1 and 2, where, according to the theoretical model, ICA quotas unambiguously lower the domestic price. 16
The optimal price ratio for a country following a monopsonist or revenue maximizing strategy (Case 2) ranges between 0.33 and 0.6 for long term supply elasticities ranging between 0.5 and 1.5. Although the long term supply elasticity is large, fairly small economic losses are implied by such pricing. The main effect is distributional. See Bohman et al. (1996) for estimates of deadweight losses in Indonesia.
19 Under all cases for countries’ policy preferences, data on the degree that nonmember market prices were discounted relative to member market prices (PN/PA) and the share of exports sold on the nonmember market (qN/(qA+qN)) provide evidence of the degree to which nonmember market prices put downward pressure on producer prices.17 These data are given as percentages in Table 1, columns 6 and 7. Column 6, which shows the amount of discounting, should be viewed as an upper bound because over reporting of nonmember market prices to avoid the appearance of violating ICA rules was widespread. The lowest percentages are probably representative of prices received for each type of coffee. Reported percentages of PN to PA are as low as 47 percent (El Salvador) with a large number around 60 percent. This supports the conclusion that PN was less than PA. Sales to the nonmember market represent residual supply after filling the ICA quota share and are related to the degree to which the quota is binding (Bohman and Jarvis, 1990). The data show that the nonmember market was important for a large number of countries and some countries were heavily dependent on the market: 13 countries sold over 10 percent of exports in this market. The large share on nonmember market exports combined with price discounting suggest that total revenue for these countries may have fallen with ICA quotas (a result also found by Akiyama and Varangis (1990) for many of the same countries). Four countries in the sample sold less than five percent of their total exports to the nonmember market, and all fall into Case 2 with high taxation that kept production just at the quota amount. Econometric test for impact of quotas on producer price This section develops an econometric test of the hypothesis that ICA quotas usually induced an exporting country to lower the domestic producer price relative to what it would have been under free trade. Equation (7) (given below) is estimated for each country to determine the relationship 17
If the nonmember market did not exist, the absolute restriction on exports would be more severe and there would be even greater pressure to reduce production to avoid a build-up in stocks.
20 between the domestic producer price, the member market price, and other variables, including dummy variables to capture the effect of quotas on the slope and intercept of PA. The equation estimated is general in the sense that no assumptions about weights on the different components of the objective function are necessary. The equations, once estimated, are then used with an exogenously provided estimate of the counterfactual world price under free trade to simulate the produce price under free trade. The simulated producer price is compared to the estimated producer price under the quota regime to obtain a measure of the net effect of quotas. Equation (7) was estimated for each country using OLS and if autocorrelation was found corrected using a grid search procedure. Estimation was carried out with the SHAZAM econometrics package (White, 1993). PDt = β0 + β1 PAt + β2 RERt [+ β3 Qt] [+ β4 PDt-1] + β5 D1t + β6 D2t + β7 (D1t •PAt) + β8 (D2t• PAt ) + et
(7)
PD is measured as the real domestic producer price in local currency units. PA is measured as the real export unit value to the member market in U.S. dollars and β1 has an expected positive sign. RER is a real exchange rate index defined as (E(PT/PNT)) where E is the nominal exchange rate expressed as local currency units per dollar and PT and PNT are the prices of tradables and nontradables, respectively. The real exchange rate is calculated using the U.S. producer price index and domestic CPIs to measure the prices of tradables and nontradables, respectively (Edwards, 1988). A basket of currencies was not used because coffee trade is denominated in dollars. An index is constructed using 1985 as the base year. As defined, an appreciation results in a fall in the real exchange rate and β2 has an expected positive sign.18
18
The real exchange rate may be influenced by the domestic coffee price in countries where coffee comprises a significant share of export earnings. We chose not to correct for endogeneity because it would be difficult to find good instruments for the exchange rate which is determined by broad macroeconomic factors as well as the coffee
21 Domestic production (Q) was included as a variable for all countries in preliminary regressions and dropped if it was not significant. Domestic production should affect the producer price in cases where (δ1) does not equal (δ2), i.e., if factors other than world price signals are used in setting producer prices. Increases in production will have a negative effect on producer price if excess production is sold on the nonmember market at discounted prices, and a positive effect if the optimal revenue tax or private monopsony power plays a role (the exact relationship depends on the elasticity of supply). In those cases when the production variable was dropped, there was little or no effect on the estimated price coefficients. In several countries, especially those where marketing boards control coffee exports, a lag is evident in the response of producer prices to world prices. To account for this, a lagged dependent variable was included in preliminary estimation and deleted if not significant. Similar to the production variable, deleting this variable had little or no effect on the estimated elasticities. The hypothesis that ICA quotas changes the relationship between the producer price and world prices is investigated with tests for structural change using dummy variables. Separate dummy variables are included for both quota regimes as they were qualitatively different.19 D1 is a dummy variable equal to 1 when the quotas are in effect in the early period and D2 is a dummy variable equal to 1 when the quotas are in effect in the late period. Structural change from the quota regime is specified such that it can affect both the intercept and slope coefficient for the world price. This recognizes that export taxes are levied both on a perunit and on a proportional basis in exporting countries. The effect of per-unit taxes is captured by price and the relatively small sample size is not appropriate for sophisticated econometric techniques. In addition, coffee is a perennial crop and a lag exists between the current domestic producer price and coffee production such that the contemporaneous endogeneity problem is not likely to be large. 19
We utilize data from 1966 to 1988 which includes two distinct periods of export quotas. Quotas (implemented in 1963) remained in effect until 1972. After an eight year hiatus, quotas were implemented on October 1, 1981. The 1980s quota period has been described previously in the paper.
22 the intercept and that of proportional taxes by the price coefficient. Quotas can affect both. The coefficients for the dummy variables on the intercept and price coefficient can have opposite signs and the net effect of the two dummy variables on the estimated producer price is a function of the estimated coefficients of the dummy variables and the level PA as shown by the derivative of PD with respect to D1: ∂PD/∂D1 = β5 + β7PA . Equation (8) is used to simulate the producer prices that would have existed from 1981 to 1985 if quotas had not been in effect by using the estimated equation (7) with quota effects set equal to zero and the observed value of PA (with quotas) replaced by estimated world prices in the counterfactual case of no ICA quotas. PFDt = B0 + B1 PFt + B2 RERt [+ Β3 Qt] [+ Β4 PFDt-1]
(8)
PFD is the calculated domestic price without quotas, the B's are the estimated values of the β coefficients, and PF is the estimated world price without quotas from Akiyama and Varangis (1990).
Results Table 3 provides selected information from the estimation of equation (7) and shows that it explains a high percentage of the variation in the domestic price.20 In order to examine the plausibility of the coefficients, the elasticities were calculated for the member market price, real exchange rate, and where relevant, production and the lagged domestic price. See Table 3. For example, for Colombia the producer price elasticity of 0.46 means that a 10 percent increase in the member market price results in a 4.6 percent increase in the domestic price. In general, the elasticities are significant, have the expected sign, and are of the appropriate magnitude. Only two (out of 40) elasticities for price and the real exchange rate have incorrect signs and neither is
23 significant. Values of elasticities greater than one occur in a few equations and could be explained by taxation such that the same absolute change in both world and domestic prices results in a greater than 100 percent change in the domestic price variable. The results from tests for structural change are presented in Table 4. The first two columns present the test statistics and their values for the general test for the joint significance of dummy variables for structural change in the slope and intercept in both quota periods (β5 = β6 = β7 = β8 = 0). The test statistic indicates significant structural change in 10 out of the 20 countries. Further tests for structural change were conducted for countries where the general test statistic was not significant. First, structural change in only the price variables was examined with a joint test for significance of β7 and β8. The test was not statistically significant for any country and is not reported. Next, a separate regression was estimated which included only dummy variables for structural change in the intercept in both quota periods. A test for joint significance of these variables was statistically significant only for Mexico. These results are reported in a second line for Mexico in Table 4, but not for the other countries where the test was insignificant. The final tests for structural change were for the two separate quota periods for both the intercept and price variable and were calculated for all countries. The joint significance is tested for coefficients on β5 and β7 for the 1960/70s quota regime and β6 and β8 for the 1980s quota regime. The test statistics and values are given in the third through fifth columns of Table 4. The 1960/70s quota regime dominates structural change in Ecuador and Cameroon and the 1980s regime was prevalent in Tanzania, Costa Rica, Brazil, and Burundi. The rest of the countries show both periods to be significant.
20
All results from estimation of equation (7) are not given because of space considerations and are available from the authors.
24 The ICO and FAO publish coffee sector data. Their data are similar, but not identical. Industry sources suggest that ICO data are more accurate because the ICO has exerted additional effort to verify the coffee sector data reported by its member countries. The results reported for equation (7) use ICO data and a linear model. Our theory suggests that domestic producer prices are related to member and/or nonmember market prices when quotas are in effect, to the exchange rate, domestic and export taxes and other aspects of domestic policy, as well as the country quota. These relationships are approximated by a linear model. The number of observations are limited and the number of years during which quotas were in effect are still more limited. To check for the robustness of our results, we estimated the linear model using FAO data and a model with all variables (except for the dummy variables) in logs using both ICO and FAO data. A comparison of the four estimated equations (ICO linear, ICO log, FAO linear and FAO log) found highly similar results in terms of equation R2 and estimated price coefficients, but differences were found in other aspects, including the significance of the slope and intercept dummies. However, the equations did predict similarly in terms of the test for structural change over all dummy variables. Nine (of 20) countries showed the same result for each of the four equations in terms of the test for structural change when quotas were imposed and 7 countries showed the same result for 3 of the four equations. In 4 countries, the results split evenly, along the lines of data source. Simulation results The net effect of the imposition of quotas on the produce price during the 1980s quota years is reported for all countries in the last column in Table 4. The reported number represents the average of annual changes from 1981 to 1986 expressed as a percentage. The results for countries
25 where significant structural change was not found in the 1980s quota period should be viewed cautiously. Still the results suggest substantial support for our hypothesis. The individual country results from the simulations support the theoretical model. Considering all countries, producer prices were lower with quotas in 15 of 20 countries. Of the five countries where prices are estimated to have risen or stayed the same, only two, Burundi, and Rwanda showed significant structural change for the 1980s quota period. Among the countries with significant structural change in the 1980s, quotas lowered producer prices for five of seven countries. Again, producer prices are simulated to have increased because of quotas only in Burundi and Rwanda. The fact that quotas had a significant and positive impact on producer prices only in Burundi and Rwanda strongly supports the theoretical model. These two countries were included because, unlike all other countries included in this study, quotas did not constrain their exports during the 1980s. The contrast between the results for quota constrained countries and Burundi and Rwanda indicates that, as predicted, ICA export quotas either pressured governments to lower producer prices or sales to the nonmember market caused exporters to pay producers the nonmember market price for coffee. Nearly all of the estimates are reasonable. Excluding El Salvador, the estimates range from - 47 percent (Brazil) to 11 percent (Zaire, the only country with an estimated positive effect among these countries) for the 17 countries for which theory suggests that either a positive or negative value is feasible. The average value of the predicted effect of imposing quotas on the producer price for the 17 countries is -14.8 percent. If an average is calculated for only the 8 countries for which the test for structural change is significant, the average is -15.3 percent. The overall stability of the
26 estimates provides additional support for the hypothesis that the imposition of ICA export quotas tends to depress producer prices by a moderate, but significant amount. Conclusions The paper investigated theoretically and empirically the effect of ICA quotas on producer prices in coffee exporting countries. The theoretical analysis showed that the effect of quotas on producer prices can depend on government policy preferences. Producer prices can increase or decrease when quotas are imposed, but a negative impact is found to be more likely under the range of government preferences considered. Policy information collected from a number of countries, as well as empirical analysis of price and quantity data for 20 coffee exporting countries, support a view that countries varied their domestic coffee policies to systematically affect the producer price, the amounts produced and exported to the member and the nonmember markets and the distribution of income, including treasury revenues. Most countries followed policies which suggest a preference for rents relative to producer surplus, with a loss in economic efficiency. Such rents were sometimes captured by the treasury, but were often given free to exporters. An econometric-simulation analysis also supported the hypothesis that quotas led to a decrease in the domestic producer price for more than threefourths of the countries where quotas were binding. The theoretical and empirical analysis show that the degree to which ICA quotas affect producer prices and, consequently, output relative to free trade, varied across countries. Discretion in domestic policy gave countries the ability to manoeuvre within ICA by setting producer prices to expand production relative to other countries. Any such expansion fed back into one of the most contentious issues faced by the ICA -- the allocation of export quotas among countries.
27 Two conflicting positions were argued within the ICA regarding changing export potential over time and the resulting quota adjustment. One group of countries that had achieved large increases in production over time found that their quotas eventually covered only a relatively small share of exports, e.g., Indonesia, which sold half of its exports on the nonmember market in 1985. These countries argued that they had become more competitive and that quota shares should have been changed to reflect this reality. Other countries had stagnant or declining production and sold most of their output on the member market, i.e., Brazil, and argued that their performance was a result of measures they had taken to support the ICA by restricting output and nonmember exports, and that their quotas were fully justified. Of the 20 countries analyzed in this study, seven sold more than 15 percent of their exports on the nonmember market: Costa Rica, Ecuador, Guatemala, Honduras, India, Mexico, and Indonesia. The data on observed price ratios, PD/PN, indicates that the seven countries have different policy preferences. Three countries (Guatemala, Mexico, and Indonesia) fell into Case 3, which predicts relatively high producer prices. Two (Costa Rica and Ecuador) fell into Case 1, producer price equal to the nonmember market price, and two (Honduras and India) fell into Case 2, maximize taxation of coffee, although each of the latter countries has a relatively high ratio which puts them close to Case 1. In each of these theoretical cases, quotas are likely to cause the producer price to fall. The econometric-simulation analysis suggests that all seven countries with a high proportion of nonmember market exports decreased the producer price when quotas were imposed. Thus, there is little evidence here that countries which exported a high proportion of their exports to the nonmember market during quota periods passed on the increase in world prices to their producers. Our research supports the conclusion that countries with small nonmember market exports, had high
28 levels of taxation that reflected underlying policy preferences. For example, the African robusta exporters (Cameroon, Co^te d’Ivoire, Madagascar, and Zaire in our data) had a long history of heavy taxation of coffee and their policies probably reflected these preferences more than a specific intent to support the ICA. The econometric-simulation results predict that two of the four countries increased their producer price during the ICA quota regime, possibly to sustain sufficient production to meet their quota. The coffee tax extracted from consumers was inherent to the price raising aspects of the ICA. Consumers were thought to support the agreement based on a desire to assist farmers in developing countries, although politics at the national government level were probably the dominant factor in decisions to initiate and maintain the ICA. The producer price decline which quotas appear to have caused, and the associated distributional effects, were not foreseen. The analysis of the effects of ICA quotas on domestic producer prices shows the inherent conflict in any quota based agreement between helping holders of the quotas, which have value as a result of the agreement, and producers, whose prices must be depressed if long run output is to be restricted to a level consistent with the higher prices desired. This conflict goes to the heart of efforts to alter the commodity terms of trade. Efforts to benefit an exporting country, in order to channel increased incomes to governments (or, perhaps unintentionally, exporters) in the developing country, must accept the likelihood of worsening producer incomes. Alternatively, this trade-off becomes another argument against such efforts.
29 Appendix 1. Derivation of pricing rules from theoretical model
δ 1 = δ2 If δ 1 = δ2 , then the constraint on government revenues will not be binding and λ=0. Price will be positive, therefore ∂W/∂p = 0 Therefore, from equations (2) and (3) δ 1 f(p) + δ2[PNf '(p) - pf '(p) - f(p)] = 0 This expression can be simplified to: PN = p.
δ1 = 0 If δ 1 = 0, and no welfare weight is attached to producer surplus, then the constraint on government revenues will not be binding and λ=0. Price will be positive, therefore from equation (3) ∂W/∂p = 0 Therefore, from equation (2), δ2[PNf '(p) - pf '(p) - f(p)] = 0 This expression can be simplified to: (PN - p) f '(p) = f(p) or (PN - p) = f(p)/ f '(p) Recognize that f(p)=q and f '(p) = dq/dp. Rewrite and multiply by 1/p. (PN - p)/p = dp/dq*q/p or (PN - p)/p = 1/εS
δ2 = 0 If δ2 = 0, then only producer welfare is considered in establishing prices. The government budget constraint will be binding and λ > 0. Therefore, from equations (4) and (5), (PA - p) q + (PN - p)(f(p) - q ) = 0. Rewrite as: PA q - p q + PNf(p) - PN q - pf(p) + p q = 0 [PA q + PN(f(p) - q )]/f(p) = p
30 References Akiyama, T., 1987, Kenyan Coffee Sector Outlook: A Framework for Policy Analysis, Division Working Paper No. 1987-3, Commodity Studies and Projections Division, Washington, D.C. Akiyama, T. and P.N. Varangis, 1990, Impact of the International Coffee Agreement on Producing Countries, The World Bank Review 4(2), 157-173. Bates, R.H., 1989, Beyond the Miracle of the Market: The Political Economy of Agrarian Development in Kenya (Cambridge University Press). Bohman, M., L. Jarvis, and R. Barichello, 1996, Rent Seeking and International Commodity Agreements: The Case of Coffee, Economic Development and Cultural Change 44(2), 379404. Bohman, M. and L. Jarvis, 1990, The International Coffee Agreement: Economics of the Nonmember Market, European Review of Agricultural Economics 17(1), 99-118. Cardenas, M., 1994, Stabilization and redistribution of coffee revenues: A political economy model of commodity marketing boards, Journal of Development Economics 44, 351-380. Dauster, J., 1995, personal correspondence. Edwards, S., 1988, Exchange Rate Misalignment in Developing Countries, (Johns Hopkins University Press, Baltimore). Gersovitz, M. and C.H. Paxson, 1992, Institutional and Intertemporal Influences on the Trade of Developing Countries, American Economic Review 82(2), 180-185. Gilbert, C.L., 1996, International Commodity Agreements: An obituary notice, World Development, 24(1), 1-19.
31 Gilbert, C.L., 1987, International Commodity Agreements: Design and Performance, World Development 15(5), 591-616. Herrmann, R., 1987, Uncontrolled Prices on a Market with Supply Control, Economics Letters 23, 129-33. Herrmann, R., 1986, Free Riders and Redistributive Effects of International Commodity Agreements: The Case of Coffee, Journal of Policy Modelling 8(4), 597-621. International Coffee Organization, 1990, Volume, Unit Value and Value of Exports by Exporting Members to All Destinations: Coffee Year 1989/90 and the Five Quarters Since July 1989, EB 3246/90 (E), December. , 1989a, Indicator Prices, Unit Values and Retail Prices, Long Term Series, WP Agreement No. 15/88 (E), February. , 1988a, Exports, Quotas and Value of Exports, Coffee Years 1965/66 to 1986/87, WP Agreement No. 13/88 (E), July. , 1988b, Exports by Exporting Members to Members and to Non-Members, September 1988 and Coffee Year 1987/88, EB 3051/88 (e), November. International Monetary Fund, 1990, International Financial Statistics, Yearbook. Jaramillo, F., 1990, Policy responses to the collapse of world coffee prices: The cases of Costa Rica, Mexico, El Salvador, Mimeo, The World Bank, Washington, DC. Jaramillo, F., 1989, Supply Response and Optimal Pricing for a Perennial Crop: The Case of Colombian Coffee, Unpublished Ph.D. Dissertation, Stanford University, Food Research Institute. Kravis, I.B., 1968, International Commodity Agreements to Promote Aid and Efficiency: The Case of Coffee, Canadian Journal of Economics 1(2), 295-317.
32 Krueger, A.O., M. Schiff, and A. Valdes, 1988, Agricultural Incentives in Developing Countries: Measuring the Effect of Sectoral and Economywide Policies, World Bank Economic Review 2(1), 255-271 Lopez, R.A., and Z. You, 1993, Determinants of Oligopsony Power: The Haitian Coffee Case, Journal of Development Economics 41, 275-284. McMahon, G., 1989, The Income Distribution Effects of the Kenyan Coffee Marketing System, Journal of Development Economics 31, 297-326. U.S. Department of Agriculture, Foreign Agricultural Service, World Coffee Situation, Various issues. Temu, I., 1991, An Economic Analysis of Coffee Policy and Coffee Development in Papua New Guinea, Unpublished Ph.D. dissertation, Department of Agricultural Economics, University of California, Davis. White, K.J., 1993, Shazam Econometrics Computer Program: Users Reference Manual, Version 7.0 (McGraw Hill, New York).
33 Figure 1. Alternative policies as a function of the producer price
f(p)
f ’(p) PA PF
AR
PAR
PN
PQS
q
q + qN
qAR
34 Table 1. Profile of exporting countries Country
Coffee type+
qA/QA
qN/QN
PD/PA
PD/PN
PN/PA
qN/ qA+qN
Country type‡
(1)
(2)
(3)
(4)
(5)
(6)
(7)
(8)
average 1980s quota period (percent) Colombia
CM
16
10
47
47
100
10
2
Kenya
CM
2
2
81
129
63
13
3
Tanzania
CM
1
1
45
53
85
14
2
Costa Rica
OM
2
5
57
88
65
28
1
Dom. Repub.
OM
1
*
67
78
84
6
2
Ecuador
OM
2
3
63
82
77
19
1
El Salvador
OM
4
1
53
113
47
6
3
Guatemala
OM
3
4
63
95
66
17
3
Honduras
OM
2
2
53
74
72
20
2
India
OM
1
7
63
64
98
45
2
Mexico
OM
4
5
56
97
58
21
3
Brazil
BZ
28
23
32
36
88
12
2
Ethiopia
BZ
2
2
36
30
119
13
2
Indonesia
RB
5
17
83
124
67
38
3
Cameroon
RB
3
1
54
64
85
3
2
Co^te d'Ivoire
RB
6
4
40
41
96
9
2
Madagascar
RB
1
1
31
27
116
12
2
Zaire
RB
2
*
42
42
99
1
2
Burundi
RB
1
*
47
50
93
2
2
Rwanda RB 1 * 51 55 96 4 2 Data are averages for the years during the 1980s when quotas were in effect. All values are expressed as percentages. * less than 0.5% percent. + type of coffee: CM=Colombian milds, OM=other milds, BR=Brazilian, RB=robusta; ‡ type of country: Case 1: 80-90%; Case 2: less than 80%; Case 3: greater than 90%.
35 Table 2. Comparison of producer prices with and without ICA quotas Welfare weights
ICA quota
No quota
ICA lowers producer price if
δ1 = δ2
p* = PN
p** = PF
PN < PF
δ1 = 0
p* = f -1( q ) or p* = [PN / (1 + PN)] εS
p** = [PF / (1 + PF)] εS
q < f (PF) or PN < PF
p** = PF
P A q + P N (f(p*) - q ) < PF f(p*)
δ2 = 0
p* =
P A q + P N (f(p*) - q ) f(p*)
Equilibrium price with quotas, p*; equilibrium price without quotas, p**. Other variables: PA = member market price; PN = nonmember market price; PF = free trade price; q = individual country ICA quota; f(p) = supply function.
36 Table 3. Elasticity estimates from regressions
Country
n
R
Colombia
22
OLS
0.80
0.5 (4.60)a
0.9 (3.59)a
Kenya
23
OLS
0.96
1.1 (22.35)a
2.0 (8.84)a
Tanzania
23
OLS
0.91
0.2 (2.16)b
1.3 (5.59)a
Costa Rica
20
AR1
0.98
0.9 (21.33)a
0.7 (7.93)a
Dom. Repub.
18
OLS
0.77
1.0 (6.05)a
0.4 (1.69)
Ecuador
23
AR1
0.85
1.3 (6.62)a
1.3 (4.26)a
El Salvador
21
OLS
0.85
2.0 (7.27)a
2.2 (3.16)a
Guatemala
21
AR1
0.82
0.6 (6.51)a
0.3 (0.78)
Honduras
22
OLS
0.63
1.0 (3.20)a
1.3 (0.96)
India
23
OLS
0.97
0.5 (13.54)a
1.2 (6.49)a
-0.1 (-2.27)b
Mexico
23
OLS
0.94
0.9 (8.49)a
-0.3 (-1.23)
0.6 (1.69)
b
a
2
Price Elasticity**
Exchange Rate Elasticity
Model Used*
0.6 (2.52)
Production Elasticity
Lagged Dependent Variable Elasticity
-0.3 (-4.16)a
Brazil
21
AR1
0.75
1.73 (3.47)
Ethiopia
16
OLS
0.52
0.3 (1.15)
1.3 (1.56)
Indonesia
18
OLS
0.85
0.9 (5.92)a
0.2 (0.42)
Cameroon
23
OLS
0.92
0.2 (5.21)a
0.1 (1.35)
0.6 (5.21)a
Co^te d'Ivoire
23
OLS
0.85
0.1 (1.90)c
0.3 (3.31)a
0.6 (2.50)b
Madagascar
21
OLS
0.91
-0.0 (-0.19)
0.2 (0.64)
0.7 (3.94)a
Zaire
21
AR1
0.56
0.8 (3.34)a
0.3 (1.65)c
Burundi
23
AR1
0.98
0.5 (19.88)a
1.0 (11.32)a
0.4 (12.75)a
Rwanda 23 AR1 0.87 0.7 (9.05)a 1.3 (6.94)a * Models used are ordinary least squares (OLS) and first order autocorrelation (AR1). ** t statistics are in parentheses. The superscript letters indicate the level of significance: a=1%, b=5%, c=10%.
37 Table 4. Tests for structural change and simulated producer prices without ICA quotas.
Country
General test for structural change
Test statistic for differences between quota regimes
1966-88
Producer price change from ICA quotas **
1960/70s
1980s
1981-86
Test Stat.
Value*
Test Stat.
Value
Value
Percent
Colombia
F(4,15)
0.34
F(2,15)
0.10
0.63
-9
Kenya
F(4,15)
7.82a
F(2,15)
11.66 a
5.92 b
-12
Tanzania
F(4,16)
11.95 a
F(2,16)
1.79
9.89 a
-3
χ2(4)
15.68 a
χ2(2)
0.13
15.58 a
-14
N /A
F(2,13)
N/A
0.32
-8
χ2(4)
9.81b
χ2(2)
6.85 b
3.65
-13
El Salvador
F(4,14)
0.91
F(2,14)
0.99
1.48
125
Guatemala
χ2(4)
3.46
χ2(2)
3.25
0.82
-4
Honduras
F(4,14)
0.14
F(2,14)
0.01
0.2
-24
India
F(4,15)
11.67 a
F(2,15)
4.25 b
21.13 a
-22
Mexico
F(4,15)
1.49
F(2,15)
0.74
2.09
-10
Mexico§
χ2(2)
5.15 c
χ2(1)
0.40
-1.99
-11
Brazil
χ2(4)
10.15 b
χ2(2)
1.07
9.05 b
-47
Ethiopia
F(4,9)
0.39
F(2,9)
0.54
0.67
-45
Indonesia
F(4,11)
0.74
F(2,11)
0.79
1.17
-22
Cameroon
F(4,14)
5.30 b
F(2,14)
8.29 a
0.12
0
Co^te d'Ivoire
F(4,14)
0.70
F(2,14)
0.29
1.36
-8
Madagascar
F(4,12)
2.55
F(2,12)
1.32
2.61
-21
Zaire
χ2(4)
2.77
χ2(2)
1.46
2.22
11
Burundi
χ2(4)
79.66 a
χ2(2)
3.06
77.74 a
19
Rwanda
χ2(4)
38.56 a
χ2(2)
25.53 a
20.60 a
3
Costa Rica Dom. Repub. Ecuador
* The superscript letters indicate the level of significance: a=1%, b=5%, c=10%. **Free trade price estimates from Akiyama and Varangis. See text for details. Insufficient data available for 1960/70s quotas to estimate coefficients for dummy variables (D1). § Results of test for structural change in intercept only. Not significant for other countries.