APPENDIX
A3
Demand QUESTIONS 1.
Why would a life-saving cardiac drug cost less than one which only provided temporary symptomatic relief?
2.
What is the difference between Mr. Axel's demand for physical therapy and his need for physical therapy?
3.
Do buyers and sellers face the same demand curve?
4.
Is price the only thing that matters?
5.
Can better quality actually decrease demand?
6.
Does a substitute raise or lower the demand for surgery? Does a complement?
7.
Which is more sensitive to price changes; one person, one firm, or the whole market?
8.
How can one compare the price sensitivity of a small city like Camden with all of California?
9.
Do politicians face demand curves?
10. Is medical care a necessity, or a luxury upon which the rich spend much more?
A3.1 DEMAND VERSUS NEED Economists and medical professionals approach the analysis of medical care utilization in fundamentally different ways. Economists use the concept of demand to ask how the quantity of services utilized varies as price changes, implicitly holding constant and largely ignoring differences in illness and social conditions. Physicians frame the issue as one of need, a technical question regarding the level of service required to adequately treat the illness of a particular patient, thus focusing on differences in health status and ignoring the role of prices and
174 _________________________ HEALTH ECONOMICS: Fundamentals and Flow of Funds incomes in allocating scarce resources. Although sometimes appearing to be diametrically opposed, these are in fact just different perspectives on the complex set of human, financial and scientific exchanges which make up medicine. With care, the two perspectives can complement each other so as to provide a fuller understanding of how the system works as a whole, and on different levels corresponding to the individual person, hospital, company or community. Economics is about exchange between people and the trade-offs that they make. Showing how individual choices lead toward a group optimum, and how that optimum will change as conditions change, is a central task. Consumers are assumed to be in the best position to know what they want, and hence decide for themselves what to buy and how much they are willing to pay for it. On the supply side, producers’ desire for profit leads them to provide what clients want, and to strive for improvements in efficiency that reduce costs. In most economic models, all concerns are expressed in terms of money. Prices, costs, taxes, bids, contracts and so on are the language used to communicate human desires and limitations. Economists tend to abstract from other elements so that many types of policy issues can all be framed in standard dollar terms. In medicine, doctors make the decisions about which services get allocated to which patients. The primary criteria are what the patient “needs” as determined by illness and treatment possibilities given the current state of the art in medicine. Physicians try to remove themselves from thinking about who pays (employer, patient, taxpayer) and who gets paid (themselves, hospitals) so as to focus on patient needs without the distraction of economic concerns. Their task is to operate within a given system to allocate resources, and to advocate for patients. There is even a certain purposeful forgetting of economic issues because physicians are supposed to act in the patient's best interest. Therefore physicians try to act as if prices were set anonymously by somebody else, as if the bills got paid to some agency unrelated to their personal incomes, and as if insurance payments were really paid by some insurance company rather than taken out of wages. For decisions regarding individual cases, a need-based medical perspective is suitable, and the economic insistence upon prices and tradeoffs may seem clumsy and inappropriate. That is because physicians operate within the health care system as it currently stands to do the best for their patients, not to change the system to save money or help people they have never met. We do not ask doctors to figure out what is best for taxpayers or employers or insurance companies, yet someone must address those larger questions. Economists have to think about the choice between systems, how choosing one set of insurance regulations means that more children will get immunized, but fewer elderly will receive home care, while another plan might protect the savings accident victims, or provide more incentives to work. The tradeoffs between medical care and other goods, between different groups of patients, and different types of care, are the issues which health economics is designed to address. While the “demand for medical care” is a concept which is awkward when applied to a specific individual, who either is or is not sick, it is a tool that works well when considering groups of people or society as a whole where there is always a range of illnesses and a range of treatments available so that the necessity for choices and balancing at the margin is obvious.
Appendix 3: Demand ________________________________________________________ 175
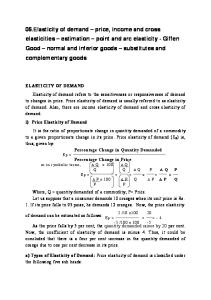
A3.2 THE DEMAND CURVE “Demand” is a relationship between price and quantity. It is not a number, or any specific amount.8 The demand curve is drawn sloping downward to expresses the economist's insistence that the quantity demanded will always fall as prices rise (assuming all other conditions remain constant), a generalization known as the First Law of Demand. As an example, consider the development of an artificial heart. If each heart cost $1 million, then they would only be used where it was a matter of life and death. If further development reduced the cost of artificial hearts to $100,000 Price each, then more people would get At a higher price, them. They would still be used only fewer patients will $1,000,000 for serious illnesses, but might be receive artificial implanted long before the person's hearts natural heart gave out. Now suppose that the cost of making an artificial heart dropped to only $100. They would be readily available to anyone who needed one. Then consider what would happen if the cost of $0 Quantity mechanical hearts got down to $10, and they could be slipped in easily Figure A3.2.a: Demand curve for artificial during a painless 15 minute visit to hearts the doctor's office. Some people who had never been ill but who were just worried, or thought that they were weak and wanted a supercharger to help them run faster, might have new hearts put in. The demand curve is a marginal benefit curve. At a price of $1 million, only people who benefit by more than $1 million will get one. At a price of $100,000, then additional people whose benefits ranges between $1 million and $100,000 will get one. If the price is reduced to $50,000, then a few more people whose marginal benefit falls between $100,000 and $50,000 will be willing to pay for the operation, and so on. Note well what the demand curve implies: that there is no such thing as “the” value of an artificial heart. Its value depends upon its scarcity, upon how many are already in use. If only a few hearts are being sold, then their value will be fantastically high, millions and millions of dollars each. Once there are many hearts being sold, then the marginal value of a few more will be quite low. The Diamonds-Water Paradox: An example of marginal analysis
Ordinary economic goods show the same functional relationship between marginal benefit and quantity; extremely valuable when only a few units are available, of moderate value to a larger number of people, of less and less value as more and more people receive them, and eventually becoming almost worthless or perhaps even harmful if overused. The founder of modern economics, Adam Smith, was intrigued by the following problem: If water, which is 8
Whenever an economist says “demand,” the word “curve” is implicitly attached. A specific number is just one point on the curve, and hence properly known as the quantity demanded. If a Wall Street Journal reporter should state that the demand for CAT scanners has risen to 50,000 machines, the punctilious economist would jump in to correct them to say that the quantity demanded has reached 50,000.
176 _________________________ HEALTH ECONOMICS: Fundamentals and Flow of Funds necessary for life itself, is so valuable, why does it cost so little, and why do diamonds, which are useful only as “frivolous” ornaments, cost so much? Although Smith was a brilliant economist, he was never able to solve this problem. With the benefit of price theory, the answer is easily explained by making the distinction between marginal benefits and total benefits. The value of the first ounce of water is very high because it can save the life of a thirsty person. The second ounce is worth less, the third still less, and so on. Since water is so plentiful there are literally millions of gallons available and few people have to pay more than a few cents to get a glass of water. The total benefit, the value indicated by the area under the entire demand curve, is very large. The marginal benefit, the value of one more glassful, it very small. For diamonds, the situation is Price very different in that although the area under the total demand curve is not too large (I can live very well with no Water: large quantity; total diamonds at all), diamonds are so scarce benefit high but that the incremental benefit from marginal benefit obtaining one more are still substantial. low, so price is low This is shown graphically in Figure A3.2.b. The decision to purchase is a Diamonds: decision made at the margin, whether the small quantity; total benefit low subject is water or diamonds, or surgery. but marginal How much is it worth paying for one benefit high, so more? price is high It is useful to keep the diamondsQuantity water paradox in mind when analyzing Figure A3.2.b: The Water-Diamonds Paradox health policy. Although modern medical Using Demand Curves care is extremely valuable in total, much of the work doctors and hospitals do is of very little use because it is at the extensive margin. Treatments that are incredibly beneficial to a few selected patients get supplied to so many people that the system is moved farther and farther down the marginal benefit curve, and eventually the bulk of the work is being done on conditions for which doctors can do little good. Efficiency in medical care is not just a matter of technical excellence and minimizing the cost of production. More often, efficiency depends upon how much is produced and which patients get treated. Some of the nation's problems with the high cost of medical care come from using diamonds when a bandaid around the finger would do as well. What are the units of a Demand Curve?
The vertical or “price” axis of a demand curve diagram is more precisely “price per unit.” For each price, there is one unique “quantity demanded” associated with it. Since a patient's demand for therapy would change if their insurance, or income, or the amount of pain involved were to change, all of these factors must implicitly be held constant. Only one variable can be represented on each axis. Movement along the vertical axis implies a change in money price alone, nothing else. The monetary units must be the same all along the curve—“100” cannot be dollars, while “110” is yen and “120” is marks. Also, those dollars must all be the same, “100” cannot be 1990 dollars while “115” is 1996 dollars (which are not worth as much). It does not
Appendix 3: Demand ________________________________________________________ 177
matter too much exactly how price is measured, so long as that measurement is consistent for all points along the demand curve. Prices arise from transactions. Dollars are exchanged for goods, and the “units” are those specified between the two transacting parties; 250 tablets of aspirin at $3.49 per bottle, 5 days in the hospital at $760 per day, and so on. Unless there is some agreement on what constitutes “one unit” (e.g., per ounce, per liter, per gallon), then there can be no agreement on price. Just as the price must be the same moving along the vertical axis, quantity units must be the same moving along the horizontal axes. If “10” is hospital days including meals, medication and physical therapy, the “14” must also include these ancillary services. For the increase in quantity to be meaningful, quality must be held constant. This is often problematic in medical care since increases in demand are often for a higher quality rather than a larger number of units (e.g., I am willing to pay more for a better surgeon, not 3 operations). Insurance complicates the price/quantity relationship since services are not paid for directly, and hence no units are specified. HMOs and government programs provide all sorts of services with no pricing at all. Although the concept of demand is still useful in these situations, there are no true price or quantity units unless a transaction actually takes place—when you buy an aspirin, or pay to visit a chiropractor, for example. A demand curve is a consumption relationship, and consumption takes time. The quantity demanded depends upon the length of the period being considered: How many aspirin did you take yesterday? Last week? Last year? Last five years? During your lifetime? A particular time frame is always implied, even though it is rarely shown when labeling a demand curve. Often, it is quantity demanded per year. For medical care, it may also be per illness episode. Even when quantity appears to be a stock (a fixed amount at some point in time), it is actually a flow of consumption over time. Individual, Market and Seller's (Firm) Demand Curves
Demand is implicitly specified not only in time, but in extent (space or persons). The quantity of physician services demanded by two people is greater than the quantity demanded by either one alone. The quantity demanded in all of New York City is greater than the quantity demanded in a single borough, Manhattan. All of the individual demand curves must be summed horizontally to obtain the market demand curve. For a market consisting of Ann, Bob and Carl, the three demand curves are added together as shown in Figure A3.2.c. It is important to distinguish the demand curve facing a firm selling to the market from the demand curve for the market as a whole. If just one firm reduces prices by 10%, its increase in quantity sold will be greater than for the market as a whole because it will be taking customers away from other firms as well as attracting new sales to the market. A single firm has only a fractional share of the total market, but its seller's demand curve (also known as “firm demand”) is more sensitive to price changes than is total market demand. Demand curves and their partner supply curves are the conceptual tools most often utilized by economists. They are powerful, applicable to many situations, easy to use and to understand. Fully specified, a demand curve is a relationship between quantity demanded and price per unit i) of a particular person, firm or market ii) during a particular period, iii) with all characteristics of each unit (especially quality) held constant, and iv) with all other relevant factors held constant, a set of specifications usually referred to as ceteris paribus.
178 _________________________ HEALTH ECONOMICS: Fundamentals and Flow of Funds
$20
$20
Bob
Ann
$15
$15
$10
$10
$5
$5
$0 0
1
2
3
4
5
6
7
8
9
10
$20
$0 0
1
2
$20
Carl
$15
$10
$5
$5
$0 0
1
2
3
4
5
6
7
8
9
10
4
5
6
7
8
9
10
Market demand: add individual demand horizontally
$15
$10
3
$0 0
2
4
6
8
10 12 14 16 18 20
Figure A3.2.c: Market Demand is the Horizontal Sum of Individual Demand
3.3 CETERIS PARIBUS The Latin phrase “ceteris paribus” means “all other things the same.” To analyze the effect of a change in price upon quantity demanded, other factors which could change demand such as personal income, tastes, the weather, etc., must be held constant. Such factors, usually known as demand shifters, are in turn to become the subject of analysis, but at this stage it is necessary to make a clear distinction so that the effects of price, and price alone, can be examined. Prices of Substitutes and Complements. Any purchase is a choice among competing alternatives. Thus any change in the attractiveness of those alternatives will cause a change in demand (Figure A3.3.a). A person with back pain who contemplates going to a chiropractor will be influenced by whether or not his medical insurance would cover substitutes such as physical therapy or prescription drugs. A person considering whether or not to get fitted for a kidney dialysis shunt would be influenced by the price of a kidney transplant. Opposite effects are observed for changes in the price of complements, things that are used with a good. If a person desiring surgery is told that his insurance will not cover the rehabilitation services, then that will make him less likely to chose surgery. Someone thinking about bringing their ailing mother home from the hospital will be less likely to do so if they discover that the price of home health
Appendix 3: Demand ________________________________________________________ 179
aides is greater than they thought. Home health aids are a complement for home care, and a substitute for hospital care. Demand will rise(fall) if the price of a substitute(complement) rises. P
Psubstitute rises
P
P
Psubstitute falls
Q Price of a Substitute Changes
Q
P
Pcomplement rises
Pcomplement falls
Q
Q
Price of a Complement Changes
Figure A3.3.a: Demand Curve Shifts in Response to Change in Price of a Related Good Income. For normal goods, increasing income raises demand. On average, demand for all goods rises proportionately with income, so that a 10% increase in income leads to a 10% increase in average demand. Goods whose demand rises more than P P proportionately as income rises are called “luxuries” by economists. Fine clothes and European travel are commonly recognized luxury goods, but spending on education and medical care also rise rapidly with income. From a societal point of view, there is Q Q Normal Good Inferior Good little doubt that education and health care are “luxuries,” albeit very necessary ones. Goods for which the Figure A3.3.b: Demand Curve Shifts due to Increase in Income demand actually falls as income rises (department store eyeglasses, cheap dentures) are known as inferior goods P P (Figure A3.3.b). Expectations. Sometimes a price will rise, and people rush out to buy more, even though according to the first law of demand, they should be buying less. This seeming contradiction occurs because they Q Q Price expected to rise Price expected to fall expect prices to continue rising, so that they would have to pay even more tomorrow, and so are better off Figure A3.3.c: Demand Curve Shifts due to Change in Expectations stocking up today. It is not the current rise in price, but the expectation of future price increases, which has changed the quantity demanded (Figure A3.3.c). Only if expectations are constant will the demand curve stay the same. In a recession, fewer families
180 _________________________ HEALTH ECONOMICS: Fundamentals and Flow of Funds will celebrate a son or daughter's graduation by buying a new car, and they are right to do so. Another example of expectations is provided by the purchasing behavior of college students. Although most college students think of themselves as poor, in fact they will earn more on average over their lifetimes than non-college graduates. Their consumption of dentistry, preventive medicine and other long term investments in health is in line with the purchases of the higher income people they expect to be, rather than the impoverished people their current income suggests. Population. The larger the number of people in the market, the larger the quantity P demanded. The demand curve pivots outward, but the maximum price that people are willing to pay, and hence the point of intersection with the y-axis, does not change (Figure A3.3.d). To see why, consider what happens if the market doubles in size. At a price of 0 (intersection with the x-axis), quantity demanded will be twice as much as before. Q At some intermediate price “Pmiddle", doubling the Figure A3.3.d: Demand Curve population will double quantity demanded. The Shifts due to Population Increase numerical increase will be less, however, since a smaller quantity is being doubled at Pmiddle than at P=0. Now consider Pmax. At this high price, or above, no one will buy. Even if the population is doubled, or tripled, or quadrupled, there is still no one buying. Thus the point of intersection with the Y-axis, Pmax does not change as population changes. Since the top point is fixed, an increase in population makes the demand curve rotate outward. Quality. A demand curve P P traces out the relationship between price and quantity for any specific good. If the quality of the good OR? changes, then there will be a new demand curve. For many cases, an increase in quality will cause an upward shift all along the demand Q Q curve, as in Figure A3.3.e. For example, regular aspirin could be Figure A3.3.e: Demand Curve Shift due to Increase replaced with buffered aspirin in Quality (which is less likely to upset your stomach) and there would be an upward shift in quantity demanded at all prices. However, while higher quality always means that the maximum price a consumer would pay for a good unambiguously increases, the amount of the good that people will actually consume at a lower price may rise or fall. If “higher quality” means “more efficient” then consumers could actually use less. Consider the example of replacing aspirin (250 mg per tablet) with aspirin++ (500 mg per tablet). The prescription “take two aspirin” becomes “take one aspirin++.” If consumers were willing to pay a maximum of $3 for a bottle of 100 old capsules, they will now be willing to pay about $6 per bottle for the new capsules (or just a little less). However, at a low or 0 price, people will use less aspirin++ than regular aspirin because each tablet contains twice as
Appendix 3: Demand ________________________________________________________ 181
much active ingredients. Therefore the demand curve will be higher at high prices, but lower at low prices; it will rotate around the middle as in right panel of Figure A3.3.e. Other examples where increased quality may cause consumption to rise or fall depending upon price level are better artificial joints (which last longer), better heart surgery, better psychiatrists, better diagnostic tests, and so on. Technology. As technology changes, the demand for different goods and services will change as they become more or less useful (Figure A3.3.f). With the development of modems and fax machines, cars became just a little bit less necessary, but the demand for phone lines rose. The discovery that regular doses of Vitamin E can possibly prevent the development of heart disease caused a substantial increase in demand. In terms from Appendix 2, a change in the production function changes the demand for all the inputs. P
P
OR?
Q
P
OR?
Q
Q
Figure A.3.3.f: Demand Curve Shifts due to Changes in Tastes, Technology Tastes. All of the other factors which can possibly effect demand are usually lumped together by economists into the broad category “changes in tastes.” It covers elements that marketers and fashion experts would consider “tastes,” but as the everything else category, also takes in weather, ethnicity, reactions to an ecological disaster, aging, disability and many other things that most people would not usually refer to as tastes. The reason is that economists wish to leave the study of these remaining demand shifters to psychologists and sociologists and market researchers, confining their work to factors such as income, prices of substitutes, population and technology, which economic models are well suited to analyzing. However for health economists, illness or “health status” is such an important predisposing factor in the demand for medical care that it cannot be just lumped into the catch-all category “tastes & other.” Health Status. Except for a small amount of preventive services, people only buy medical care when they are sick. People buy food when they are not hungry, boats when it is the middle of winter, and books that they will never read. They do not buy medical care this way. Demand is episodic and highly uncertain. Only those with heart valve and artery damage get coronary bypass surgery, and only those who are HIV positive take AZT. Yet while differences in health status determine who gets cared for, they do not determine how much total care is available. In Bangladesh where thousands of children die each month there is very little medical care provided—not because the people do not need it, but because the country is so poor. Total market demand for medical care is more influenced by income and the other economic demand shifters, while individual demand is determined predominantly by individual illness. Many of
182 _________________________ HEALTH ECONOMICS: Fundamentals and Flow of Funds the issues which arise from the dependence of health services on random and systematic variations in health status will be dealt with at length in Chapters 4 and 7, but it is not possible even to begin any realistic analysis without recognizing the uneven impact of illness on the choices made by people and organizations.
3.4 ELASTICITY The distinctive feature of the economic approach to demand is that it focuses on change—how quantity demanded changes as price changes. The concept of elasticity has been borrowed from engineering to measure how much one variable will change when change in another variable forces it do so. Price elasticity measures how large a percentage change in quantity demanded will occur for a 1% change in price. Think of elasticity using the analogy of a rubber band. If it is very elastic, it will stretch a lot when pressure is applied. If it is stiff and “inelastic,” it will not stretch very much. More formally price elasticity is defined in the formula below. Price Elasticity ∈ =
% change in Q ∆Q Q %∆Q = = % change in P ∆P P %∆P
In this book, the symbol “∈” will be used to denote elasticity.9 To obtain the percentage change in Q, first measure the change in Q, ∆Q = Q2 - Q1 (the symbol “∆” stands for “the change in"), and then divide by Q. To get ∆P, we must similarly subtract, P2 - P1. What “P” should be used as a divisor to calculate percentage change, the starting price or the ending price, or something in the middle? Mathematically, elasticity is defined using calculus for infinitesimally small changes, so that it does not make a difference if P1 or P2 is used as the divisor since they are so close together. In practice, we do not observe continuous infinitesimal changes (i.e. from $8 to $8.000001), but discrete changes, say from $7 to $9, for which it does make a difference, since dividing by $9 yields a smaller percentage change than dividing by $7. Therefore economists often use the average price (P1+P2)/2, which provides an estimate known as the “arc elasticity.” ∆Q ( change in Q ) ÷ ( average Q ) ( Q1 + Q2 ) 2 Price Elasticity (arc approximation) = = ∆P ( change in P ) ÷ ( average P ) ( P1 + P2 ) 2
For practice, calculate the price elasticity of demand for aspirin along one section of a demand curve where quantity demanded changes from 30 to 20 as price changes from $7 to $9. The change Q is 20 - 30 = -10 which is -40%, while the change in P is $9 - $7 = 2 or 25%. Since the percentage change in Q is greater than the percentage change in P, this part of this demand curve is said to be elastic. Calculation of arc Price Elasticity: 9
In other books, some other Greek letter or symbol such as η or Σ may be used for elasticity.
Appendix 3: Demand ________________________________________________________ 183 ∆Q ( Q1 + Q2 ) 2 − 10 25 − 40% ∈ = = = = −1.6 ∆P 25% $2 $8 ( P1 + P2 ) 2
(elastic)
Elasticity is Dimensionless. Now consider a different good, such as heart surgery, which has very inelastic demand. The price increases from $70,000 to $90,000, and the quantity demanded in the Allentown falls from 332 to 314 per year, which is a larger number, but a much smaller percentage change.
Calculation of Arc Price Elasticity (Second Example): ∆Q ( Q1 + Q2 ) 2 − 18 323 − 5.2% ∈= = = = −0.26 ∆P $20,000 $80,000 25% ( P1 + P2 ) 2
(inelastic)
Several points to note are that the %∆P is the same in the first and second examples, 25%, even though ∆P is $2 in the first and $20,000 in the second. Percentages are dimensionless numbers. That is, they do not depend upon the units of measurement, whether it be dollars or cents or hundred dollar bills or Yen or Rubles or Francs; a 10% price increase is always a 10% price increase. Since elasticities are the ratio of two dimensionless numbers, they are also dimensionless. Therefore it does not make any difference what units are used to measure price and quantity, so long as the base units are consistent between both the starting and ending points. Not having to worry about what the units are and thinking only in percentages is a very convenient property. Elasticity Does not Depend Upon How Large the Market Is. Suppose we want to compare the demand for heart surgery in Allentown and Bethlehem, and the only real difference is that there are four times as many people in Bethlehem. That is, the patients in Bethlehem are, on average, no more or less responsive to P price changes than people in Allentown. We want a measure of price responsiveness that Elasticity is -0.26 at both points will tell us that demand conditions are, except for size, about the same in these two markets. Just looking at the demand curve can be misleading since it is measured in actual units and indicates that demand is four • • times as great in Bethlehem. Using the numbers from the second example above, we Q would expect to start with about 4×332 or Figure A3.4.a: Elasticity Does Not 1,328 heart surgeries in Bethlehem. Depend on the Size of the Market However, as prices change we would expect
184 _________________________ HEALTH ECONOMICS: Fundamentals and Flow of Funds a decline of about 4×18 or 72 which is the same percentage (5.2%) as before, and hence the elasticity is the same, - 0.26 (Figure A3.4.a). This makes sense because we said that people in the two towns have about the same tastes and preferences and external conditions, it is just that there are more of them in Bethlehem. In general, whenever the demand curve rotates (as it will ceteris paribus when population increases or decreases), the elasticity will remain the same for any specific price change. However, suppose a trip to Camden reveals that the estimated elasticity there is -.71, (still inelastic, but much more elastic than in Allentown). What makes people more or less sensitive to pricing? Primarily, the number of good alternatives that they have. For example, Camden may be much more price sensitive than Bethlehem because it has many major hospitals in a neighboring metropolitan area nearby. Elasticity Depends Upon how Broad the Definition of the Good Is. If a good is defined broadly as, for example, “cardiac care,” then someone who has just had a heart attack will have very few substitutes and demand will be relatively inelastic. If a good is defined narrowly, “cardiac beta blocker II drugs” for example, then there will be many substitutes (surgery, other drugs) and demand will be more elastic. If there are many close substitutes so that people can easily switch brands (e.g. comparing Bayer aspirin to Caldwell aspirin, or Jensen ambulance service with Kirkwood ambulance service), any increase in the price of one brand will cause a large drop in quantity demanded. On the other hand, if there is only one brand, or only one hospital in a town, then there is not very much one can do when prices rise. Elasticity Depends Upon the Share of the Good in a Consumer's Budget. Consumers are not very sensitive to a 10% change in the price of bandaids, which at 2 or 3 $2 boxes per year make up a only a very small fraction of their total yearly budget. A 10% change in the price of dentistry, on which the average American spends $185 per year, is more noticeable, and therefore consumers are more price sensitive for dentistry than bandaids. In general, the smaller the share of consumer expenditure accounted for by an item, ceteris paribus, the less elastic the demand for that item. Firm versus Market Elasticity. In a market with many competing firms, if any single firm alone raises its prices, then many of their customers will go to the other firms. However, if all firms in a market raise prices (due for example to a rise in taxes, or energy costs or prevailing wage rates), then customers cannot escape by switching providers and must accept higher prices overall. If there is only one firm in the market (a “monopoly”), then firm demand and market demand are identical. In all other cases, firm demand will be more elastic than market demand (Figure A3.4.b).
P
Firm Market
Q Figure A3.4.b: Firm Demand Curve is Much More Elastic than the Market
Appendix 3: Demand ________________________________________________________ 185 Table A3.4.a: Firm v. Market Demand
Eastside Hospital alone raises prices by 10% All Hospitals raise prices by 10%
Firm Quantity Demanded -40%
Market Quantity Demanded -2%
(patients switch)
(little overall change)
-5%
-5%
(no switching)
(all hospitals’ shares decline)
Product Differentiation. A lot of medical care is perceived to be inelastic not because there are no alternatives, but because they are not good alternatives — I want to go to my own doctor, not some newcomer I have never heard of, or to the lowest bidder on a citywide contract. Such a fragmentation of the marketplace is known as product differentiation and is actively encouraged by medical providers, and in fact by most businesses, with each one claiming to be special, uniquely qualified, and the best for you so that you should not even consider going somewhere else just to get a lower price. Splitting the market into segments reduces elasticity. If product differentiation were total, then each firm would be its own market, with its own captive set of consumers (“We would never think of anyplace but Episcopal Hospital to have a baby”). Good information about the value of different providers tends to make them better substitutes, and well informed patients will usually be much more price elastic. Purchasing cooperatives (such as insurance companies, health maintenance organizations, preferred provider organization and even large firms who must provide health benefits for many employees) can afford to shop for the best value in the health care marketplace, and force providers to compete on the basis of prices rather than claims of superiority. Time for Adjustment. The second most important determinant of elasticity, after the number of good substitutes, is the amount of time allowed to make those substitutions. If you drive 15 minutes to a new pharmacy, only to find that your prescription cost $20 more than it did at a different pharmacy on the other side of town last year, you will probably go ahead an purchase it anyway. When faced with a new and higher price, you don't know if prices have gone up just at this pharmacy, or everywhere. P Over time you will try other pharmacies, maybe make a few phone calls, and so on. The longer the time you have, the more you will adjust to the price change by finding an Long run alternative firm or reducing consumption. This principle is sufficiently important that economists call it the Second Law of Demand: Short run There will be more change in quantity Q demanded the longer the time allowed for Figure A3.4.c: The Longer the Time to adjustment, thus the short run elasticity will Adjust, the Greater the Elasticity always be less than long run elasticity (Figure
186 _________________________ HEALTH ECONOMICS: Fundamentals and Flow of Funds A3.4.c). Income Elasticity. Responsiveness of quantity demanded to other factors, such as income, can also be measured.
Income Elasticity: ∈income =
% change in Q %∆Q = % change in I % ∆I
Suppose that John were making $25,000 per year in his old job and spent about $160 on dental work, but in his new job which pays $35,000, his dental spending increases to $270. His income increased by 33% and his spending increased by 51%, so his income elasticity for dental services is 1.53. Calculation of Income Elasticity ∆Q ( Q1 + Q2 ) 2 $110 $215 51% ∈income = . = = = 153 ∆I $10,000 $30,000 33% ( I1 + I 2 ) 2
(luxury good)
In using these numbers to estimate income elasticity, we implicitly assumed that nothing else had changed. If the new job has better or worse dental coverage, requires a longer drive to get to a dentist, or involves eating a lot of candy, such a ceteris paribus assumption is not justified. In general, we must find cases where conditions are reasonably the same (or use multivariate statistical techniques), or it is not possible to measure the effect of a single variable like income upon quantity demanded. In particular, we assumed that dental prices were unchanged so that the change in the amount of money spent on dentistry could serve as a measure of a change in the quantity of services consumed. This provides a shortcut for determining that dentistry was a luxury good: the share of total spending devoted to dentistry rose from 0.64% ($160 of $25,000) to 0.77% ($270 of $35,000) as income rose. If spending had risen proportionately with income, by exactly 33%, it would be unit elastic (∈ = 1.0). On average, goods have a unit elasticity. This makes sense; a 10% rise in income will, on average, lead to a 10% rise in spending.10 Something for which spending actually declined as income rose, maybe tranquilizers (replaced by a good psychotherapist), would have a negative income elasticity and be called an inferior good. Since changes in quantity of complex service mixes are difficult to obtain and hard to understand (does an increase in dental spending imply more or less fillings, extractions, cleanings, bridges, periodontal therapy?), it is changes in the total spending shares which are usually used to measure, and interpret, income elasticities.
10
More precisely, the average income elasticity of all goods, weighted by the share of total income spent on each good (including savings and government expenditures through taxes) must mathematically always equal exactly 1.0—to have 10% more is to spend 10% more.
Appendix 3: Demand ________________________________________________________ 187 Table A3.4.b: Classification of Income Elasticities
If Income increases by 1%, then: Inferior Goods Normal Goods Unit Elastic Luxury Goods
Spending down up 1%
Budget Share down a lot down same up
Examples reading glasses, used equipment hospital, ER average of all goods dentistry, psychiatry
Cross-Price Elasticity. The responsiveness of quantity demanded to changes in the price of other goods is measured by “cross-price elasticity.” It is defined as:
Cross-Price Elasticity: ∈cross =
% change in Q goodA % change in PgoodB
=
∆Q A Q A % ∆Q A = ∆PB PB %∆PB
For instance, if a 20% rise in the price of nursing homes led to a 5% increase in the number of days patients spend in hospitals, the cross-price elasticity would be: ∈cross =
%∆Qhospital days %∆Pnursing home
=
5% = +0.25 20%
(substitutes have positive ∈cross)
Demand for hospital days rises when the price of nursing homes increases because the two are substitutes. Economists define goods as substitutes and complements depending upon whether the cross-price elasticity is positive or negative. Visiting nurse services are a complement to home IV (intravenous fluid) therapy. If the price of visiting nurses goes from $27/hour to $33/hour (a 10% increase), the amount spent on home IV services might decline by 8% ∈cross =
%∆Qhome IV − 8% = = −0.80 %∆Pvisiting nurse 10%
(complements have negative ∈cross)
Only a few goods and services are strong substitutes or complements. The price of podiatry (foot care) will do little to the demand for eyeglasses. The cross-price elasticity for such neutral goods is essentially zero.11 A market is defined by the strength of the cross-price elasticities. Two goods or two firms are said to be in the same market only to the extent that their cross-price 11
The cross-price elasticities would actually have to be very slightly negative on average since an increase in any one price ceteris paribus means that you can no longer buy exactly the same amount of all the same goods as before and hence your real income is slightly reduced.
188 _________________________ HEALTH ECONOMICS: Fundamentals and Flow of Funds elasticity is significantly greater than 0. Psychiatric Hospitals in Boston do not have a strong cross-price elasticity of demand with the services of psychiatric hospitals of Utah, nor with sports medicine clinics even in Boston. Thus these are separate markets.
3.5 IS PRICE THE ONLY THING THAT MATTERS? What does it mean to pay for something? To a politician, it may mean losing some votes or giving up some other pet project. To a student going partying on Saturday night, it may mean a headache and a lower grade on Monday's exam. To someone who wants a new driver's license, it may mean hours of anxiety and grief. In each case, something has to be given up to get something else. Economists often use the term “price” indiscriminately to refer to all of the things one has to give up to get some desirable good in trade. For medical care, it is common to talk about time, pain and risk of death as part of the price of treatment. The time price is quite simply a recognition that the time spent traveling to and from the hospital, in treatment, and confined to bed in recovery, has a opportunity cost (see discussion in Appendix Chapter 1). At the margin, the cost of time is roughly equivalent to the time price, and so a net price of time + money can be calculated. Pain is far more difficult to value since there is no objective measure of the amount of sacrifice. A monk and a businessman can go through identical operations, and one have much more pain than the other. Furthermore, even if the pain is in some technical sense the same, they may value it quite differently. Some people can live and function well in pain that would make others miserable and crippled. For thoracic surgery, chemotherapy and other hazardous therapies, the risk of death due to the procedure may be the most important cost associated with treatment. The allocation of services to patients can be accomplished through time, pain and risk just as it can through money. In Canada, where patients do not pay directly for most doctor's services, waiting times have increased. By discouraging those who are not willing to spend time waiting for care, the number of patients treated is limited just as effectively as it is when price is used to discourage those who are not willing to pay money for care. An example of allocation by “pain” is provided by pain clinics that insist on screening patients with an uncomfortable diagnostic procedure known as an electromyelogram—those patients who are not willing to undergo a EMG are presumably not suffering enough to obtain clinic services. A fundamental difference between a money price and a “time price” or a “pain price” is that the money price is paid to the other party in the transaction. If the surgery costs $1,800, then the surgeon receives $1,800. If a patient has to wait six extra hours in the waiting room, no one receives those six hours. If an EMG is painful, a patient's willingness to undergo it may convince the therapist that the patient needs services, but that pain does not yield pleasure to the therapist. The patient's time and pain is a personal cost to them which does not directly benefit the provider. Therefore economists tend to favor money prices as a rationing mechanism because it entails fewer of such “deadweight” costs. Families, Politics, Professional Ethics and Other Forms of Rationing. Prior to the development of markets, the family or tribe was the primary means of allocating both work and goods. The years and years of experience handed down orally through generations served to weed out inefficient practices, so that “traditional” and “economic” decisions tend to converge
Appendix 3: Demand ________________________________________________________ 189 over time. Traditions, however, are much slower to change, and must rely on respect for elders or religion rather than direct appeals to self-interest for motivation. Physicians are often asked to take a “paternal” role with respect to patients—to make decisions for them as if they were a loving parent. The ability to “care” in this way may be the most important part of doctoring in a critical illness. The crass commercialism of “how much do you want to pay for, and are we going to haggle over discounts and delivery charges?” may be quite inappropriate at such a time. However, just as each family is well aware of what it can afford even when money is never mentioned, physicians operate within a economic environment for which prices always do matter. Politics is most concerned with collective decisions that impact everyone. It creates the structure within which health care operates, and then decisions regarding how to care for a particular person are made at the individual level by family members (via the market) or physicians (via professional traditions). Politicians often act as a kind of market by allowing different interest groups to trade issues of importance to them, as for instance when insurance companies agreed to more stringent regulation in return for exemption from some antitrust laws. The “price” of a piece of legislation to a politician is usually the votes he will give up from taking an correct but unpopular position, or the favors and future support he must promise to some group to enlist their consent. Trades that are purely individual can more efficiently be made in the market, but trades for collective goods such as clean air, educational reform or national defense can only be made through a political structure. While politics is the science and art of public action, much of it is conducted for private self-interest. Under the guise of benefiting the public, organizations often try use the political process to help themselves by eliminating competition, acquiring tax subsidies and enforcing dubious contracts. Decisions made by bureaucracies (Food and Drug Administration, State Health Department, Social Security, Department of Defense, Internal Revenue Service, etc.) and decisions made through the legal system are extensions of political decision making. Most government activity serves to support markets, making them more efficient by setting standards for measures and content, enforcing contracts and building transport and information infrastructure. Since politics is based on negotiation and elections rather than monetary transactions, it tends to lean more toward compromise between groups to provide a single “solution everyone can live with,” whereas markets force substitution between inputs and goods on the basis of willingness to pay, thus creating many different and specialized solutions based on individual and organizational maximization. Politicians may try to circumvent the market system by explicit rationing, setting up rules to allocate on a basis other than price (first come, first served, documentation of need, public hearing). While the laws of supply and demand can be temporarily suspended in a time of crises, or strengthened by careful government intervention in situations involving public goods, in the long run economic reality tends to overwhelm any well-intentioned tinkering (see Chapters 9 and 18 for discussions of price controls for hospitals). Rationing must always take place because goods are scarce. When government “gives” away valuable goods such as TV station licenses, concerts in the park, and airport landing slots, they do not suddenly become free just because no price tag is attached. Buying power based on wealth is supplanted by political power based upon votes. Competition has not disappeared, it had simply changed form. The measure of value is still “willingness to pay.”
190 _________________________ HEALTH ECONOMICS: Fundamentals and Flow of Funds
SUMMARY 1.
The first law of demand is that a rise in prices will ceteris paribus (all other things constant) cause the quantity purchased for consumption to fall. It is a reflection of the most fundamental trade-off which a consumer must make, that having more of one good means having less of something else.
2.
The concept of need, a professional assessment of the quantity of services required without regard to price or other trade-offs, is appropriate for decision-making when price, cost, budget constraint and such monetary factors have already been decided—as for example within a fully insured system.
3.
The demand curve is a marginal benefit curve, tracing out how much each additional unit of service is worth. Much of the total value of health care may lie in only a few units of service targeted to those most in need, with many subsequent services provided to a large number of people for very little additional benefit. Some things which are essential to health (nutrition, exercise, preventive care) are plentiful and trade at a very low price in the market, while some services that make only a marginal contribution but are quite scarce (neurosurgery for someone who is already seriously ill) command a high price.
4.
Prices arise from transactions, the actual exchange of money for service. Since much of health care is funded by government or third party insurance, there is no real price and so careful attention must be paid to use of demand curve analysis which depends upon well defined goods exchanged in markets which depend only on price.
5.
The major demand shifters for most goods are income, prices of substitutes and complements, expectations, population growth and the catch-all term for everything else, “tastes.” In medical care, quality and illness status, personal characteristics that would usually be lumped in with tastes and not analyzed separately, are of most importance.
6.
Elasticities measure the percentage change in one variable (quantity) with respect to the percentage change in another (price). Elasticities have the advantage of being dimensionless, so they do not depend upon the units of measurement or the size of the market. Elasticity is virtually always larger the longer the time allowed for adjustment. The price elasticity facing a single firm, which has many other firms competing for the same customers, much greater than the price elasticity of the market as a whole, or of any individual consumer.
7.
Goods are classified according to their income elasticity as being inferior (less than 0, quantity bought falls as income rises), normal (>0, quantity rises), unitary (=1, quantity rises by exactly the same percentage as income) or luxury (>1, quantity rises more than proportionately with increasing income). By this definitions, most medical care is classified as an economic luxury because the share of income that an individual, or a nation, is willing to spend for health care goes up substantially as they become wealthier.
8.
Empirical estimates of the demand for medical care usually show that it is quite inelastic, in the range of 0 to 0.5. However, elasticity is greater for items which are viewed as discretionary (dentistry, counseling) and less fully covered by insurance, and may well exceed 1.0 over the long span of time required to change health habits and beliefs.
9.
Efforts to improve health (exercise, nutrition, immunizations, check-ups, surgery) yield benefits that endure over many years, providing a greater life span and more active enjoyment. Since
Appendix 3: Demand ________________________________________________________ 191 they are rarely consumed in the present, like a movie, health care is better analyzed as a form of investment in human capital with a rate of return, risks, and obsolescence analogous to investments in industrial productivity.
PROBLEMS 1.
What is the difference between Mr. Axel's demand for physical therapy and his need for physical therapy?
2.
Which is more elastic, dental visits or diabetes visits? why? Physician visits or hospital days? Psychiatry or orthopedics?
3.
If the price of office visits goes from $20 to $22, and the number of visits per family per year declines from 12 to 10, what is the elasticity of demand?
4.
If college students are poor, why do they spend so much on discretionary goods, like CDs? Are the ones who go on to medical school richer or poorer than the ones who take jobs upon graduation?
5.
Suppose Betty's demand for physicians visits is Quantity = 10 - (0.2 × Price). a.
Draw Betty's demand curve.
b.
What is the quantity demanded at a price of $10? $25?
c.
At what price will she buy 4 visits? 8 visits?
d.
If the government agrees to pay 1/2 of her health care bills, what would her quantity demanded now be at a price of $10? $25? Draw the new, subsidized, demand curve.
e.
What is the elasticity between a price of $5 and $6? Around a price of $30? Around a quantity demanded of 8 visits?
f.
Calculate the elasticity for the new, 1/2 subsidized demand at a price of $30 and compare it with the elasticity you obtained from the original demand curve. What about the new elasticity around 8 visits?
6.
Give examples of health care services that are a) necessities and b) luxury goods (as defined by income elasticity).
7.
What are the units in which Prozac is bought? What are the units in which psychotherapy is purchased?
8.
Is chemotherapy a substitute or a complement for cancer surgery?
9.
Provide an example of quality change reducing and increasing quantity demanded.
10. Dr. Old requires that all services be paid for at time of treatment, in cash. If he decides to allow patients to pay with credit cards, will this increase or decrease demand? Will it increase or decrease price elasticity? 11. Which is more price elastic, the demand for Cesarean sections, or the demand for vaginal deliveries? Why?