Snow Engineering: Recent Advances, Izumi, Nakamura & Sack (ecis) © 1997 Balkema, Rotterdam. ISBN 90 5410 865 7
Database and methodology for conducting site specific snow load case studies for the United States Wayne Tobiasson & Alan Greatorex Cold Regions Research and Engineering Laboratory (CRREL), Hanover, N.H., USA
ABSTRACT: We have developed data and a methodology for determining the ground snow load at locations not covered in our ground snow load map of the United States due to extreme local snow load variations in the area. The elevation, the years of record available, the maximum observed value and the "50-year" ground snow load at a number of nearby sites are considered. A plot of elevation vs. load is often helpful. 1 DATABASE AND STATISTICS Measurements collected by the National Weather Service (NWS) are the largest source of information on snow on the ground in the United States. At 266 "firstorder" NWS stations across the nation, both the depth of the snow on the ground and its load (i.e., its "water equivalent") have been measured frequently each winter. At about 11 ,000 other NWS "co-op" stations only the depth of the snow on the ground has been measured. At each NWS station we determined the maximum depth of the snow on the ground each winter. At each NWS first-order station we also determined the maximum water equivalent for each concurrent winter. Lognormal extreme value statistics (Ellingwood and Redfield 1983) were then used to estimate the depth of snow on the ground and, where available, the ground snow load (i.e., the water equivalent) having a 2% annual probability of being exceeded (i.e., the 50-year mean recurrence interval value). We did not do statistics for locations having less than 10 years of data or locations with 10 or more years of data but less than 5 years in which snow was observed. The nonlinear equation of best fit between the 50year depths and 50-year loads at the 204 first-order stations in the continental United States which met our criteria for analysis was as follows:
L = 0.279 D 1·36
(l)
where L =50-year load in lb/ft2 and D =50-year depth in inches. In SI units with the load in kN/m 2 and the depth in meters, the equation becomes L = 1.97 Dl.36.
249
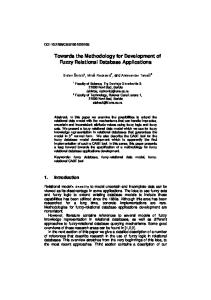
A separate equation was developed for Alaska from the 20 first-order stations located there. Our database also contains information from about 3300 additional locations where the water equivalent of snow on the ground is measured several times each winter. Some of those measurements are by companies that generate hydroelectric power, others are by the Corps of Engineers for flood forecasting, but most have been collected by the Natural Resource Conservation Service (NRCS) for similar purposes and for monitoring water supplies. Until recently NRCS was known as the Soil Conservation Service (SCS). Most of these "non-NWS" locations are in high mountain watersheds, not in populated areas. 2 THE NEW SNOW LOAD MAP The 50-year loads determined at the NWS first-order stations and the 50-year loads at the NWS co-op stations generated by use of Equation 1 were used to construct a new national snow load map, a portion of which is shown in Figure 1. Snow loads are presented as zones. Some zones contain elevation limits above which the zoned value should not be used. These elevation limits, in feet, are shown in parentheses above the zoned value. In some areas extreme local variations in ground snow loads preclude mapping at this scale. In those areas the map contains the designation "CS" instead of a value. CS indicates that a case study is required to establish ground snow loads for locations in this area. We examined the possibility of integrating the nonNWS information into the new map with the hope of being able to reduce the extent of areas needing case
In CS areas, site-specific Case Studies are required to establish ground snow loads. Extreme local variations in ground snow loads in these areas preclude mapping at this scale. Numbers in parentheses represent the upper elevation limits in feet for the ground snow load values presented below. Site-specific case studies are required to establish ground snow loads at elevations not covered. To convert lb/f12 to kN/m2, multiply by 0.0479. To convert feet to meters, multiply by 0.3048. 0
100
200
300 milea
Figure 1. Northeast portion of the new ground snow load map of the United States. Loads are in lb/ft2 . That report contains numerous state maps on which all NWS first-order, NWS co-op and non-NWS stations are located. Figure 2 is one such map containing only NWS stations. Black dots indicate co-op stations and black triangles indicate first-order stations. The station number is presented adjacent to its dot or triangle. All non-NWS stations are presented on separate maps for the 24 states in which such stations exist. The report also tabulates ground snow load data for all of these stations. Table 1 shows a small portion of the NWS tabulation for Maine. Water equivalent information for firstorder stations is presented in bold type. As with the maps, the NWS and non-NWS tabulations are presented separately. The state maps contain a latitude and longitude reference grid and county boundaries. With this information a site of interest can be located on a state map. Using the scale shown on that map and a compass, we draw circles with radii of 25 and 50 miles (40 and 80 km) around the site of interest. The number of any NWS fi,rst-order station present within the 50-mile (80km) outer circle is determined and noted on the case
studies but determined that little could be gained by doing this. Thus our new map is based only on NWS data. However, all the non-NWS information has been incorporated into our database, making it available for case studies. The new map was recently published in the 1995 version of the national design load standard, "Minimum Design Loads for Buildings and Other Structures" (ASCE 1995), which is known as ASCE 7-95. That standard requires that all ground snow loads used in design "be based on an extreme value statistical analysis of data available in the vicinity of the site using a value with a 2% annual probability of being exceeded (50-year mean recurrence interval)." Our data and methodology make this possible anyplace in the United States. 3 "SNOW LOADS FOR THE UNITED STATES" Our report with the above title (Tobiasson and Greatorex 1996) presents the new snow load map and explains in detail the many steps we took to consider missing and questionable data and to develop the equations used to convert 50-year depths to 50-year loads.
250
ARIZONA
NWS STATIONS
112"
Ill'
114"
115'
IOV
110'
Ill"
COLORADO
NEVADA
JT
JT
mf
..
" ~4~
..
.,..
•
('
+
.,
•141
4~
13~61Z1 llll.l
3Jl
4
Ill
3.4
&
elf]
.,. +
...,..
I~
•51
.,
15"'"
114
·"'"
l'
~zs
. ..
J20
t19
34
1f2
J-4S
lll
35"
1,'4
+ •134
.
.,, " 'l'
311
V' +
fO ,,, ]43
\'l d4 35'
1,44+ Zllo
lZl
~
NEW MEXICO
.,
f
43
~1'4 n3
1\0
fl7 1f4 Jl'-
"1¥113
"
+
lj3
'4
\lO ~"
Jl
24\,246
IJO
.:1 l•
114" 115'
.-----.----,J:r40"
\'
lOl
PHOENIX. IZ.
••lOl l71
• • Ill
0
10
20
Jl'JO"
31'--·1---- . , . . . . - - - - i - - - 112"
111".
+---
-
-JI"
110'
JO lolllES
Figure 2. NWS stations in Arizona. mation are labeled (W.E.) and (DEPTH EQ) to show that the first is based on water equivalent measurements and the second on snow depth measurements. Next the numbers of all NWS co-op stations within the 25-mile (40-km) inner circle are listed on the case study form in order of increasing distance. Distances from the site of interest are determined and noted on the form. If the circles enter an adjacent state, stations within that state are also needed. To facilitate that, the location of all adjacent-state stations within 25 miles (40 km) of a state's border are also shown on each state map as in Figure 2. Their numbers are not shown. They
study form. If there is more than one first-order station, the closest is listed first. The scale on the map is used to determine the distance from each site of interest and those distances are noted on the case study form. An example case study form is shown in Figure 3. Space is provided for two lines of information for each first-order station. On the first line, the water equivalent (W.E.) values are presented. The second line presents loads generated by converting the 50-year and maximum observed depths measured during the same period to loads using Equation 1 (everywhere but Alaska, where a somewhat different equation is used). The first and second lines of first-order station infor251
are obtained from the map of that adjacent state. The state-by-state, station-by-station tabulation for NWS stations is then consulted for information on each station. That information is added to the case study form. In this way, the elevation, 50-year ground snow load, record maximum load, total years of record and number of years with no snow are transferred to the case study form for each nearby NWS station. For some locations in the tabulation not enough data were available to determine a 50-year ground snow load. Nonetheless, all"information -available for that location is transferred to the case study form since it is of some value in the analysis. Then maps in the non-NWS series are examined to determine if there are any non-NWS stations within 25 miles (40 km) of the site of interest. Information on each non-NWS station found is obtained from the nonNWS tabulation and transferred to the case study form. The new snow load map (Fig. 1) is consulted and the mapped ground snow load and any elevation limitations on it are listed on the case study form. If the case study is being done for a place in a CS zone, as is often the case, CS is listed as the ASCE 7-95 mapped value. Since we conduct numerous snow load case studies we have computerized the assembly of information on case study forms. We input the name, latitude, longitude and elevation of the site of interest and, with a few manual prods, the form is printed out. Figure 4 is an example. It contains the station name instead of its number. The distance and azimuth of each station from the site of interest are calculated and tabulated automatically. Although the manual and computerized case study forms are slightly different, both contain all the information needed to do the case study. 4 OBTAINING AN ANSWER Once the case study form is filled in, it is analyzed to obtain a ground snow load for that location. 4.1 NWS first-order stations For all NWS first-order stations within 50 miles, we compare the (W.E.) values to the (DEPTH EQ) values. When the two ground snow load (P g) values are about equal, we give Equation 1 credit for doing a good job of converting 50-year depths to 50-year loads in this area. When the values are not close, either the depth or water equivalent measurements are suspect or Equation 1 is not good at predicting loads here. Our investigations convince us to place somewhat more trust in the water equivalent values, but we keep an open mind as we examine the rest of the case study data. When
Table 1. A portion of the NWS station tabulation for Maine. Pg is the ground snow load. Sta
Elev
#
ft
Pg Rec Years Max Ibitt lblff
To1 No Sno
Maine
470
42
49 10
39 5 2 600 3 350 67 51 43 4 190 69 62 41 5 110 46 51 35 20 61 59 42 6 31 1 7 710 32 2 8 400 9 600 70 42 11 48 8 10 1060 420 154 44 15 11 12 560 94 101 31 13 70 56 45 37 14 80 35 25 16 15 820 95 88 34 15 620 85 76 43 16 1000 38 5 17 1000 94 57 23 360 81 62 42 1~ 25 4 19 400
0 0 0 0 0 0 0 0 0 0 0 0 0 0 0
0 0 0 0 0
non-NWS information is available, it is quite helpful in resolving questions about NWS first-order station information since it represents independent water equivalent (i.e.,load) measurements, thereby sidestepping any depth-to-load-equation concerns. We always examine each first-order station's years of record and its record maximum values before deciding how much we trust its 50-year value. A first-order station only a few miles (kilometers) away from the site of interest is given more weight than one close to 50 miles (80 km) away. Elevation differences are also an important issue and are considered in a similar way. 4.2 NWS co-op stations This is usually the largest body of information on the case study form. Since it is arranged state-by-state according to distance ("radius" on the form) from the site of interest, the uppermost stations in each state's array are the most valuable. If there are a few stations within 12 to 15 miles (19 to 24 km) with long periods
252
SNOW LOAD CASE STUDY FOR
• ~y~.Q_ - -
1'01.1 ... CI411!
tal~ude
!'· - ~·
Radios Elev.
Station
NWS Fl&'!oT DQ.05fl.
_]r_'Z:fJ_~ _
LonQ41ude
• u& Z.,'a
zs
""'n. Sl
(ft)
!ml.l
41 i1o
4t:t
l.f.D
,.,0
I
A. 6
__
Elevation
Po
Record
I(lbnl'l
Max. (lblft')
zr
zs
Years or Record Total
-----,-s-- - 11
"'"
Z1
7ZD
'"
·~
zz
17 ~ Z.7 f8 - - - ·----- · -·· - -- -·----~+-~+.~+=~-f 17 ~ ~ -- ------- ---- - -- - --------+1=-t------;+-+--T=--1 IS 1-tu u IMD z.q
••"'
lO
~~--
'" ,.. z.c
Jo
&I I A-3D lJ 158t1
u
[lq7
13
IID6
14 IT
IKZD 4Z.D ''IH 110
31 IS 1.7
'40
1.7 'Z.S
WOA 'U
!I f f
i , . ~4
t)
141 ID
Zt
---- --- - ----- - _______ _i__}---
I
~
II
1ttll &S g) J4 fJD If ST41 4-G - --- --·---- - ---- ------+J!~~rl~~~-~--~;.Zl ___- ~.!_ _ UD z.s - 34 I,q " -- - --- -- -- --- ------- -~L+-4'J-l-~=+;~ 15 14 140 c;e 4
11
No Snow - ~ --
4:1 -- 3-, - ·- - 24-- - c;- -· - - _]~ - ~ ~ ~- --.:.-::_. t6_
f- -------- - - ----- -· ---------i-1~~_!_+--;:=.L~_:;..:!'---l
59
13Z.Cn
7ZO
.
"'
"'
z.o z.a
'Z.D
I
IS
0
,.
e
8
"II
'"
ss a.s
,.zo __
0
·--
_ C!_ -0
I 0
z.
11
0
"
0
••
IJ
ZGr
I
0
t.
J8
28
ID
"
tl
ZD
1.3