Data-Link Layer Traceback in Ethernet Networks Michael T. Snow
Thesis submitted to the Faculty of the Virginia Polytechnic Institute and State University in partial fulfillment of the requirements for the degree of
Master of Science in Computer Engineering
Dr. Jung-Min Park, Chair Dr. Y. Thomas Hou Dr. Sandeep Shukla
November 27, 2006 Blacksburg, VA
Keywords: Traceback, Link Layer, Ethernet, Wired Networks
Copyright 2006, Michael Snow
Data-Link Layer Traceback in Ethernet Networks Michael T. Snow Abstract The design of the most commonly-used Internet and Local Area Network protocols provide no way of verifying the sender of a packet is who it claims to be. Protocols and applications exist that provide authentication but these are generally for special use cases. A malicious host can easily launch an attack while pretending to be another host to avoid being discovered. At worst, the behavior may implicate a legitimate host causing it and the user to be kicked off the network. A malicious host may further conceal its location by sending the attack packets from one or more remotely-controlled hosts. Current research has provided techniques to support traceback, the process of determining the complete attack path from the victim back to the attack coordinator.
Most of this
research focuses on IP traceback, from the victim through the Internet to the edge of the network containing the attack packet source, and Stepping-Stone traceback, from source to the host controlling the attack. However, little research has been conducted on the problem of Data-Link Layer Traceback (DLT), the process of tracing frames from the network edge to the attack source, across what is usually a layer-2 network. We propose a scheme called Tagged-fRAme tracebaCK (TRACK) that provides a secure, reliable DLT technique for Ethernet networks. TRACK defines processes for Ethernet switches and a centralized storage and lookup host. As a frame enters a TRACK-enabled network, a tag is added indicating the switch and port on which the frame entered the network. This tag is collected at the network edge for later use in the traceback operation.
An
authentication method is defined to prevent unauthorized entities from generating or modifying tag data. Simulation results indicate that TRACK provides accurate DLT operation while causing minimal impact on network and application performance.
Table of Contents Table of Contents ............................................................................................................. iv List of Figures................................................................................................................... vi List of Tables .................................................................................................................. viii Acronyms .......................................................................................................................... ix Chapter 1: Introduction ................................................................................................... 1 1.1 Problem Description ................................................................................................. 1 1.2 Motivation................................................................................................................. 3 1.3 Contributions ............................................................................................................ 5 1.4 Organization.............................................................................................................. 5 Chapter 2: Background Information .............................................................................. 7 2.1 Terminology.............................................................................................................. 7 2.2 IEEE Ethernet Standards .......................................................................................... 8 2.2.1 IEEE 802.3 ......................................................................................................... 8 2.2.2 IEEE 802.1D .................................................................................................... 10 2.2.3 IEEE 802.1Q .................................................................................................... 12 2.2.4 IEEE 802.3ac ................................................................................................... 13 2.3 Simple Network Management Protocol (SNMP) ................................................... 15 2.4 IP Traceback ........................................................................................................... 17 2.4.1 Source Path Isolation Engine (SPIE) ............................................................... 18 2.5 Stepping-Stone Traceback ...................................................................................... 19 2.6 Data-Link Layer Traceback .................................................................................... 20 2.6.1 A Layer-2 Extension to SPIE........................................................................... 21 iv
Chapter 3: Network and Attacker Models ................................................................... 23 3.1 Network Model ....................................................................................................... 23 3.2 Attacker Model ....................................................................................................... 26 Chapter 4: Tagged-Frame Traceback (TRACK) ........................................................ 29 4.1 Protocol Architecture.............................................................................................. 29 4.1.1 TraceBack Tag (TBT) Format ......................................................................... 30 4.1.2 TRACK Frame Tagger (TFT).......................................................................... 32 4.1.3 TRACK Analysis and Collection Host (TACH).............................................. 33 4.2 Protocol Operation.................................................................................................. 37 4.2.1 TFT Operation ................................................................................................. 37 4.2.2 TACH Tag Collection...................................................................................... 40 4.2.3 TACH Traceback Request Processing............................................................. 40 4.3 Protocol Security..................................................................................................... 42 4.3.1 AUTH field Calculation and Verification........................................................ 43 4.4 Implementation Considerations .............................................................................. 43 4.4.1 TRACK Frame Tagger (TFT).......................................................................... 43 4.4.2 TRACK Analysis and Collection Host (TACH).............................................. 44 Chapter 5: Data-Layer Traceback Scheme Comparison............................................ 47 5.1 Traceback Accuracy ............................................................................................... 47 5.2 False Positives......................................................................................................... 53 Chapter 6: Simulation .................................................................................................... 55 6.1 TFT Module Implementation.................................................................................. 58 6.2 Simulation Metrics.................................................................................................. 59 6.3 Ethernet Delay ........................................................................................................ 61 6.4 MAC Relay Entity (MRE) Queue Length .............................................................. 71 6.5 Application Throughput.......................................................................................... 80 Chapter 7: Future Work ................................................................................................ 82 Chapter 8: Conclusions .................................................................................................. 84 Bibliography .................................................................................................................... 85
v
List of Figures Figure 1.1 – The 3-stage traceback process ........................................................................ 3 Figure 2.1 – Standard Ethernet frame layout ...................................................................... 9 Figure 2.2 –Ethernet frame layout with 802.1Q tag ......................................................... 14 Figure 2.3 –802.1Q tag layout .......................................................................................... 15 Figure 4.1 –Ethernet frame layout with 802.1Q and TBT tags ........................................ 30 Figure 4.2 – Traceback Tag (TBT) layout ....................................................................... 31 Figure 4.3 – Traceback Tag (TBT) FLAG field ............................................................... 32 Figure 4.4 – Example L2 table.......................................................................................... 34 Figure 4.5 – TFT process flowchart.................................................................................. 38 Figure 5.1 - Sample network for scheme comparison ...................................................... 48 Figure 5.2 – Attack timeline for scenario 1 ...................................................................... 49 Figure 5.3 – Attack timeline for scenario 2 ...................................................................... 50 Figure 5.4 – Attack timeline for scenario 3 ...................................................................... 52 Figure 6.1 – Simulation network ...................................................................................... 56 Figure 6.2 – Ethernet delay for the light-load network, TRACK disabled....................... 63 Figure 6.3 – Ethernet delay for the light-load network, fast TRACK .............................. 64 Figure 6.4 – Ethernet delay for the light-load network, medium TRACK ....................... 64 Figure 6.5 – Ethernet delay for the light-load network, slow TRACK............................. 65 Figure 6.6 – Ethernet delay for the medium-load network, TRACK disabled ................. 66 vi
Figure 6.7 – Ethernet delay for the medium-load network, fast TRACK......................... 67 Figure 6.8 – Ethernet delay for the medium-load network, medium TRACK ................. 67 Figure 6.9 – Ethernet delay for the medium-load network, slow TRACK....................... 68 Figure 6.10 – Ethernet delay for the heavy-load network, TRACK disabled................... 69 Figure 6.11 – Ethernet delay for the heavy-load network, fast TRACK .......................... 70 Figure 6.12 – Ethernet delay for the heavy-load network, medium TRACK................... 70 Figure 6.13 – Ethernet delay for the heavy-load network, slow TRACK ........................ 71 Figure 6.14 – MRE queue length for the light-load network, TRACK disabled.............. 72 Figure 6.15 – MRE queue length for the light-load network, fast TRACK ..................... 73 Figure 6.16 – MRE queue length for the light-load network, medium TRACK .............. 73 Figure 6.17 – MRE queue length for the light-load network, slow TRACK.................... 74 Figure 6.18 – MRE queue length for the medium-load network, TRACK disabled ........ 75 Figure 6.19 – MRE queue length for the medium-load network, fast TRACK................ 76 Figure 6.20 – MRE queue length for the medium-load network, medium TRACK ........ 76 Figure 6.21 – MRE queue length for the medium-load network, slow TRACK.............. 77 Figure 6.22 – MRE queue length for the heavy-load network, TRACK disabled............ 78 Figure 6.23 – MRE queue length for the heavy-load network, fast TRACK ................... 78 Figure 6.24 – MRE queue length for the heavy-load network, medium TRACK............ 79 Figure 6.25 – MRE queue length for the heavy-load network, slow TRACK ................. 79 Figure 6.26 – Application performance for all scenarios ................................................. 81
vii
List of Tables Table 4.1 – TFT process parameters................................................................................. 33 Table 5.1 – Aggregate FDB for the initial case ................................................................ 48 Table 5.2 – Aggregate FDB data for scenario 1, time t+5................................................ 49 Table 5.3 – Aggregate FDB data for scenario 2, time t+2................................................ 51 Table 5.4 – Aggregate FDB data for scenario 2, time t+5................................................ 51 Table 5.5 – Aggregate FDB data for scenario 3, time t+2................................................ 53 Table 5.6 – Aggregate FDB data for scenario 2, time t+5................................................ 53 Table 6.1 – Summary of simulation scenarios.................................................................. 58
viii
Acronyms DGA
Data Generation Agent (for SPIE)
DLT
Data-Link Layer Traceback
FDB
Filtering Database [7]
MAC
Media/Medium Access Control [5]
MRE
MAC Relay Entity [5]
MSTP
Multiple Spanning Tree Protocol [8]
RSTP
Rapid Spanning Tree Protocol [7]
SCAR
SPIE Collection And Reduction agent [4]
SPIE
Source Path Isolation Engine [4]
STM
SPIE Traceback Manager [4]
TACH
TRACK Analysis and Collection Host
TBT
TraceBack Tag
TFT
TRACK Frame Tagger
TRACK
Tagged fRAme tracebaCK
VLAN
Virtual Local Area Network [7]
xDGA
Extended DGA [3]
ix
Chapter 1: Introduction Internet-based attacks are increasingly common in today’s networks. Tools are readily available that allow even inexperienced users to launch sophisticated attacks. In addition, the most popular and widely-used networking protocols allow a user to disguise his or her true identity and location.
The attacker may also be able to control several other
compromised machines, or zombies, to carry out the attack. The process of locating the attacker, referred to as traceback, is a complex multistage process. Packets may have to be traced through many different networks using techniques at multiple network layers. Major research up to this point in the area of traceback methods has left an incomplete picture of the entire path between the malicious user and the victim.
1.1 Problem Description In a typical Internet attack, the attacker will take control of one or more machines, referred to as zombies. From these machines, the attacker will send malicious packets. The attack may contain a flood of packets, as in a Distributed Denial of Service attack (DDoS) [1] or a single, well-crafted packet targeted at a particular network device or operating system [2]. Typically the attack coordinator will send a control packet to the zombie machines. Those machines will send attack packets toward the victim machine.
1
The path of a packet from a zombie machine to its router will often be taken across a Local Area Network (LAN), which is often a layer-2 switched network, where its destination is based on a data-link layer address. Once at the router, the packet is sent across the Internet toward the victim, its path and destination determined by layer-3 address information. The source addresses of the attack packets will often be altered, or spoofed, to conceal the location of those machines. This is possible because the designs of the most widely implemented layer-2 and layer-3 protocols, Ethernet and the Internet Protocol (IP), provide no guarantee of the source’s authenticity.
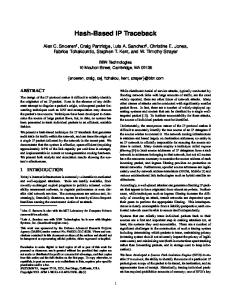
The only reliable way to determine the machines involved in the attack is to trace the entire path of the attack, usually a three-stage process, as shown in Figure 1.1. The first stage is the path from the victim machine to the edge of the network from which the attack packet originated. The second stage is from the router at the edge of that network to the machine that actually sent the packet, the zombie. The third is tracing the flow of control packets to the zombie from the attack coordinator. These stages are accomplished by IP Traceback, Data-Link Layer Traceback, and Stepping-Stone Traceback, respectively. While IP Traceback and Stepping-Stone Traceback are well-researched areas, very little work has been done in the area of Data-Link Layer Traceback (DLT). In 2003, Hazeyama et al. [3] published a scheme to support link layer traceback. To the best of our knowledge, this has been the only scheme published to date.
2
Attack host
Stepping stone traceback Stepping stone (zombie) Data-link layer traceback
Switch
Leaf router
IP traceback
Victim
Figure 1.1 – The 3-stage traceback process
1.2 Motivation To complete the full traceback picture, a network administrator must be able to trace a packet along the complete attack path described above. Without a reliable DLT scheme in place, the attacking machine would be difficult, if not impossible, to find within its layer-2 switched network. The previously published scheme focuses on minimizing storage requirements and strict adherence to established networking standards. Though this allows for easy implementation in almost all existing Ethernet networks, it comes at the expense of high computational overhead at the edge router and possibly inaccurate results in the form of false positives and false negatives. The scheme also assumes that a particular IP Traceback method, SPIE [4], is supported at the edge router [3]. It may also cause a significant increase in network overhead. While the scheme can reliably locate a 3
zombie machine under a number of circumstances, a clever attacker can easily prevent detection of itself. In addition, the scheme does not fully define operation in a complex multi-tier switched network where Virtual LAN’s (VLAN’s) are used. This scheme is best suited for a network where SPIE is already implemented and strict adherence to established standards is required.
We propose a DLT scheme called Tagged fRAme tracebaCK, TRACK, designed with the goals of increasing the potential for accurate results, decreasing edge router loading, and removing the dependence on the SPIE scheme. TRACK defines an extension to the Ethernet frame format to tag frames as soon as they enter the network. The frame extension is based on well-established standards. Those tags are collected by a dedicated process at the network edge.
The previously published technique relies on forwarding database information that is collected at the switches during normal frame processing. From this information, the protocol infers the location of the malicious host. A malicious host can easily avoid detection by using another active host’s layer-2 address or flooding a switch with many bogus layer-2 addresses. In either case, incorrect information may be stored in the forwarding tables and collected by the scheme. Based on that information, the protocol may incorrectly implicate a non-existent host or a non-malicious host. TRACK avoids this condition by tagging frames based on administrator-controlled configuration information, rather than relying on table data collected from the switches.
4
1.3 Contributions The primary contributions of this thesis are the discussion of the research area of DataLink Layer Traceback (DLT) and proposal of a viable DLT scheme. Such a scheme is a must when the complete path between an attacker and a victim needs to be known, yet the issue has been discussed very little in major publications. Without a viable DLT method in place, the task of finding the zombie machine in a switched subnet may be nearly impossible. The task is difficult, restricted by limited processing power and storage space available on most network switching equipment.
To the best of our
knowledge, the work of Hazeyama et al. [3] is the only existing work on DLT. Their DLT scheme relies on a particular IP Traceback scheme to be implemented and may fail to catch certain types of malicious behavior. TRACK provides a reliable DLT method that uses frame tags to determine the entry point of a frame onto the network. This allows the malicious node to be located under attack scenarios where the previous scheme would otherwise fail. It does not require any particular IP Traceback scheme to be implemented. TRACK leverages well-established and widely-implemented standards and principles to accomplish the DLT task securely. It is designed to prevent nonauthorized entities from creating false traceback data and maintains control information to signal when such an event occurs. It is ideal for university and corporate campuses where large, complex switched Ethernet networks are common.
1.4 Organization Background information, including applicable networking standards and related research, is discussed in Chapter 2. In Chapter 3, the network and attack models and assumptions
5
are discussed. In Chapter 4, we discuss the layout and operation of the TRACK protocol and associated devices. A comparison of TRACK with Hazeyama et al.’s scheme is presented in Chapter 5. Chapter 6 describes the simulation framework and experimental results. Future work is discussed in Chapter 7. Chapter 8 concludes this thesis.
6
Chapter 2: Background Information This chapter describes background information related to the task of traceback. Sections 2.1 through 2.3 describe terminology and related networking standards, specifically those related to the DLT problem. Sections 2.4 through 2.6 describe the overall traceback process, including specific discussion on the previously published DLT scheme.
2.1 Terminology Within the realm of Internet-based attacks, several terms are used frequently and their meanings vary in the literature.
This section defines those terms and others used
throughout this thesis. A “zombie network” refers to a network of computers containing one or more zombie machines. An “edge network” is any network containing end hosts. The Internet, then, connects edge networks via a core network of routers. Each edge network will have one or more edge routers connecting it to the Internet. Within edge networks, a unit of data is referred to as a frame. We assume that these networks are switched or bridged, meaning that frames are forwarded within the edge network based on their layer-2 addressing information. While some network switches and bridges support cross-layer switching, where forwarding is based on layer-2 and layer-3 information, we assume that primarily only layer-2 information is used. Within the
7
Internet, units of data are referred to as packets and they are routed based on layer-3 addressing information.
2.2 IEEE Ethernet Standards The IEEE defines the Ethernet standards for Local Area Networks.
The Ethernet
standard specifies the signaling protocols for layer 1 (Physical layer) and frame formats at layer 2 (data-link layer). Standards are also defined for switch behavior, including the selection of links where redundant links are present and the use of Virtual LAN’s to control network topology.
2.2.1 IEEE 802.3 IEEE 802.3 defines the Ethernet standard which has been revised many times to support new communication rates and physical media types [5]. This standard defines both the physical signaling protocol for layer 1 and the frame format for layer 2. The physical layer signaling protocol is beyond the scope of this thesis. We are concerned primarily with the Ethernet frame format, as shown in Figure 2.1 below. An Ethernet frame contains 7 or 8 fields, depending on the data transmitted and requires that a transmitted frame be at least 64 Bytes long.
The Ethernet frame header contains 5 fields.
The PREAMBLE field is used to
synchronize clocks between transceivers. It contains an alternating sequence of 1’s and 0’s beginning with a 1 and ending with a 0. The FRAME START SEQUENCE is a fixed pattern of 8 bits to signal to the receiver that the rest of the frame transmission follows. Immediately following these fields are two 48-bit ADDRESS field, one each for the
8
SOURCE and DESTINATION. Ethernet uses 48-bit addresses, known as Media Access Control (MAC) addresses to uniquely identify hosts at layer 2. Special case destination addresses are also defined that allow a station to broadcast a single frame to all hosts on the network or to a previously defined group of stations. The LENGTH/TYPE field specifies either the length of the frame or the type of protocol used for the data carried by the frame. If the field value is between 0 and 1500 (0x0 and 0x5DC), it is interpreted as the length of the data field. If it is between 0x5DC and 0xFFFF, it is interpreted as the protocol type for the data field, such as IP (0x0800). These types are defined by the IEEE and maintained in by the IEEE EtherType Field Registration Authority [6].
PREAMBLE FRAME START SEQ DESTINATION ADDRESS SOURCE ADDRESS LENGTH/TYPE MAC CLIENT DATA 46-1500 OCTETS PAD 4 OCTETS FRAME CHECK SEQUENCE Figure 2.1 – Standard Ethernet frame layout 7 OCTETS 1 OCTET 6 OCTETS 6 OCTETS 2 OCTETS
Following the header is the MAC CLIENT DATA field. This field carries either layer 2 data or an encapsulated layer 3 packet. Per the Ethernet standard, the entire frame must be 64 octets long to allow frames to propagate between devices so the collision detection system functions correctly. To support this, the data field must be at least 46 octets long. If the data transmitted is shorter that this, the field is padded (PAD) to meet the minimum length requirements.
In general, the DATA field may be up to 1500 octets long.
However, additional standards have been defined to allow significantly longer frames,
9
such as Jumbo frames of up to 9000 bits in size1. The last field in the frame is the 32-bit FRAME CHECK SEQUENCE (FCS). This value is determined by a Cyclic Redundancy Check (CRC) function based on a polynomial of degree 32.
2.2.2 IEEE 802.1D This standard defines bridge and switch operation for Ethernet networks. Bridges and switches are used to join Ethernet networks and end hosts together. For the purposes of this thesis, the terms bridge and switch may be used interchangeably since the primary difference between the two is the number of networks or hosts they may join. IEEE 802.1D defines processes including forwarding (relaying) of frames between ports, learning of MAC addresses for forwarding, queuing to support traffic classification, and execution of the spanning tree protocol (STP) to ensure a loop-free topology [7]. A bridge is responsible for ensuring frames get to the proper destination in accordance with the current active topology of the network and the Quality of Service (QoS) parameters established.
Upon successful receipt of a valid frame, it may go to several abstracted destinations within the switch. We will discuss the forwarding and learning processes since the others are outside the scope of this thesis. In the learning process, the switch associates a MAC address with a port on the switch, under the conditions that the MAC address is not governed by an administrative setting, the port is active in the current topology, either due to an administrative setting or execution of the STP, and the source address is a valid 1
The original Jumbo Frame standard was proposed by Alteon Networks in a white paper published in 1997. Alteon has since been acquired by Nortel Networks and the white paper is no longer available. Any frame between 1500 bits and 9000 bits in size is considered to be a “Jumbo Frame.”
10
unicast address. If any of those conditions is not met, the source address is not learned. In the forwarding process, the switch prepares to transmit the frame toward its destination. The frame must have been received on an active port, as defined by the current topology, and must be scheduled for transmission on an active port that is not the same as the port the frame was received on and which supports a maximum frame size at least the size of the frame to be transmitted. Frames to be transmitted are sent to the transmission queue(s) of the outbound port based on the traffic class of the frame and the number of traffic classes supported at the transmission port. If, at any point, the frame is modified, the FCS must be recalculated before the frame is transmitted.
Each switch maintains a Filtering Database (FDB) that stores the forwarding and filtering information used in the above processes. This information may be configured by an administrator or may be altered dynamically through the learning process described above or other normal operational processes, such as multicast group registration2. The information in this table maps a MAC address to a port, in the normal case, or group of ports, in the case of a multicast MAC address. The forwarding process can query this table to determine where a received frame should be scheduled for transmission. The dynamic entries are removed from the table after they reach an administrativelycontrolled age. The default value is 300 seconds, though any value in the range of 101,000,000 seconds is allowed.
2
IEEE 802.1D also defines the Multicast Group Registration Protocol (MGRP) to establish multicast address groups in Ethernet and communicate this information between switches. Discussion of this protocol is outside the scope of this thesis.
11
2.2.3 IEEE 802.1Q This standard defines the operation of Virtual LAN’s (VLAN’s) in an Ethernet network. VLAN’s are generally used to logically divide the network into segments based on host role or function, physical location, or any other criteria at the discretion of the network administrator. VLAN’s allow a distinction between the physical topology – how the network is actually wired together – and the active topology – how the network is virtually connected based on its current configuration.
One physical topology can
support many different active topologies. The Multiple Spanning Tree Protocol (MSTP) is defined to support the existence of a multiple spanning trees, one per VLAN, within the physical topology.
VLAN’s allow complex network topologies to be virtually
divided into smaller subnetworks. Previously, dividing the network was only possible using different physical hardware. IEEE Standard 802.1Q defines how bridges handle VLAN information and how the active topology is computed and maintained within the network [8]. This standard also defines the format for the 802.1Q tag, which is described in the following section which also discusses the tag’s position in the standard Ethernet header.
In a VLAN-aware network, each switch port is assigned a default VLAN ID as well as a number of other supported VLAN ID’s. Additionally, VLAN behavior is defined such that a port may transmit frames with or without VLAN tags attached. In general, when a frame arrives at a switch from a host, it will be assigned a VLAN tag based on the port it arrived on. It is inspected at several points during the forwarding process to determine what port it should be forwarded on (if any), if that port supports the VLAN ID assigned to the frame, and if the VLAN tag should be transmitted with the frame. If the frame is 12
forwarded to a port that does not support the VLAN ID or does not conform to other requirements established for that port, the frame will be dropped. Once the frame arrives on the output port, it is placed in the appropriate transmit queue based on the quality-ofservice parameters set for that port. If the frame arrives already tagged, the tag is checked against the list of supported VLAN ID’s for that port. If the VLAN ID indicated in the frame tag is supported on that port, the frame is forwarded using the previously described process. If not, the frame is dropped during ingress filtering. Any time the frame is altered (eg., a tag is added or removed), the Frame Check Sequence (FCS) must be recalculated.
For the purposes of xDGA and TRACK, it is necessary to know how VLAN’s would normally be used in a production network. xDGA uses specific knowledge of how VLAN information is stored and accessed through the Bridge-MIB objects. TRACK uses VLAN configuration information along with the forwarding database to control the tagging process.
2.2.4 IEEE 802.3ac The tag format used in the above VLAN standard is defined in IEEE Standard Supplement 802.3ac [9]. This standard is a supplement to the original 802.3 standard that defined, among other things, the Ethernet frame format and maximum frame size. The 802.1Q tag is a 2-octet tag added after the LENGTH/TYPE field. Its position is shown in Figure 2.2. When an 802.1Q tag is added to a frame, the contents of the original frame are shifted 4 Bytes. The original LENGTH/TYPE is copied to the MAC CLIENT LENGTH/TYPE field. The original LENGTH/TYPE field is set to 802.1QTagType
13
(0x8100) so the switch handling the frame knows that an 802.1Q tag is present in the frame.
The next field in the frame is the 802.1Q tag, contained within the TAC
CONTROL INFORMATION (TCI) field, which is followed by the rest of the original frame.
With the exception of the LENGTH/TYPE and TAG CONTROL
INFORMATION fields, all frame fields are identical in use to the corresponding fields in the original 802.3 standard.
PREAMBLE FRAME START SEQ DESTINATION ADDRESS SOURCE ADDRESS LENGTH/TYPE=802.1QTagType } QTagPrefix TAG CONTROL INFORMATION MAC CLIENT LENGTH/TYPE MAC CLIENT DATA 42-1500 OCTETS PAD 4 OCTETS FRAME CHECK SEQUENCE Figure 2.2 –Ethernet frame layout with 802.1Q tag 7 OCTETS 1 OCTET 6 OCTETS 6 OCTETS 2 OCTETS 2 OCTETS 2 OCTETS
The 802.1Q tag contains the USER PRIORITY, CFI, and VLAN IDENTIFIER (VID) fields, as shown in Figure 2.3. The USER PRIORITY (3 bits) and CFI (1 bit) fields are used to control switching behavior and their use is outside the scope of this thesis. The VLAN IDENTIFIER field (12 bits) determines which VLAN the switched frame belongs to and is used, with the other 802.1Q fields, MAC addresses and switch configuration information to determine how the frame will be handled by the switch and what link it will be forwarded on.
14
OCTET 1
OCTET 2
USER PRIORITY 7
5
CFI 4
VLAN IDENTIFIER 3
0
7
0
Figure 2.3 –802.1Q tag layout
Finally, the standard allows for an increase in the maximum Ethernet frame size. The standard also specifies that Ethernet MAC’s need not necessarily enforce the frame size limit. To fully support VLAN tagging, the network must support a maximum frame size of the Ethernet MTU (1500B) + the header and address information (18B) + the QTag Prefix (4B) = 1522B. The minimum frame size remains fixed at 64B, allowing the minimum DATA field size to be reduced to 42B, assuming an 802.1Q tag is present.
2.3 Simple Network Management Protocol (SNMP) Simple Network Management Protocol (SNMP) allows a network administrator to read or change parameters on an SNMP-enabled device.
These parameters may be
informative, such as performance statistics, or may control device operation, such as bringing a router interface up or down [10]. Version 1 was defined in RFC 1157 [11], but has since been obsoleted by versions 2 and 3. Versions 1 and 2 contained a serious flaw in that authentication information was sent in the clear. Version 3 (SNMPv3) was the first to supply a robust security mechanism that supported authentication and encryption of control messages. It does not defined a new communications format; rather, it is used in conjunction with the message formats defined in versions 1 and 2, though version 2 is preferred [12]. It is defined across 15 different RFCs, RFC 34103418 and 2271-2276. Of primary interest is the User Security Model (USM) defined in RFC 2274 [13]. The USM defines the methods by which a user is authenticated and 15
messages are encrypted. This module is designed to guarantee that a user is who he or she claims to be, that a message has not been modified in transit, that the message was received in a timely manner and not duplicated (as in a reply attack), and that the contents of the message are not disclosed to an unauthorized entity [12]. For authentication, the USM uses an HMAC [14] based on either the MD5 or SHA1 hashing algorithms. The input key is derived from a master key, based on the user’s password, which is transformed using an operation first described by Blumenthal et al. [15] and adopted by the standard. This process is referred to as localization and allows unique authentication and encryption keys to be generated from a single password. RFC 2274 also describes how the keys are to be managed.
Managed objects are defined by a Management Information Base (MIB) and are generally presented in numeric and human-readable forms. Objects are classified using a tree-like structure and levels of the tree are separated by dots. Each object has a unique identifier, the Object Identifier (OID), data type and syntax. The first version of SNMP used the Structure of Management Information (SMI), defined in RFC 1155 [16]. SMI version 2 (SMIv2), defined in RFC 2578 [17], was used as the MIB for SNMP version 2. Additional MIB’s have also been defined, some of which are device-class or manufacturer specific. For example, RFC 3414 [18] defines the operation of the USM and defines MIB objects to support USM operation. Of particular interest is the Bridge Management Information Base (Bridge MIB) defined in RFC 1493 [19]. It defines a set of objects that allows an SNMP entity to, among other things, query the FDB in a switch.
16
2.4 IP Traceback IP Traceback refers to the process of tracing a single packet or a flow of packets from the victim back through the network to the edge of the network from which the packet or flow originated. This is a very well researched area and many schemes have been proposed [4][20][21][22][23][24]. There are three main approaches to tracing a packet or flow.
One type of scheme involves packet tagging. Such schemes have been proposed by Savage et al. and Song et al. [20][21]. In these schemes, packets are tagged as they pass through routers in the network. A router may tag every frame or tag frames using a probabilistic function.
A packet may be tagged with complete or partial path
information. Another host is responsible for collecting and analyzing these tags to build an attack path for a given packet or flow. These schemes may require only a single packet for traceback or may require a flow of packets. Additionally, such schemes may provide authentication for packet tags to verify the identity of the tagging router [21].
In the second type of scheme, each router in the network collects data on the packets that it forwards. That data is aggregated by another host or set of hosts that process the data to form the attack path for a packet or flow. The Source Path Isolation Engine (SPIE) proposed by Snoeren et al. [4] is one such scheme and will be discussed in detail in the following section. The final approach involves inferring the route of the packet flow by determining the flow’s effects on the network. This type of traceback is restricted to large attack flows, however, since it requires that the flow have a measurable effect on the network. One such scheme, proposed by Burch and Cheswick [22], systematically 17
floods network links to determine the effect of the network link on the packet flood. From this information, the scheme can infer the route that the attack flow took through the network.
2.4.1 Source Path Isolation Engine (SPIE) SPIE is a traceback scheme that uses data collected by network routers to determine the path of an attack packet through a network. Its primary benefit is that it is able to effectively trace single-packet attacks rather than requiring a large packet flow. Additionally, the SPIE process is able to handle most normal packet transformations including Network Address Translation (NAT) router traversal, ICMP messages, IP-in-IP tunneling, and IPSec [4]. SPIE uses a multi-tier architecture with three components.
Each router in the network has a Data Generation Agent (DGA). The DGA computes packet digests for every packet that exist the router. The packet digests are stored in a digest table which is based on the Bloom filter data structure, a space-efficient storage structure with a tunable false positive rate [25]. A Bloom filter allows a large amount of data to be stored in a relatively small amount of space, at the expense some accuracy and processing overhead. The size of the storage mechanism and length of retention of data at the DGA are determined by the bandwidth of the network and the desired false positive rate. Given a packet digest and the digest table from a given router, the system is able to determine if that router ever processed the given packet.
One or more DGA’s is controlled by a SPIE Collection and Reduction Agent (SCAR). A network may have one or more SCAR’s, depending on the size, with each SCAR
18
responsible for a logical group of DGA’s. The SCAR collects data from its constituent DGA’s for long-term analysis and storage as well as maintains topology information for its section of the network. When a SCAR is notified of a traceback request, it pulls the packet digest tables from its DGA’s from the appropriate time period. Based on the topology information, the SCAR executes a reverse path flooding algorithm to determine the route the packet took through the network.
The entire process is coordinated by the SPIE Traceback Manager (STM). When the STM receives a traceback request from an authorized administrator, it dispatches a message to all SCAR’s to retrieve the digest tables from their DGA’s. The STM then sends a message requesting the attack graph to the SCAR responsible for the part of the network in which the victim is located. That SCAR returns the (partial) attack graph that originates at the victim’s edge router and terminates either at the edge of the zombie network, at the edge of the SPIE-enabled network, or at the end of the region covered by that SCAR. In either of the first two cases, the traceback process is complete. The complete attack graph is returned to the administrator. In the last case, the STM then queries the SCAR responsible for the portion of the network connected to the region of the first SCAR. This process continues until either the edge of the zombie network is found or the end of the SPIE-enabled network is reached. The partial attack graphs are combined to form the complete attack graph which is then returned to the administrator.
2.5 Stepping-Stone Traceback The goal of stepping-stone traceback is to determine the location of the attack coordinator.
Many Internet-based attacks are actually carried out by a network of 19
controlled machines (zombies) under the command of one or more attack coordinators. Stepping-Stone Traceback attempts to correlate the flow of packets into a zombie with the flow of attack packets out of the zombie. Once the scheme determines which inbound packets are used for control, the location of the coordinator can be determined using the source IP address or another round of IP traceback. This is also a very well researched area and many schemes have been proposed [23][24][26]. One such scheme, proposed by Wang and Reeves, embeds a “watermark” into a traffic flow by selectively altering the interpacket delay time [26]. The marked flows can then be correlated to correlate the inflow with the outflow. The scheme is effective even if the attack traffic is encrypted and is resistant to many timing-based methods an attacker could use to attempt to thwart the scheme.
2.6 Data-Link Layer Traceback IP traceback, by design, will only return the location of the edge router for the subnet in which the zombie machine is located. This is because the routing of packets within the Internet is determined by Layer 3 (L3) address information. Within the subnet, address is most likely based on Layer 2 (L2) information. Once the packet exits the L2 network, the L2 source and destination addresses will likely change at each L3 hop. Additionally, the packet may be transmitted over many different types of L2 links which have completely different frame and address formats. For example, a packet may start out transported over Ethernet within the source subnet to the edge router, then over ATM or FDDI links as it traverses the Internet, and finally back to Ethernet once inside the destination subnet. For a traceback scheme to be effectively locate a host in an L2 network, it would have to be able to map a received IP packet to a host based on L2 information which had been 20
previously collected. However, since source address information cannot be trusted, such a scheme must be able to determine where the device is physically connected to the network.
2.6.1 A Layer-2 Extension to SPIE To the best of our knowledge, only one Layer-2 traceback scheme has been published. This scheme extends the SPIE architecture to enable the packet ingress point to be narrowed down to a switch and port number on wired, switched Ethernet networks [3]. In the modified scheme, the DGA in each router is enhanced and referred to as an extended DGA or xDGA. An xDGA features an L2 digest table that links L2 location information to corresponding packet data stored in the L3 digest table, the data table stored in the DGA of the original SPIE scheme.
Since the scheme uses location
information, the network must be bridged and/or switched. Ethernet networks using hubs or any sort of always-shared bus technology are not supported by this scheme.
L2 location information consists of a host’s Ethernet Medium Access Control (MAC) address, the switch and port number that the MAC address is connected to, and the Virtual LAN (VLAN) assigned to that port. This information is determined using SNMP to query data from the forwarding databases (FDB) of the network switches. A switch FDB stores data that is either configured for the switch or learned on-the-fly while forwarding packets. This data is used to control the frame forwarding process and is collected by the xDGA process periodically. It is used to map the MAC address of an incoming packet from the subnet to a switch and port number and, optionally, a VLAN
21
identifier. The data collected is defined by a set of objects in the Bridge Management Information Base (Bridge-MIB).
When a traceback request implicates the subnet on which the xDGA is running, the xDGA generates the packet digest from the suspect packet. This digest maps to an entry in the L3 digest table. That entry is then mapped to an entry in the L2 digest table which will indicate which switch and port number the packet entered the subnet on. This process, which involves several rounds of hashing data and inspecting tables, is an O(n2) operation [3]. This is a result of the protocol’s design focus on conserving space.
Additionally, the authors point out a weakness in the protocol design of fixed-interval sampling of switch data. Ideally, any time the FDB data is updated, the xDGA would be made aware of this change. However, this may contribute to significantly increased network overhead, especially in the case of multi-tiered switched networks where a change at a leaf switch can generate cascading messages up through the root of the network architecture. With periodic sampling, however, changes in FDB data may not be picked up by the xDGA quickly enough or at all, depending on the nature of the change. A possible scenario where an attacker could use this to hide in the network is described in detail in Chapter 6.
22
Chapter 3: Network and Attacker Models 3.1 Network Model This section describes the assumptions we make about a network that may be running the TRACK protocol. Some of these assumptions are also made by the xDGA protocol. Each assumption is listed with a detailed description.
1. The network is switched and uses the Ethernet MAC protocol (IEEE 802.3) for wired connections
The Ethernet MAC is well-established and widely deployed, making it an appropriate candidate for link-layer traceback in a LAN environment. In addition, the Ethernet MAC has previously been extended to support additional features such as frame tagging for quality-of-service (QoS) and Virtual LAN (VLAN) support. TRACK uses principles similar to these to support the tagging of frames for link-layer traceback. We require a switched network because a MAC address must be able to be mapped to a specific port. While Ethernet hubs allow a number of devices to be connected through ports, they are strictly broadcast devices. They do not maintain a mapping of MAC addresses to ports.
23
Similarly, any shared-bus technology will not support TRACK since there is no way to map a host to its connection point.
2. The switches are capable of supporting VLAN’s, including execution of the IEEE Multiple Spanning Tree Protocol (MSTP) and frame tagging
While the use of Virtual LAN’s is not required by either the xDGA or TRACK protocols, support for VLAN’s throughout the network implies that the switches support frame tagging and are equipped with hardware fast enough to process these tags. This property, as described above, is used for adding the traceback tag to incoming frames. Additionally, VLAN configuration data and data resulting from the execution of the Rapid Spanning Tree Protocol (RSTP) or Multiple Spanning Tree Protocol (MSTP) is used by TRACK to determine when and how a frame should be tagged. While STP data is not explicitly required for either protocol to function, more efficient operation can be achieved when this data is available.
3. The switches are capable of forwarding frames greater than 1500 Bytes in length
Because the addition of a traceback tag can result in a frame greater than the standard Ethernet MTU of 1500B, the switches involved in forwarding tagged frames must be able to correctly forward slightly larger frames. While operating system settings could be adjusted to reduce the default MTU so that tagged frames in the network do not exceed 1500 Bytes, this type of requirement is impractical. Therefore, all switches involved must be able to forward slightly larger than normal frames. The specific tag requirements are discussed in Chapter 4. Any switch already supporting VLAN’s should be able to 24
handle frames larger than 1500 Bytes, as described in Section 2.2.3. A configuration change by the administrator may be required to enable forwarding of larger frames within the network.
4. The switches support SNMPv3 and appropriate Bridge-MIB data members
To gather forwarding database (FDB) information as well as adjust TRACK parameters, for example to update the key used to generate authentication information, a centralized host must be able to communicate securely with all managed switches in the network. SNMP provides a method for a management entity to communicate with managed devices. Version 3 is required because it is the first version that provides robust security features. Bridge-MIB data members represent some of the data that is used by the TACH to assemble the network topology and allow traceback with the simplified scheme.
5. Traceback executed on a frame bound to or from a wireless host will trace to the nearest access point
6. If a physical host is connected to an unmanaged switch, traceback will execute as far as the switch and port upstream of the unmanaged switch
These two assumptions are functionally equivalent. Generally speaking, an access point and unmanaged switch behave the same with respect to traceback. A wireless host must be connected to the network by way of an access point (AP)3. Traceback will not be able to implicate a single host since any host within radio range of the AP could be spoofing 3
In the case of an Ad Hoc network, one node must act as a bridge between the Ad Hoc network and the Internet. In this case, traceback will implicate the host acting as the Ad Hoc/Other Network bridge or the nearest managed switch to which it is connected.
25
another host. An unmanaged switch or hub behaves similarly to an AP in that any number of hosts may be connected to it. Since the switch is not managed, it does not participate in running the STP, VLAN tagging, or SNMP management operations. In simpler terms, the traceback protocol is unaware that another level of devices exists between the last managed switch and the actual hosts. The protocol can trace a frame only as far back as the first switch over which the network administrator maintains control and that is capable of tagging frames.
7. Traceback will not be executed on frames within the network where both hosts are behind the same router.
When two hosts behind the same router communicate, there is a high likelihood that the frames sent between the two will not be handled by the root switch. TRACK requires that all frames on which traceback is executed pass through the root switch or the link to the edge router, depending on the implementation, for tag collection. If a frame never reaches that point, the tag will never be collected. While intra-network traceback would be possible for frames that passed through the root switch or root TRACK device, it is in general not supported within the rest of the network and therefore it is assumed that this operation will never be requested. The xDGA scheme is not subject to this limitation.
3.2 Attacker Model We make the following assumptions about the zombie machines used by the attacker:
26
8. Any host is capable of spoofing its source IP and MAC addresses and may copy the source address of another host on the network.
We assume that an attacking host is capable of spoofing its source MAC and IP addresses, though we will only discuss spoofed MAC addresses in this section. The malicious host may use a unique MAC address or may intentionally copy the MAC address of another active host. The malicious host may obtain this address through clearly malicious behavior or as part of normal network operation. However, the MAC address of any host that the malicious host interacts with will be revealed. Additionally, if the host is on a network where machines often communicate information about themselves, such as shared resource information, the malicious host will not be required to interact directly with other hosts to collect information.
Depending on the
configuration of the network, the malicious host may also receive broadcast frames such as those sent for ARP queries or DHCP requests.
9. A malicious host is best served by spoofing the source address of another host on the network and will desire to do so.
We further assume that an attacking host will desire to imitate another active host by using its MAC address to attempt to avoid detection by traceback schemes such as xDGA. If the attacker uses a unique address, the problem of traceback is trivial. The FDB within the leaf switch will indicate the port number that the host’s MAC address is connected to. The easiest way for an attacker to hide would be to spoof the address of another host (referred to as the “spoofed host”) on the network. When the malicious host and the spoofed host send frames onto the network, the filtering databases in the switches
27
will reflect only the host that most recently sent data. If the attacker launches an attack by sending a relatively small number of frames, the filtering database information, when collected, may never implicate the malicious host. specifically in Chapter 5.
28
We discuss one such scenario
Chapter 4: Tagged-Frame Traceback (TRACK) Tagged-fRAme tracebaCK (TRACK) is a link-layer traceback protocol for wired Ethernet networks. To provide highly accurate results, TRACK uses frame tagging to map a suspected packet to the switch and port number where it entered the layer-2 subnet, regardless of the original frame’s source MAC address. Frame tagging operations are based on the IEEE 802.1Q and 802.3ac standards, using the VLAN tagging model and configuration information defined by those protocols.
4.1 Protocol Architecture TRACK defines a TraceBack Tag (TBT) that is added to an L2 frame as it passes through a TRACK-enabled device. To facilitate traceback, two processing entities are defined. Within each switch is the TACK Frame Tagger (TFT) that is responsible for applying tags to and removing tags from frames that pass through it. At the network edge nearest the router is the TRACK Analysis and Collection Host (TACH). This host collects frame tags before the frame is passed to the edge router. Frames are stored in a digest table along with the source switch and port number to facilitate traceback operation.
29
4.1.1 TraceBack Tag (TBT) Format The traceback tag is added to a frame by the TFT and collected by the TACH. It allows the traceback host to quickly and easily identify the actual location of the host that sent the frame, regardless of the source address. When a TBT is added to a frame, the contents of the frame are shifted down from the insertion point. The layout of the new frame is shown in Figure 4.1. It is assumed that any network supporting TRACK will also make use of VLAN’s, so the 802.1Q tag is included. IEEE 802.3ac specifies that the 802.1Q tag will appear immediately after the LENGTH/TYPE field. This requirement is preserved. The TBT is inserted immediately after the 802.1Q tag and the rest of the original frame follows. The original LENGTH/TYPE field is set to indicate that an 802.1Q tab and TBT are present. The specific code can not yet be specified since these are defined and approved by the IEEE. However, the value of 0x9004 is currently unused and will be used for the purposes of this thesis. Additionally, the allowed MTU of any ports carrying TBT-tagged frames must be increased from 1522B to 1535B to support the addition of the new tag. Additionally, the M_UNITDATA structure defined
PREAMBLE FRAME START SEQ DESTINATION ADDRESS SOURCE ADDRESS LENGTH/TYPE=tbt tag 802.1Q Tag TRACEBACK TAG (TBT) MAC CLIENT LENGTH/TYPE MAC CLIENT DATA 29-1500 OCTETS PAD 4 OCTETS FRAME CHECK SEQUENCE Figure 4.1 –Ethernet frame layout with 802.1Q and TBT tags 7 OCTETS 1 OCTET 6 OCTETS 6 OCTETS 2 OCTETS 2 OCTETS 13 OCTETS 2 OCTETS
30
for frame representation within bridges by the IEEE 802.1D standard should be modified to include a field for the TBT. We will refer to this field as traceback_tag, in keeping with syntax used in the standard.
The TBT, shown in bold in Figure 4.2, contains the fields used to support traceback operations. These 13 octets (Bytes) are broken into four fields. The first four bits represent the FLAGS field which consists of bits that are used to control traceback operation and data storage, as described in the following paragraph. The next 12 bits, labeled PORT_ID, contain a numeric value representing the port number from which the frame originated. This allows up to 4096 ports per switch. This is the same length used by Hazeyama et al. [3]. The next 8 bits, labeled SWITCH_ID, is used to store the ID of the switch the host is connected to. This field allows a network of up to 256 switches. Together these two fields uniquely identify the location of a host on the wired network. The remaining 80 bits represent the AUTH field and are used to provide authentication for the TBT. The process for generating the AUTH data is discussed in Section 4.3.1.
FLAGS 4 bits
PORT_ID 12 bits
SWITCH_ID 8 bits Figure 4.2 – Traceback Tag (TBT) layout
AUTH 80 bits
The FLAGS field contains three control flags and an additional bit for future use, as shown in Figure 4.3. The Most Significant bit (MSb), bit 7, is the Previously Tagged flag (PREV). A 1 here indicates that a previous tag on the frame was removed and replaced by the current tag. This can indicate either a network malfunction or a malicious host
31
attempting to spoof traceback data, as described in the next section. Under normal operation, this flag should be set to 0. Bit 6 is the Core Switch (CORE) flag. A 1 here indicates that the switch that tagged the frame received the frame untagged on a port designated as an Edge Port. The switch may not be directly connected to the host and the traceback information may not be completely accurate.
This also may indicate an
incorrect network configuration, an equipment failure, or that a malicious host has attempted to circumvent traceback. The FAIL bit is used to indicate an authentication failure and is reserved for use at the TACH. The remaining bit is unused and must be set to 0. The process of adding and removing tags and setting the FLAGS bits is described in Section 4.2
FLAGS PREV bit
CORE
FAIL
(reserved)
7 6 5 4 Figure 4.3 – Traceback Tag (TBT) FLAG field
4.1.2 TRACK Frame Tagger (TFT) Each TRACK-enabled switch in the network contains a TRACK Frame Tagger (TFT). The TFT is responsible for adding a tag to or removing a tag from a given frame. The TFT maintains very little configuration information. In the simplest of implementations this may just be an enable/disable configuration setting. The tagging process is based mostly on which port a frame was received, which port the frame is scheduled to be output on, and the switch configuration. A summary of these parameters is shown in Table 4.1. Since this information is sourced by the forwarding process as defined by IEEE 802.1D, TFT processing should occur as part of this process. Specifically, TFT
32
processing should be executed after the transmission port(s) has been determined but before the frame is actually queued at the port(s) for transmission. Based on the 802.1D and 802.1q standards, selection of transmission port(s) occurs at the Frame Filtering stage of the forwarding process. IEEE 802.1q adds another step, Egress, where frames are actually queued at the transmission ports and before which TFT processing must occur. Specific operation of the TFT process is described in Section 4.2.1.
Parameter Name TRACK Enable TACH_LOC Switch ID4 Port Number Port Map (Static Registration Entries)
Table 4.1 – TFT process parameters Source Range Purpose TRACK True or False Controls whether or not TRACK is enabled at this switch TRACK Port number, (see Section 4.2.2) INTERNAL, INLINE, NONE 802.3 0-255 TBT field 802.3 0-4095 TBT field 802.1q Transmit tagged or Controls whether or not the TBT is Transmit untagged stripped before transmission
4.1.3 TRACK Analysis and Collection Host (TACH) At the edge of the network, the frame tags are collected by the TRACK Analysis and Collection Host (TACH). The frames are stored in a table mapping the frame contents to a switch and port number for later use if the frame is implicated by an IP Traceback request. Because of the computational complexity and increased false positive rate of Bloom filters [25] used in other schemes, the TACH will instead use a simpler structure that does not require multiple hash functions to be computed. The L2 table must provide a quick, efficient method of storing entries and retrieving them later. To support both, the
4
IEEE 802.3 defines a 48-bit MAC address for communicating with each bridge as well as a bridge name (text string). We assume that any LAN will have no more than 255 switches and that the implementer will establish a method of mapping Bridge ID’s to a number in the range of 0-255.
33
L2 table is actually composed of two tables with links defined between the two, as shown in Figure 4.4. These tables are the L2 digest table and the host table.
Host table Switch Port 1 1 1 2 2 3 4 5
Timestamp 1 2 5 6 8 9 12 13 Figure 4.4 – Example L2 table
L2 digest table Flags Digest 0x0 ABCDE123 0x8 ABD3829D 0x4 82E97212 0x0 902DAC29 0x0 82DC2123 0x2 902DCBA2 0x0 02CF3289 0x0 192DC903
The L2 digest table stores frame digests based on the first 32 Bytes of layer-3 data within the frame. This includes the fields of the IP header, masked as described by Snoeren et al. [4], and the first 12 Bytes of payload. These fields are the Type of Service (ToS), TTL, IP Checksum, and the IP Options fields. While a packet is in transit, these fields are or may be modified and inclusion of them in the L2 digest will prevent proper matching of the packet as received by the victim host with the packet as transmitted from the attacking host. The 32-Byte length, according to analysis performed by the same authors, is sufficient to provide a packet collision rate of less than 1 in 10,000 packets in a LAN [4]. The layer 2 data is not included in the digest since it is unlikely that the information will be available when an IP traceback request is issued. The first 32 Bytes, rather than the entire packet, are used for performance reasons [27]. We assume that the victim will be able to provide at least the first 32 Bytes of the suspected packet if a traceback through the implicated subnet is requested. Packet digests, rather than packets themselves, are stored to prevent disclosure of stored client data in the event the TACH
34
becomes compromised. The choice of hash function used is left to the implementer. Each entry in this table also contains a timestamp indicating when the tagged frame was received at the TACH, a field for the TBT flags, and a link back to the record indicating which host sent the frame. Assuming a hash function such as SHA-1 with an output of 160 bit (20 Byte) plus a 32-bit (4 Byte) time signature, an 8-bit FLAGS field5 (1 Byte), and a 16-bit (2 Byte) link field, each L2 digest table entry will occupy 27 Bytes. Assuming a link rate of 100Mbps into the TACH entity, this table would require at most about 405MB of storage space for every minute of digests stored. Assuming an average frame size of 1000 bits, the storage space required is only about 150MB. Based on the storage space available at the TACH, these tables may need to be transferred to long-term storage more or less frequently. The TACH also maintains the time at which the L2 table was last paged out to long-term storage.
The host table maintains an entry for each known switch/port ID combination on the network. Given the limitations imposed by the TBT format, there will be at most 220 (1M) different entries in this table which should be sufficient to represent any LAN despite the use of the 48-bit MAC address. With a host table entry size of 2B, this would require about 2MiB of space to represent. However, the number of hosts on any given LAN is likely to be much lower. Some additional overhead will be incurred to store the links to the entries in the L2 digest table, though the specific value will depend on the link speed supported and the frequency with which the digest table is paged out to longterm storage. A copy of this table should be stored along with the L2 table when it is 5
Though only 3 bits are currently defined, an entire Byte is allocated. This is done to preserve compatibility with the TBT format and allow the extra bit to be used in the future. Additionally, this preserves the Byte-alignment of the data stored in memory.
35
paged out. However, because of the relatively small size of this table and the slightly higher cost of addition, described below, only the L2 table links need to be cleared from the in-memory copy of this table.
To support fast insertions, the host table should be sorted and the L2 digest table left unsorted. Additions to the host table, which should be relatively infrequent, will take longer than a simple unsorted addition, but the time to look up an entry, which is a much more common occurrence, will be greatly improved. L2 entry table additions can simply be added to the end of the table. When an L2 entry is added, an additional link will be placed from the previously existing host table entry to the new L2 digest table entry. The new L2 table entry will have a link back to the existing host record or a new one if one had to be created. If faster traceback is desired, the L2 table may also be stored in a sorted fashion though this may significantly slow down normal processing. If this is desired, the L2 table may be sorted by the long-term storage device when the table is paged out.
Before a frame leaves the subnet, it must either pass through the TACH or be mirrored to it, depending on the implementation. In the former case, the TACH will strip the TBT off the frame as it passes through. In the latter case, the copy of the frame transmitted to the TACH must have the TBT intact. The copy transmitted elsewhere (generally to the edge router) must have the tag stripped and the frame adjusted appropriately. These considerations are discussed in Section 4.4.2.
36
4.2 Protocol Operation This section discusses the operation of the TFT and TACH under normal conditions and when a traceback request is received. We assume that all switches contain a TFT module. We refer to the switch containing the TACH module as the “root” switch since it is located nearest the edge router. Based on the execution of the STP, this switch may or may not actually be the root of any active spanning tree I the network.
4.2.1 TFT Operation As described previously, the TFT will operate as part of the switch forwarding process. It will have available a copy of the frame, as received, and the port(s) on which the frame is scheduled to be transmitted. TFT processing follows the flowchart shown in Figure 4.5. To conserve space, we will refer to ports on which frames are transmitted untagged as “access ports” and ports on which frames are transmitted tagged as “trunk ports.” To determine whether a port is an “access” or “trunk” port, the algorithm checks the static VLAN port map entries. In general, access ports connect switches to end hosts while trunk ports connect switches to other switches or routers. When referring to a single bit as set or cleared, we mean binary 1 or binary 0, respectively. Additionally, we assume that all bits of the FLAGS field of the TBT will be cleared unless otherwise stated. A TBT, when calculated, will always contain the switch ID of the switch processing the tag, the port number of the port on which the frame was received, and an authentication code calculated as described in Section 4.3. In general, frame flow is considered from the host toward the edge router, though the process is the same in either direction.
37
Start Frame arrives from filtering process
Frame is tagged?
YES
Rcv port is “Access Port”
Frame is scheduled for transmission on at least one trunk port.
YES
YES
NO Frame is scheduled for transmission on at least one trunk port.
YES
Rcv port is “Access Port”
NO
YES
Add TBT with CORE=0 PREV=1
NO NO Add TBT with CORE=1 PREV=0
Add TBT with CORE=0 PREV=0
NO Forward frame
Forward frame
For all access ports Strip Traceback TCI Recalculate FCS Forward frame normally
For all trunk ports Forward frame normally
Figure 4.5 – TFT process flowchart
The normal path of execution at a leaf switch – one connected to end hosts – will be that an untagged frame was received on an access port and is scheduled for transmission on one or more trunk ports. In that case, a TBT will be added to the frame with CORE and PREV cleared. If the frame is scheduled for transmission only on other access ports, for example a host sends a frame to another host on the same switch, no TBT will be calculated or added to the frame. If a frame arrives on an access port already tagged and is scheduled for transmission on at least one trunk port, the previous tag is removed. A new tag is calculated with PREV set. If the frame is scheduled for transmission only on access ports, no tag is calculated.
38
The normal path of execution at a core switch – one connected between switches or at the root of the spanning tree closest to the edge router – involves receipt of tagged frames on a trunk port. This operation is somewhat dependant on the implementation and the placement of the TACH. If TACH_LOC is set to a port number, then an unaltered copy of the frame, including the TBT, will be sent to this port. A copy of the frame with the TBT removed will also be transmitted on the scheduled port(s) determined by the forwarding process. If TACH_LOC is set to INLINE, then the frame will be transmitted with the TBT intact on any trunk ports scheduled for transmission. The tag will be stripped before the tag is transmitted on any access ports, though we assume this is a rare case since the root switch should primarily be handling traffic from other switches and the edge router. If TACH_LOC is set to INTERNAL, then the frame will be transmitted untagged on any ports scheduled for transmission. An unaltered copy of the frame will be directed to the internal TACH processor. Some example implementations where this is the case are discussed in Section 4.4.2. If a frame is received at a core switch on a trunk port and is scheduled for transmission on at least one trunk port, a TBT will be added to the frame with CORE set. If the frame is scheduled for transmission on access ports only, no tag will be calculated.
In all cases, no tagged frame will be transmitted on an access port. This is done primarily to prevent malfunction at end hosts that are not designed to handle frames with TBT’s. While disclosing the tag to an end host is not desirable, the protocol is designed such that disclosure will not allow an attacker to imitate an authorized tagging entity.
39
4.2.2 TACH Tag Collection Generally the TACH will operate collecting frame tags as the frames pass through to the edge router. Once the frame is read in, the TACH creates an L2 table entry object with an appropriate timestamp and copies the FLAGS field from the TBT to the new entry. The TACH then calculates the AUTH code for the frame based on the method discussed in Section 4.3. This value is compared to the value in the TBT. If the two match, the FAIL bit in the FLAGS field is cleared. If not, the bit is set. The packet digest is calculated and stored in the new L2 table entry. The entry is then added to the L2 table.
The host table is searched to find the entry corresponding to the Switch ID and Port Number from the TBT. If an entry is found, the link is set from the new L2 table entry to the existing host entry and a link to the L2 table entry is added to the host entry. If no host entry exists, one is inserted in the table, preserving the condition that the table remain sorted, and a link is added from that entry to the L2 entry.
4.2.3 TACH Traceback Request Processing A TRACK traceback request shall consist of at least the 32 Bytes of the suspect packet at the time at which it was received at the victim. An authentication system should be used to ensure that traceback requests are issued only by authorized individuals, though the design of such a system is left to the implementer. If the timestamp on the L2 digest table indicates that the table containing the suspect packet was already paged out, the long-term storage system must be referenced, if it is still available. Otherwise, the TACH will refer to the in-memory table to process the request. The packet digest for the packet received will be calculated as described in Section 4.2.2. The TACH will search the L2
40
table to find the corresponding entry. If one is found, the corresponding host record will be retrieved. Based on the status of the FLAGS bits, the two together will implicate either a specific host or a nearby switch. If FAIL is set, the tag information may or may not be able to be trusted. If the CORE bit is set, the entry most likely implicates a nearby switch, rather than the switch to which the host is directly connected. If PREV is set, the end host most likely attempted to thwart the traceback system by applying its own false traceback tag. Either of these conditions may indicate a malicious host is present and attempting to disrupt the traceback system, though it is more likely that a network device is incorrectly configured or has malfunctioned. Decisions for use and display of this information are left to the implementer. The Switch ID and Port Number from the host table is reported to the user as the host suspected of sending the packet. If an L2 digest table entry is not found for the packet, the previous (paged) table may be checked for the entry using the same process. If an entry is not found in that table, it is likely that the packet did not originate from this network.
In the event of L2 entries with duplicate digest values, the timestamps will be checked. Any entries with timestamps within a preset range of the given timestamp will be returned. The likelihood of duplicated digest values with similar timestamps, however, is assumed to be low since the duplicate frame rate is expected to be about 1 in 10,000. In the event that the TACH returns multiple frames from multiple sources with similar timestamps, it is most likely that multiple attacking hosts sent copies of the same frame toward the destination.
41
4.3 Protocol Security To guarantee authenticity of the TBT, TRACK uses a keyed HMAC to authenticate the frames to which a TBT is applied. To support this, TRACK requires that a key or keys be established between all entities supporting the TRACK protocol. This key may be shared between all entities or separate keys may be established on a pairwise basis. Since the TACH is responsible for verifying authentication information, it should also be responsible for establishing and maintaining keys. If pairwise shared keys are used, a key must be established for each switch that the TACH communicates with. Otherwise, only one key must be established network-wide. While the latter approach is simpler, the entire authentication system will be compromised if only a single switch is compromised.
Either implementation requires establishment of a root key. This key may be randomly generated or may be based on a password established by an administrator. In the latter case, the password should be repeated and the result hashed to generate the key in a method similar to that used by SNMPv3 [12][15]. This process greatly increases the key’s strength against dictionary attacks. If pairwise keys are needed, the process may be repeated to form those keys.
Using SNMPv3’s method, the master key would be
concatenated with the switch ID and the key again. The result would then digested using the same hashing algorithm to generate the switch-specific key. This key will be stored at the TACH, along with the corresponding ID, and distributed to the appropriate switch. In either case, keys will be distributed using SNMPv3 messages with message authentication and encryption as defined by that standard. should the leaf switches be able to compute their own keys.
42
Under no circumstances
4.3.1 AUTH field Calculation and Verification The AUTH field is calculated using a Hashed Message Authentication Code (HMAC), as defined in RFC 2401 [14]. We have assumed that SHA-1 will be used as the underlying hash function. The output of the function, which is 160 bits, is truncated to 80 bits to reduce network overhead. Any hash function may be used as long as the output is truncated to no less than half of the hash result. This is the minimum size to which the output can be truncated before the possibility of birthday attack becomes high enough to make the authentication system ineffective [14]. If a network-wide key is used, the TFT will use that key to generate the HMAC which will then be truncated and stored in the AUTH field of the TBT. The TACH will use the same key and hash function to compute the authentication information to compare to the TBT value. If pairwise shared keys are used, the TFT will use its assigned key to compute the AUTH field data as described previously. The TACH will use the key corresponding to that switch to calculate the authentication. In either case, the data input to the function is at least the first 32 Bytes of the frame, for the reasons described above.
4.4 Implementation Considerations 4.4.1 TRACK Frame Tagger (TFT) The TFT may be implemented in switch software or hardware. It is assumed that the software version will run as part of the switch operating system (OS), issued either as an add-on module or as part of an OS upgrade. In either case, the switch processor will handle frame tagging in addition to normal forwarding and filtering operations.
43
The fastest hardware design would be to include the functionality of the TFT into Application Specific Integrated Circuits (ASIC’s) that currently handle Ethernet frame forwarding and filtering. This is a much costlier option in the long run, though, because any changes to the protocol (or any other protocol supported by the switch) requires a complete hardware upgrade.
The preferred processing option involves a dedicated hardware card or daughter card that can be inserted into a configurable switch chassis. Many enterprise-grade switches are designed so that the switch can be configured to handle a variety of link types, speeds, and port numbers by using an appropriate line card inserted into the switch chassis. Line cards available from the manufacturer are designed to support a specific media type (or types), link speed (or speeds), and number of ports. One example is the architecture employed by the popular Cisco Catalyst line of switches, such as the Catalyst 6500, where QoS processing is handled by a Policy Feature Card (PFC) add-on to the Supervisor module in the switch [28].
The TFT could be designed as a dedicated
hardware card to occupy a chassis slot or a daughter card to be added to another existing module or line card. In the former case, all communications to the TFT would be done through the switch fabric and the implementer must design the hardware to handle communication at a sufficiently high rate. The simulated implementation of this module is discussed in Section 6.1.
4.4.2 TRACK Analysis and Collection Host (TACH) The TACH may be implemented as a standalone device or on a line card that can be inserted into the chassis of the root switch or the edge router. In either case, the device
44
must have a suitably fast connection to the network and an appropriate amount of fast internal storage. Access to external storage is required if the ability to page data out for long-term storage is desired. In any case, some optimizations may be made to the L2 digest and host tables to preserve memory alignment on the TACH if doing so would improve performance.
TRACK provides a configuration parameter TACH_LOC, which is set based on the implementation. When the TACH is internal to the switch itself, the hardware (or software) must be fast enough to process authentication information and store results without causing a bottleneck. In the ideal case, the TACH would be able to perform this process no slower than the outbound link of the switch. Hash functions have been proposed and hardware exists that is able to calculate output in the hundreds-of-Mbps range [29] and Gbps rates [30]. The fastest possible method of getting frames through the TACH would be to have it attached to the switching backplane of either the root switch or the router.
This way, data processed by the TACH does not require an
additional store-and-forward step (network transmission) and optimizations can be made within the hardware itself to support the frame copying and manipulation required if the TACH is not inline between the switch and router. This design may be suitable for a line-card addition for switch chasses supporting such configurations.
In such a
configuration TACH_LOC would be set to INTERNAL.
If separating the TACH from the root switch is desired, a custom hardware device inserted between the switch and router would be recommended.
This would allow
designers to customize the hardware for the specific tasks of HMAC calculation and
45
high-speed storage. Devices are currently available that are capable of processing and inspecting frames at very high speeds on network links [31]. Such a device would operate transparently, accepting tagged frames and forwarding them without the tag. Such a device should be capable of processing frames at line speed so as not to create a bottleneck. In this case, TACH_LOC would be set to EXTERNAL. Such a device should maintain a connection, potentially via a lower-speed link, to an administrative host for long-term storage and control of traceback operations.
Finally, a separate host may be used connected to a mirror port on the root switch. In this case, the switch sends frames for transmission to the device attached to the port indicated by the TACH_LOC setting unaltered. Such a device must be connected to the switch on a link no slower than the link between the switch and the router and must be capable of processing frames at least as fast as the router to prevent data from being lost. The transmission copies of the frames will have the TBT removed and the FCS recalculated appropriately.
46
Chapter 5: Data-Layer Traceback Scheme Comparison 5.1 Traceback Accuracy In this section we present three attack scenarios in detail to compare the operation of Hazeyama et al.’s scheme [3] with TRACK. Both schemes involve a malicious host spoofing its source MAC address and attacking a victim host. A traceback request has previously implicated the malicious host’s network and the appropriate DLT scheme is being run to trace the attacker. In the first case, the malicious host has spoofed a unique MAC address. In the second and third, the host has copied another active host’s MAC address. For this discussion, we assume a simplified topology as shown in Figure 5.1. In the diagram, each switch and port has a numerical ID.
Together a switch/port
combination is represented as SP, e.g. S2P1 for port 1 on switch 2 which is connected to host 11 in the diagram. We further assume that Hazeyama’s scheme is configured to collect data every 5 units of time. These examples can be scaled to any timeframe, though. Additionally, we ignore the false positive cases for both schemes where collisions occur in the internal data structures. These cases are discussed in the next section. At the start of time in each scenario, we assume that the network has
47
been operating, is stable, and the filtering databases (FDB) have learned the host locations as shown, as appropriate for each switch. The aggregate FDB for the initial state is shown in Table 5.1.
P2
Figure 5.1 - Sample network for scheme comparison
Table 5.1 – Aggregate FDB for the initial case Switch MAC Address Port 1 11 1 1 12 1 1 10 2 1 13 3 1 14 3 2 11 1 2 12 2 3 13 1 3 14 2
The first scenario timeline is shown in Figure 5.2. Time starts counting when the FDB data is first collected. At time unit 1, host 11 begins communicating with a host located in a different network. At time 2, host 13 begins to transmit frames using a spoofed
48
source MAC address of 15. The filtering databases in switches 3 and 1 will be updated to reflect the addition of the new MAC address. When the FDB data is collected again at time 5, the data will show that the host with MAC address 15 is located at switch 3, port 2, as shown in Table 5.2. When a traceback request is received, xDGA inspect its L2 digest table and when it finds the entry for the suspect packet, will correctly indicate that the host at switch 3, port 2 sent the frame. Similarly, TRACK will inspect the L2 tables at the TACH and retrieve the entry for the host that sent the frame which is indicated as being located at switch 3, port 2. Both protocols have functioned correctly in this case.
Figure 5.2 – Attack timeline for scenario 1
Table 5.2 – Aggregate FDB data for scenario 1, time t+5 (new entries are shown in bold) Switch 1 1 1 1 1 1 2 2 3 3 3
MAC Address 11 12 10 13 14 15 11 12 13 14 15
49
Port 1 1 2 3 3 3 1 2 1 2 2
The second scenario involves a malicious host that has spoofed the MAC address of a legitimate host on the same switch. The timeline for this is shown in Figure 5.3. As before, time begins counting when the FDB data is first collected. At time unit 1, host 11 begins communicating with another host outside this network. At time unit 2, host 12 sends a malicious packet to a host in another network using a spoofed source MAC address to imitate host 11. The new port number for MAC 11 will be learned by the FDB at switch 2, as shown in Table 5.3. Meanwhile host 11 continues to send frames as part of its previously established session with the other host. To simplify discussion, we assume that host 11 remains silent between time units 2 and 3. At time unit 3, the host will send data again, causing the FDB at switch 2 to be updated as shown in Table 5.4, which is the same as the initial FDB. When the FDB is queried again at time unit 5, it appear to the xDGA host as shown in Table 5.4. The change that occurred at time t+2 will never be picked up by the xDGA.
Because of this, all records covering the
timeframe t to t+5 will implicate host 11 on S2P1 as the host that sent the malicious frame. TRACK, however, has tagged every frame in the network so when the traceback request is received, the digest computed by the TACH will map back to a switch/port entry that was not dependant on the host’s MAC address at the time the frame was sent.
Figure 5.3 – Attack timeline for scenario 2
50
Table 5.4 – Aggregate FDB data for scenario 2, time t+5 (updated entries are shown in bold)
Table 5.3 – Aggregate FDB data for scenario 2, time t+2 (updated entries are shown in bold) Switch 1 1 1 1 1 2 2 3 3
MAC Address 11 12 10 13 14 11 12 13 14
Switch 1 1 1 1 1 2 2 3 3
Port 1 1 2 3 3 2 2 1 2
MAC Address 11 12 10 13 14 11 12 13 14
Port 1 1 2 3 3 1 2 1 2
The third scenario considers the case where a malicious host spoofs the MAC address of a host on a switch other than its own. This behavior causes multiple cascading FDB updates and may result in very inconsistent data between the switches. Since the xDGA description does not specifically account for multi-tier switched networks, we will assume best-case operation. The timeline for this attack is shown in Figure 5.4. Time begins counting when the FDB data is first collected, 1 time unit after which host 11 begins its session. At time unit 2, host 14 spoofs its source address, imitating host 11, and sends a malicious packet to a host in another network. This causes an entry for MAC 11 at S3P2 to be added to the FDB at switch 3. The FDB at switch 1 will be updated to show MAC 11 as having been learned on S1P3. The resulting FDB data is shown in Table 5.5. At time unit 3, host 11’s data stream resumes and the FDB data is altered again. Since switch 2 already knows the location of MAC 11 and its port number does not change, no updates occur at that switch. The FDB record at switch 1, however, must be updated to show the new location as S1P1, the same location as before at time unit 1.
51
No change occurs at switch 3. The resulting data is shown in Table 5.6. This data is identical to the data from the initial state except for the entry for MAC 11 at switch 3. We assume that in the best case, xDGA would recognize that this “host” has no connection back to the edge router and did not exist in a previous FDB-sampling round, so a malicious node was probably present on S3P2. However, such a condition may occur in a network operating normally where a user moves a machine from one port to another that happen to be on different switches. xDGA may implicate the host on S2P1, which is incorrect. TRACK, however, would have tagged all frames regardless of MAC address and be able to map the packet digest back to the sending host. Since xDGA operation is not defined for this case, we cannot confirm whether or not it would implicate the correct host.
Time
t
t+1
t+2
t+3
FDB data is collected
Host 11 begins a session with a host on the Internet
Host 14 sends a malicious packet out using a source MAC address of 11. The FDB at switch 3 adds a record for MAC 11 at S3P2. The FDB at switch 1 updates the record for MAC 11 at S1P3.
Host 11 continues to send frames as part of the session established. The FDB at switch 1 updates the record for MAC 11 at S1P1
Figure 5.4 – Attack timeline for scenario 3
52
t+5
FDB data is collected
Table 5.5 – Aggregate FDB data for scenario 3, time t+2 (new and updated entries are shown in bold) Switch 1 1 1 1 1 2 2 3 3 3
MAC Address 11 12 10 13 14 11 12 13 14 11
Table 5.6 – Aggregate FDB data for scenario 2, time t+5 (updated entries are shown in bold)
Port 3 1 2 3 3 1 2 1 2 2
Switch 1 1 1 1 1 2 2 3 3 3
MAC Address 11 12 10 13 14 11 12 13 14 11
Port 1 1 2 3 3 1 2 1 2 2
5.2 False Positives The primary source of false positives in the xDGA scheme is a result of using the spacesaving Bloom filters. The authors have tuned the filter used for a false positive rate of 0.092, or just under 1 in every 10 frames. This is due to collisions within the filter itself. False positive rates due to duplicate frames or incorrect FDB data are not given, though the latter may be of great concern especially in the cases described in the previous section.
TRACK relies neither on Bloom filters nor periodically-sampled FDB data, thus eliminating most causes of false positives. False positives may still result, though, due to collisions in the L2 storage table, especially if the results of the digest function are truncated to conserve space. The output of the selected hash function should be evenly distributed over the output space and collisions should occur very rarely. The likelihood of an input collision was given as less than 1 in 10,000 packets. The likelihood of an output collision should be roughly the same, unless the output space is significantly
53
smaller than the input space.
If we assume that there are 10,000 different input
combinations (between 213 and 214) and that the digest output is truncated to no less than half its original length, the output space will have between 264 and 280 combinations for truncated MD5 and SHA-1 hash functions, respectively. The truncation restriction is based on RFC2401, as discussed in Section 4.3.2. Collisions in a hash output are still very unlikely. It is more likely that a collision will occur on the input, causing duplicate entries to be inserted into the L2 digest table. Entries with the same digest value should have different timestamps in the table and these will be used to determine which result is correct. If they have similar timestamps, for example if multiple zombies sent the same packet, all results with that digest and timestamp (or close range of timestamps) will be returned. In any case, all hosts having sent the packet will be implicated by TRACK.
54
Chapter 6: Simulation To test the effects of TFT processing on network performance, a version of the TFT was implemented in OpNET [32].
A simple network was created with many hosts
communicating with a single server.
Due to the simulation complexity and time
constraints, neither the TACH entity nor the actual traceback process were simulated. However, the impact of the TACH on network operation should be minimal provided the implementation considerations discussed above are followed. Also, previous discussion has shown that the false positive rate for TRACK should be very, very low. The primary concern is the delay caused by the TFT processing in the switches.
The simulation network makes use of redundant links and VLAN’s. The VLAN’s are all statically configured. Each port has a default VLAN ID configured to ensure that all frames originating from end hosts are tagged with the appropriate VLAN. Each end host and the server are connected by access links. All links between switches are configured as trunk links supporting all VLAN ID’s. Redundant links are managed by the MSTP described previously. All communications in the network are unicast between the clients and the server. To simulate the traffic load through the root switch, the server is located behind the root switch. The simulation network is shown in Figure 6.1. Each host has a
55
unique ID comprised of its VLAN ID and a unique ID within the VLAN. For example, host 13 is actually host 3 in VLAN 1. All links are 100Mbps.
Server
Root Switch SW_1 SW_2 SW_3
`
SW_4
10 ` `
20
`
30 11
`
` 12
34
` `
13
SW_5
` 14
`
` 21
`
`
31
22
23
`
33
32
` 24
Figure 6.1 – Simulation network
Four different scenarios are considered.
The baseline case has TRACK disabled.
Standard Ethernet frames are used and transmitted with the VLAN tags per the network configuration (VLAN tags on trunk links).
The remaining three test network
performance with TRACK enabled. They use the larger frame size as described above and test three different delay values. The “fast” TFT implementation is set to require 9.25µs to tag a frame. This represents a dedicated hardware implementation [33], though
56
faster ones are available [30]. The “medium”-speed scenario uses a processing time of 34.83µs. This is the time required for a PIII-927MHz to calculate an HMAC based on the MD5 algorithm [21] and may represent the amount of time required for a software implementation. The longest delay specified was 143µs for the “slow” mode, which is scaled from the previous value, assuming a 200MHz embedded processor.
Three different traffic class configurations are simulated. In the first class, all nodes are using the “HTTP Browsing (Heavy)” class which simulates a user browsing a series of web pages (relatively small files), each with an average of 5 images (relatively large files) where page and images loads tend to be grouped together. This represents the “light” network load. The second class replaces four of the web-browsing hosts with “Multimedia” users. Each of these users issues requests to an FTP server for a 7MB file every 5 minutes while continuing to browse the web. This represents the “medium” network load. The third class, for the “heavy” network load has 12 “Multimedia” users and 3 “HTTP Browsing” users.
Each simulation scenario is run three times, each with a different seed value, and the results are averaged for display in this section. Results are grouped by the network traffic class. The simulation scenarios are summarized in Table 6.1. The simulated time is 3 hours and the first half-hour of results are filtered to allow the network to reach a steady state after initialization.
57
Table 6.1 – Summary of simulation scenarios # Traffic TRACK mode 1 Light Disabled 2 Light Slow 3 Light Medium 4 Light Fast 5 Medium Disabled 6 Medium Slow 7 Medium Medium 8 Medium Fast 9 Heavy Disabled 10 Heavy Slow 11 Heavy Medium 12 Heavy Fast
6.1 TFT Module Implementation The TFT module was implemented as part of the MAC Relay Entity (MRE), which is invoked by the switch module used by OpNET to model the forwarding and learning processes. The delay caused by TFT processing is modeled using a fixed-length delay added to the packet service time in the model. The delay is only added in the case where a switch calculates a frame tag and adds it to the frame.
The frame format for IEEE Ethernet v2 was modified to support the TBT. When a frame is untagged, no space is allocated in the frame for the tag so the model becomes equivalent to the original Ethernet v2 frame model. When space for the TBT is allocated in the frame, the simulated frame size on the wire will increase appropriately. This allows accurate modeling of the network overhead increase that will occur. Parameters are provided to enable or disable TRACK and set the HMAC calculation delay.
OpNET does not provide a queue for the receive portion of the MAC transceiver. This queue would ordinarily hold packets as they are waiting to be processed by the MRE. In 58
the simulation, as soon as a frame arrives it is placed in the packet input queue of the MRE. By default, the MRE queue is able to hold an infinite number of packets. Left alone, this would lead to inaccurate results, especially for simulation metric 4. To simulate the limited receive buffer on most networking equipment, we have set the MRE size to be (number of active ports) * (average receive queue per port). The latter value is an average based on the receive queue sizes in line cards available for the Cisco products discussed earlier [28].
Depending on the card implementation, between 16KB and
166KB is available on the receive side of a port. On average, 56KB (about 459,000 bits) is available per port. Each switch on the network had no more than 5 active ports and so the values used were 2293760 bits and, assuming an average packet size of 1000 bits, 2290 packets. Transmit-side queues were left at infinite size. Finally, the switches were set with a packet forwarding rate of 500,000 packets per second. This is on par with some enterprise-grade equipment, though far lower than other devices which may be capable of switching frames on the order of 12-15 million per second [28].
6.2 Simulation Metrics To evaluate the effects of TRACK on network performance, the following metrics are considered. A total of 1000 data points are collected for each statistic during each simulation run.
This equates to a sampling period of 10.8 seconds for the values
observed.
59
1. Ethernet delay
Ethernet delay is a measure of the amount of time a frame spends queued at a given Ethernet entity. The total Ethernet delay, which is a reflection of the total time frames spent queued or being forwarded through the Ethernet network, is considered. This does not include processing delay at the host or server – only layer-2 delay is considered. This metric will be impacted both by the TFT processing time which increases queuing delay, but also by the increased frame size which increases the forwarding delay, though by a much lower amount.
2. Average packet queue length, Mac Relay Entity
The average queue length shows the number of packets, on average, waiting to be processed by the Mac Relay Entity (MRE) in the switch. Since the TFT is part of the MRE, the average number of frames waiting to be serviced by the MRE is expected to increase due to the increased time frames will spend in the forwarding process. The queue length is an important metric since once the queue fills, frames must be dropped (see next metric). It is desirable to keep the queue length as low as possible. If, under normal usage, the queues stay over halfway full major problems will occur during highusage periods. The ideal operational case is that TRACK does not significantly increase the average queue size and never causes it to go above half-full during normal operation.
60
3. Dropped frames
When the queues fill up, frames must be dropped – either upon receipt or from the queue to make room for the new frame. Neither case is desirable since this behavior causes problems at higher layers.
This may cause application or protocol retransmission
mechanisms to activate which could make the problem even worse at layer 2. The number of dropped frames should remain as close to 0 as possible. TRACK operation should not increase the number of dropped frames. At no point during any of the simulations did the switch queues become full. Therefore no frames were dropped for any scenario.
4. Application Throughput
In the best case, the change in layer-2 protocol is transparent to the higher layers – no decrease in throughput is observed, no packets are lost, and no retransmissions are necessary. However, with an increase in network delay and the potential for dropped frames, a decrease in application throughput is inevitable. This metric measures the relative difference in average Bytes/sec transmitted to the host from the server in response to an application request, such as a web page or image via HTTP, or file via FTP. Results are averaged across all runs of a given scenario.
6.3 Ethernet Delay The Ethernet delay for the lightly-loaded network is shown in Figures 6.2-6.5. As expected, the Ethernet delay increases as the TRACK processing time increases.
61
Additionally, the histograms show that the delays experienced become less correlated as the processing time increases. In scenarios 1 and 2, the delay is distributed relatively tightly around 176µs and 187µs, respectively. In scenario 3, the main peak, centered around 257µs, spreads indicating that the average delay is becoming less correlated. Finally, when the TRACK delay reaches the 143µs level for scenario 4, the delay is very widely spread around a center point of about 597µs.
The results show a delay of
161.3±12.3µs for the baseline case. Fast and medium-speed TRACK processing raises the delay to 181.3±31.3µs and 235.5±197µs, respectively.
Using the slowest
implementation TRACK raises the delay to 575.2±288.9µs.
The graphs also show that delay tends to be grouped into one or more peaks. The first peak generally represents the delay experienced by a frame that arrives at a switch whose MRE queue is empty. The second peak represents the delay for a frame arriving at a queue that already has a frame, and so on. The larger second peak indicates that a frame is more likely to be queued when it arrives at a switch rather than being immediately forwarded.
The larger variation in Ethernet delay values as TRACK processing delay is increased is due mostly to effects of TRACK processing on interpacket arrival times which causes the queuing behavior at the switches to change. As the processing delay increases, packets are more likely to spend time waiting in a queue to be processed – the right-hand side of the peak – but may also be more likely to arrive at an empty queue in a switch if they were held up at an upstream device – the left-hand side of the peak. Some frames will unfortunately be subject to being queued, perhaps far back in line, at every switch, which
62
further contributes to the rightward spread of the data. While an increase in delay is not desirable, the increase in variance may prove to be more problematic, especially for applications that require strict quality-of-service maximum delay enforcement.
It is
significantly easier to guarantee a delay below a certain bound with the fast TRACK implementation than with the slow TRACK implementation, as can be observed from the figures.
200 175
Samples (count)
150 125 100 75 50 25 0 0.0000
0.0002
0.0004 Delay (sec)
0.0006
0.0008
Figure 6.2 – Ethernet delay for the light-load network, TRACK disabled
63
200 175
Samples (count)
150 125 100 75 50 25 0 0.0000
0.0002
0.0004 Delay (sec)
0.0006
0.0008
Figure 6.3 – Ethernet delay for the light-load network, fast TRACK
200 175
Samples (count)
150 125 100 75 50 25 0 0.0000
0.0002
0.0004 Delay (sec)
0.0006
0.0008
Figure 6.4 – Ethernet delay for the light-load network, medium TRACK
64
200 175
Samples (count)
150 125 100 75 50 25 0 0.0000
0.0002
0.0004 Delay (sec)
0.0006
0.0008
Figure 6.5 – Ethernet delay for the light-load network, slow TRACK
Figures 6.6-6.9 show the delay distribution for the medium-load network. Unlike in the previous scenarios, the delay distribution does not shrink or grow as the TRACK delay increases. Rather, it tends to shift right as TRACK delay increases, with the distribution staying more or less the same. This indicates that the delay is increasing, as expected, without a corresponding increase in delay variation.
As before, the various peaks
observed correspond to the different queue lengths experienced. A third peak is much more prominent in these charts indicating that a given frame will be subject to more queuing delay than in the previous scenarios. However, the delay is still dominated by the second peak. The prominence of the three narrow, tall peaks versus either “noise” or flatter, wider peaks as in the previous scenarios indicates that the queuing delay strongly dominates the overall delay experienced by a frame.
65
With TRACK disabled, frames are subject to an average delay of 191.3±6.7µs delay. The fastest TRACK implementation raises the delay to 202.2±13.3µs, an increase of about 5%. The medium-speed implementation raises the delay to 224.0±113.5µs, up about 16%. The greatest increase, 75.76%, occurs with the slow TRACK implementation which causes the delay to be raised to 424.6±166.7µs. The relative delay increases experienced for these scenarios are significantly lower than the increases experienced for the lightly-loaded network. This is due to the fact that the baseline delay is much higher already. As expected, the absolute delay values are higher in all cases.
200 175
Samples (count)
150 125 100 75 50 25 0 0.0000
0.0004
0.0007 Delay (sec)
0.0011
0.0014
Figure 6.6 – Ethernet delay for the medium-load network, TRACK disabled
66
200 175
Samples (count)
150 125 100 75 50 25 0 0.0000
0.0004
0.0007 Delay (sec)
0.0011
0.0014
Figure 6.7 – Ethernet delay for the medium-load network, fast TRACK
200 175
Samples (count)
150 125 100 75 50 25 0 0.0000
0.0004
0.0007 Delay (sec)
0.0011
0.0014
Figure 6.8 – Ethernet delay for the medium-load network, medium TRACK
67
200 175
Samples (count)
150 125 100 75 50 25 0 0.0000
0.0004
0.0007 Delay (sec)
0.0011
0.0014
Figure 6.9 – Ethernet delay for the medium-load network, slow TRACK
Results for Ethernet delay in the heavily-loaded network are shown in Figures 6.10-6.13. These figures show the same three’s grouping behavior experienced in all scenarios up to this point. They also show more activity toward the right-hand side, visible as “noise” to the right of the primary peaks. The results appear almost identical to those obtained for the medium-load network in structure, but they are shifted right and the right-most peak is noticeably higher, indicating an overall higher delay caused, in part, by increased frequency of third delay value (represented by the right-most peak). The right-hand shift, as compared to the previous figures, is partially obscured by the change in horizontal axis scaling.
The results show an average delay of 221.0±10.9µs for the baseline case. Enabling the fast TRACK implementation causes this to increase to 229.9±32.7µs, an increase of about 68
4%. The medium-speed implementation causes the delay to increase to 241.9±15.2µs, an increase of about 9%. As expected, the maximum delay increase is experienced with the slow implementation of TRACK which resulted in a delay of 456.5±84.2µs, an increase of 70%.
200 175
Samples (count)
150 125 100 75 50 25 0 0.0000
0.0003
0.0007 0.0010 Delay (sec)
0.0014
0.0017
Figure 6.10 – Ethernet delay for the heavy-load network, TRACK disabled
69
200 175
Samples (count)
150 125 100 75 50 25 0 0.0000
0.0003
0.0007 0.0010 Delay (sec)
0.0014
0.0017
Figure 6.11 – Ethernet delay for the heavy-load network, fast TRACK
200 175
Samples (count)
150 125 100 75 50 25 0 0.0000
0.0003
0.0007 0.0010 Delay (sec)
0.0014
0.0017
Figure 6.12 – Ethernet delay for the heavy-load network, medium TRACK
70
200 175
Samples (count)
150 125 100 75 50 25 0 0.0000
0.0003
0.0007 0.0010 Delay (sec)
0.0014
0.0017
Figure 6.13 – Ethernet delay for the heavy-load network, slow TRACK
6.4 MAC Relay Entity (MRE) Queue Length The MRE Queue length for the lightly-loaded network is shown in Figures 6.14-6.17. As in the previous section, the queue length is shown using histograms. The right-hand shift in the distribution indicates that the average queue length grows with the TRACK processing delay. The graphs indicate the presence of “fractional” packets due to the sampling nature of this metric. The grouping of data into three’s corresponds to the maximum queue length observed in these scenarios. The spacing and growth in width of the peaks reflects the increase in queuing delay brought about by the increase in processing time. However, the nearly-empty queue dominates each result set, though less so as the delay increases. The three’s grouping is completely obscured in Figure 6.14 and
71
partially in Figure 6.15 due the lack of available resolution for display, set to keep the graph scales consistent.
The results show that the queue contained, on average, 6.87x10⁻⁷ frames per sampling period. Fast and medium TRACK increased the average queue lengths to 1.82x10⁻⁵ and 5.84x10⁻⁵, respectively. As expected, the largest increase occurred with slow TRACK with an average queue length of 3.77x10⁻⁴ frames per period.
TRACK processing
resulted in queue size increases of 139%, 195%, and 199% for the fast, medium, and slow implementations, respectively. At no point did the queue become full, and so no frames were dropped.
400 350
Samples (count)
300 250 200 150 100 50 0 0.0000
0.0005 0.0010 0.0015 Queue Length (packets/period)
0.0020
Figure 6.14 – MRE queue length for the light-load network, TRACK disabled
72
400 350
Samples (count)
300 250 200 150 100 50 0 0.0000
0.0005 0.0010 0.0015 Queue Length (packets/period)
0.0020
Figure 6.15 – MRE queue length for the light-load network, fast TRACK
400 350
Samples (count)
300 250 200 150 100 50 0 0.0000
0.0005 0.0010 0.0015 Queue Length (packets/period)
0.0020
Figure 6.16 – MRE queue length for the light-load network, medium TRACK
73
400 350
Samples (count)
300 250 200 150 100 50 0 0.0000
0.0005 0.0010 0.0015 Queue Length (packets/period)
0.0020
Figure 6.17 – MRE queue length for the light-load network, slow TRACK
Figures 6.18-6.21 show the MRE queue length for the medium-load network. As with the previous charts, the limited resolution partially obscures the results for scenario 5 (Figure 6.18, the first in this group). However, it can be seen that as the TRACK delay increases, the average queue length increases as indicated by the right-hand shift of the histograms.
That shift is accompanied by growth – stretching right – and overall
flattening of the resulting graph indicating that the queue lengths are spread more evenly over the interval between minimum and maximum queue size. The grouping effect can be observed in the result data, though it is difficult to see in the graphs provided here. Overall, the queue lengths were higher for the medium-load network when compared to the lightly-loaded network, as expected. However, the percent increase in average queue length caused by TRACK was nearly identical.
74
The results show that the baseline case had an average queue length of 1.20x10⁻⁴ frames per sampling period. That increased to 1.67x10⁻³ frames when fast TRACK was enabled. It further increased to 4.60x10⁻³ with medium-speed TRACK and finally to 6.02x10⁻² for the slowest implementation of TRACK. These values represent increases of about 139%, 179%, and 195% over the baseline case.
5
Samples (count)
4
3
2
1
0 0.0
1.0
2.0 3.0 Queue Length (packets/period)
4.0
5.0
Figure 6.18 – MRE queue length for the medium-load network, TRACK disabled
75
5
Samples (count)
4
3
2
1
0 0.0
1.0
2.0 3.0 Queue Length (packets/period)
4.0
5.0
Figure 6.19 – MRE queue length for the medium-load network, fast TRACK
5
Samples (count)
4
3
2
1
0 0.0
1.0
2.0 3.0 Queue Length (packets/period)
4.0
5.0
Figure 6.20 – MRE queue length for the medium-load network, medium TRACK
76
5
Samples (count)
4
3
2
1
0 0.0
1.0
2.0 3.0 Queue Length (packets/period)
4.0
5.0
Figure 6.21 – MRE queue length for the medium-load network, slow TRACK
Results for the high-load network are shown in Figures 6.22-6.25. These show results approximately double those obtained for scenarios 5-8.
This is expected since the
number of “multimedia” users is doubled for the heavily-loaded network. Note that the vertical scales on the graphs have been doubled for Figures 6.22-6.25 to show additional detail in the baseline and fast TRACK cases.
The queue length values are approximately double the same scenario value from the medium-load network with the percent increases being nearly the same. For the baseline case, the average queue size was 2.20x10⁻⁴ packets per sampling period.
For fast,
medium, and slow track, the average queue sizes were 3.41x10⁻³, 8.93x10⁻², and 8.35x10⁻² packets per period, respectively.
77
10
Samples (count)
8
6
4
2
0 0.0
1.0
2.0 3.0 Queue Length (packets/period)
4.0
5.0
Figure 6.22 – MRE queue length for the heavy-load network, TRACK disabled
10
Samples (count)
8
6
4
2
0 0.0
1.0
2.0 3.0 Queue Length (packets/period)
4.0
Figure 6.23 – MRE queue length for the heavy-load network, fast TRACK
78
5.0
10
Samples (count)
8
6
4
2
0 0.0
1.0
2.0 3.0 Queue Length (packets/period)
4.0
5.0
Figure 6.24 – MRE queue length for the heavy-load network, medium TRACK
10
Samples (count)
8
6
4
2
0 0.0
1.0
2.0 3.0 Queue Length (packets/period)
4.0
Figure 6.25 – MRE queue length for the heavy-load network, slow TRACK
79
5.0
6.5 Application Throughput The relative application throughput is shown in Figure 6.26. TRACK state is shown on the horizontal-axis and relative performance on the vertical axis.
All values are
normalized to the TRACK disabled value for that network traffic class, with a 95% confidence interval shown.
The figure shows that the performance impact on
applications for the lightly-loaded network is minimal. The average number of Bytes/sec dropped to no less than 99% of the baseline value when TRACK was enabled. In the medium-load network, the greatest performance drop observed was to no less than 97% of the baseline value. For the high-load network the worst drop was to 93.3% of the baseline value. In all scenarios, the worst performance drop occurred when the slow implementation of TRACK was enabled. This is expected since the previous results have shown it to have the highest performance impact on the network. These results show that the impact of TRACK on higher layers is minimal for the considered scenarios.
80
1.2
Application Performance (Bytes/sec delivered)
1 0.8 0.6 0.4 Load: Light Load: Medium Load: Heavy
0.2 0 Off
Fast Medium TRACK Implementation Speed
Figure 6.26 – Application performance for all scenarios
81
Slow
Chapter 7: Future Work While TRACK provides a reliable DLT mechanism, it contributes to increased network transmission and processing overhead. The primary problem identified with xDGA was that the FDB’s at the switches could become out of sync with the data stored on the xDGA [3]. The authors describe this problem in their paper and TRACK was created partly in response to this problem. In the DLT scheme, the event of greatest importance is that a MAC address location is learned. If the network is fairly static, this event does not occur very often and, perhaps, occurs most often when an attacker has spoofed the MAC address of an existing host. For this reason, it is only necessary to tag frames that cause the FDB at any switch to be updated. Under normal conditions, this occurs relatively infrequently. For frames that are untagged, the TACH will use its knowledge of the network topology to map the MAC address to a switch and port. This knowledge is based on previously received frame tags as well as administratively programmed settings and/or data gathered from the RSTP/MSTP algorithm execution. This data may be gathered by using SNMP to query the switches and retrieve the appropriate BridgeMIB objects. However, the network topology may change on-the-fly due to execution of the RSTP/MSTP and/or failure of a link or switch. In this case, many FDB changes will occur on core switches and the TACH must be aware of the new topology to interpret the
82
new tags correctly. This dynamic protocol should be investigated further since it could allow significant overhead reduction while maintaining the accuracy of the proposed TRACK protocol.
Additionally, the simulation framework should be improved further.
Currently, no
simulation of the TACH entity or its position on the network has been performed. Also, no collection of data occurs so the false positive rate of the protocol cannot be determined experimentally. Ideally, the simulator would be able to collect and store the L2 table (host and digest tables) as described and run mock traceback requests against them.
83
Chapter 8: Conclusions Data-Link layer Traceback (DLT) is an important and under-researched problem. This step is important to completing the attack path analysis which would otherwise be missing the critical step between the zombie network edge and the zombies themselves. This thesis has presented TRACK, a solution to the DLT problem for wired Ethernet networks. TRACK allows a single packet to be traced back to the switch and port number of the host that sent it. TRACK uses frame tagging to support the DLT operation regardless of the source MAC address used to transmit the frame. It improves upon the reliability of the only other DLT scheme published to date by avoiding the indirect mapping achieved when using FDB information.
TRACK’s operation is based on
principles established by widely accepted and implemented protocols, and TRACK additionally leverages existing standards and protocols to control tagging and collecting operations. Simulation results have shown that TRACK does not significantly impact network application performance.
84
Bibliography [1]
J. Mirkovic, P. Reiher, “A Taxonomy of DDoS attack and DDoS Defense Mechanisms,” ACM SIGCOMM Computer Communication Review, vol. 34, iss. 2. pp. 39-53. April 2004.
[2]
E. Skoudis and T. Liston, Counter Hack Reloaded, 2nd ed. Pearson Education, Inc., 2006. pp. 518-523.
[3]
H. Hazeyama, M. OE, and Y. Kadobayashi, “A Layer-2 Extension to Hash-Based IP Traceback” in IEICE Transactions on Information & Systems. pp. 1-9. Vol. E86-D, No. 11, November 2003.
[4]
A. Snoeren, C. Partridge, L. Sanchez, C. Jones, F. Tchakountio, S. Kent, and W. Strayer, “Hash-Based IP Traceback” in Proceedings of the xth ACM Special Interest Group on Data Communication (SIGCOMM’01) Conference.
pp 3-14.
San Diego, CA, August 2001. [5]
IEEE Std. 802.3, “Carrier sense multiple access with collision detection (CSMA/CD) access method and physical layer specifications.” 2002.
[6]
IEEE EtherType Registration Authority, http://standards.ieee.org/regauth/ethertype/index.shtml.
[7]
IEEE Std. 802.1D, “IEEE Standard for Local and Metropolitan Area Networks: Media Access Control (MAC) Bridges.” February 2004.
85
[8]
IEEE Std. 802.1Q, “Virtual Bridged Local Area Networks.” 2005.
[9]
IEEE Std. 802.1ac, “Frame Extensions for Virtual Bridged Local Area Network (VLAN) Tagging on 802.3 Networks.” 1998.
[10]
D. Mauro and K. Schmidt. Essential SNMP, 2nd Edition. O’Reilly, 2005.
[11]
J. Case, M. Fedor, M. Schoffstall, J. Davin, “A Simple Network Management Protocol,” Internet RFC 1157, May 1990. http://www.ietf.org/rfc/rfc1157.txt.
[12]
W. Stallings, “SNMPv3: A Security Enhancement for SNMP,” IEEE 1998. http://www.comsoc.org/livepubs/surveys/public/4q98issue/stallings.html.
[13]
U. Blumenthal, B. Wijnen, “User-Based Security Model (USM) for version 3 of the Simple Network Management Protocol (SNMPv3),” Internet RFC 2274, January 1998. http://www.faqs.org/rfcs/rfc2274.html
[14]
H. Krawczyk, M. Bellare, R. Canetti, “HMAC: Keyed-hashing for message authentication,” Internet RFC 2401, February 1997.
[15]
U. Blumenthal, N. Hein, B. Wijnen, “Key Derivation for Network Management Applications,” IEEE Network, May/June 1997.
[16]
M. Rose, K. McCloghrie, “Structure and Identification of Management Information for TCP/IP-based Internets,” Internet RFC 1155, May 1990. http://www.faqs.org/rfcs/rfc1155.
[17]
K. McCloghrie, D. Perkins, J. Schoenwaelder, “Structure of Management Information Version 2 (SMIv2),” Internet RFC 2578, April 1999. http://www.faqs.org/rfcs/rfc2578.
[18]
U. Blumenthal, B. Wijnen, “User-based Security Model (USM) for version 3 of the Simple Network Management Protocol (SNMPv3),” Internet RFC 3414, December 2002. http://www.faqs.org/rfcs/rfc3414.
86
[19]
E. Decker, P. Langille, A. Rijsinghani, K. McCloghrie, “Definitions of Managed Objects for Bridges,” Internet RFC 1493, July 1993. http://www.faqs.org/rfcs/rfc1493.html.
[20]
S. Savage, D. Wetherall, A. Karlin, and T. Anderson, “Practical Network Support for IP Traceback” in Proceedings of the 2000 ACM Special Interest Group on Data Communications (SIGCOMM’00) Conference. pp. 295-306. Stockholm, Sweeden, August 2000.
[21]
D. Song and A. Perrig, “Advanced and Authenticated Marking Schemes for IP Traceback”
in
Proceedings
of
the
2001
Conference
on
Computer
Communications (INFOCOM’01). pp. 878-886. 2001. [22]
H. Burch and B. Cheswick, “Tracing Anonymous Packets to Their Approximate Source” in Proceedings of the 14th annual USENIX Large Installation System Administration Conference. New Orleans, December 2000.
[23]
W. T. Strayer, C. E. Jones, B. I. Schwartz, J. Mikkelson, C. Livadas, “Architecture for multi-stage network attack traceback,” in Proceedings of the 30th Anniversary IEEE Conference on Local Computer Networks. pp. 15-17. November 2005.
[24]
T. He, L. Tong, “Detecting Encrypted Interactive Stepping-Stone Connections,” in Proceedings of the 2006 IEEE International Conference on Acoustics, Speed and Signal Processing (ICASSP). pp. 816-819, May 2006.
[25]
B. H. Bloom, “Space/time tradeoffs in hash coding with allowable errors” in Communications of the ACM. pp. 422-426. Vol. 13, No. 7, July 1970.
[26]
X. Wang, D. Reeves, “Robust Correlation of Encrypted Attack Traffic Through Stepping Stones by Manipulation of Interpacket Delays” in CCS’03, pp. ??-??. Washington, D.C., October 2003.
[27]
O. Elkeelany, M. M. Matalgah, K. P. Sheikh, M. Thaker, G. Chaudhry, D. Medhi, J. Qaddour, “Performance Analysis of IPSec Protocol: encryption and 87
authentication” in Proceedings of the 2002 IEEE International Conference on Communictions, pp 1164-1168, 2002. [28]
C. Solder, “Understanding Quality of Service on the Catalyst 6500 and Cisco 7600 Router.” Cisco Systems. Revision 4.04, June 2006.
[29]
T. Grembowski, R. Lien, K. Gaj, N. Nguyen, P. Bellows, J. Flidr, T. Lehman, B. Schott, “Comparitive Analysis of the Hardware Implementations of Hash Functions SHA-1 and SHA-512,” in Information Security.
Springer-Verlag,
Berlin, 2002. pp 75-89. [30]
L. Dadda, M. Macchetti, J. Owen, “The design of a high speed ASIC unit for the hash function SHA-256 (384, 512),” in Proceedings of the 2004 Design, Automation and Test in Europe Conference and Exhibition. pp. 70-75. February, 2004.
[31]
“TippingPoint IPS Technical Specifications.” Austin, TX.
TippingPoint Technologies,
November, 2006. http://www.tippingpoint.com/pdf/resources
/datasheets/400918-004_ipstechspecs.pdf [32]
OpNET Modeler. http://www.opnet.com/products/modeler/home-2.html.
[33]
N. Sklavos and O. Koufopavlou, “On the Hardware Implementations of the SHA2 (256, 384, 512) Hash Functions,” in Proceedings of the 2003 International Symposium on Circuits and Systems. pp. V-153-V-156. May 2003.
88
Vita Michael Snow was born in Richmond, VA on July 2nd 1982. He graduated from The Collegiate School in August of 2000 and enrolled in Virginia Polytechnic Institute and State University that fall. He graduated Magna Cum Laude in May of 2004 with his Bachelor of Science degree in Computer Engineering with minors in Computer Science and Mathematics.
He was a student member of the IEEE and Microsoft Student
Developer Organization as an undergraduate.
In August 2004, he began his graduate work at Virginia Tech. In the spring of 2005, he joined the ARIAS (Advanced Research in Information Assurance and Security) lab and began performing research under the direction of Dr. Jung-Min Park.
89