Rochester, NY 14618
CULTURAL AUDIT PROJECT SURVEY ON CAMPUS CLIMATE: RACE AND ETHNICITY
FINAL REPORT Cultural Audit Steering Committee *Carmen Aponte, Independent Consultant, SUNY Brockport Cassandra Camille, Higher Education Opportunity Programs, SJFC Dennis Crowley, Office of the Registrar, SJFC *Sharon Delmendo, Assistant Professor of English, SJFC Paul English, Director of Campus Ministries, SJFC *Jean Maley, Coordinator of Assessment and Research, SJFC Dan Murphy, Alumni of Color, SJFC *Arlette Miller Smith, Dean of Diversity Programs, SJFC Clarence Norman, Director of Opportunity Programs, SJFC Jennifer Vallee, School of Adult and Graduate Education, SJFC
*Implementation Committee
Basil 115 (585) 385-8378 or (585) 385-8212
1
CULTURAL AUDIT PROJECT FINAL REPORT Table of Contents I.
Project Summary………………………………………………………
3-4
II.
Cultural Audit Project A. History……………………………………………………………… B. In Search of a Best-Fit Cultural Audit Model…………………… C. Methodology………………………………………………………. Development of Survey Instrument…………………………. Administration of Survey ……………………………………... Sample/Response Rate………………………………………. D. Results……………………………………………………………… Demographics……………………………………………………… Comfort Level Indices……………………………………………...
5-6 7-8 9-10 9 10 10 11-13 11 12-13
E. Recommendations for Retooling…………………………………. Index I……………………………………………………………. Index II…………………………………………………………… Index III………………………………………………………….. Index IV………………………………………………………….. F. Major Findings and Discussion…………………………………… Index I……………………………………………………………. Index II…………………………………………………………… Index III………………………………………………………….. Index IV………………………………………………………….. G. Which diversity issues (besides race and ethnicity) are most important? Students’ Responses…………………………………….
14-17 14-15 15-16 16-17 17-18 18-36 18-23 23-27 28-31 32-35 36
III.
References……………………………………………………………… 37
IV.
Appendices…………………………………………………………….. 38-47 Appendix A Survey Instrument…………………………………... 39-42 Appendix B Tables on Index by Race/Ethnicity and Gender… 43-46 B1. Index I by Race/Ethnicity and Gender…………………. 43 B2. Index II by Race/Ethnicity and Gender………………… 44 B3. Index III by Race/Ethnicity and Gender……………….. 45 B4. Index IV by Race/Ethnicity and Gender……………….. 46 Appendix C Courses/ Workshops/ Seminars on Race and Ethnicity Attended Since September/98…………………………………… 47
2
PROJECT SUMMARY
Most educational institutions have responded to the environmental demand for valuing diversity. St. John Fisher College, as most institutions, articulates its values and goals for diversity through its Mission Statement and more uniquely, through its Fisher Creed. Additional challenges faced by most institutions’ strategic planning, however, are how to implement and assess diversity beyond their mission statements. In essence, the job market demands that colleges and universities produce a culturally competent workforce for the 21st century, while accrediting and licensing bodies also seek accountability. The St. John Fisher Cultural Audit Project (CAP) was developed to address the aforementioned environmental demands as well as to address the 1996 Alumni of Color Committee’s request for exploring the campus racial and ethnic climate. Thus, the purpose of the Cultural Audit Project was to create a baseline study of racial/ethnic diversity issues from the perspective of both majority (white, nonHispanic) and minority students. While diversity extends beyond racial/ ethnic groups, this report only summarizes the process and results of the first segment of the Cultural Audit Project. Other aspects (i.e. religious affiliation, sexual orientation, gender, age, and ableism) will be audited at a later date. In Spring 1999, 711 undergraduate students were assessed using the Campus Climate: Race and Ethnicity instrument. The CAP instrument consisted of 29 items rated on a 5-point Likert scale. Items were categorized under four Comfort Level Indexes (CLI) [I: Comfort Level with Racial/Ethnic Differences; II: Comfort Level with Social Environment; III: Comfort Level with Academic Environment; Index IV: Comfort Level with Organizational Environment] with the intent to assess student’s perceptions to race/ethnic relations and campus climate issues. CAP Results revealed students felt the least comfortable with their peers’ (CLI II) and their own personal views (CLI I) on diversity. Overall, all four CLI s indicate the need for further growth in awareness and development to ideally achieve scores of 4.5 – 5 on the 5-point Likert scale. More specifically, students of color (especially females) felt greater comfort with themselves and their beliefs about diversity; (CLI I) however they were uncomfortable with their social environment (CLI II). Majority (white) students felt greater comfort with the academic and organizational environments (CLI I & II). Most white male students, however, felt discomfort with themselves and their beliefs about diversity (CLI I).
3
Results from the CAP led the independent consultant to make the following recommendations for improving the future campus racial/ethnic climate at St. John Fisher College: § § § § § §
Increase students’ awareness on diversity for attitudinal change Increase linkages between academic programs and the world of work Reduce the level of social isolation experienced by most female students of color Increase faculty awareness regarding their role in carrying out the college’s mission for diversity (i.e. the diversity disseminators) Revise retention/recruitment strategies for staff, faculty and students of color Increase top administrators and staff presence at campus and the broader communities’ cultural events
4
We seek to overcome prejudice, including that occasioned by gender, race, age, religion, region, culture, disability, sexual orientation, or economic status. We see human diversity as positive, and we work together to set an example of tolerance and openness. By encouraging tolerance and appreciation of diversity, we help our students become useful citizens of a multicultural world ... (St. John Fisher College Mission Statement: “Emphasis on Community”) Diversity of cultural backgrounds, personal characteristics, and life situations, all of which we value for their contribution to our community (The Fisher Creed)
History The St. John Fisher College Mission Statement and the Fisher Creed1 declare "Diversity" as one of the College's central goals. Fisher is not alone among American colleges and universities (e.g., Cornell, University of Rochester) in it’s explicit claim to valuing diversity. However, at Fisher and around the country there is a large discrepancy between this stated value of diversity for the campus community and the reality of a campus climate that reflects this in its ideal form. A long-term topic of discussion among the Alumni of Color (AoC) Committee has been similar experiences of Fisher's "chilly climate" and subtle (and sometimes not so subtle) racial discrimination. It’s not just an issue for today's students, the AoC stated, but a historic issue stretching from the time Fisher first began admitting women and students of color. The persistence of these discussions over time makes issues of covert and overt discrimination systemic and institutional, rather than incidental and interpersonal. Despite anecdotal stories of Fisher's unfavorable climate for diversity, there has been no official historical record of such a problem. Moreover, the many current studies of Fisher students' experiences and satisfaction with the College do not substantively address diversity issues. The Cultural Audit seeks to address the aforementioned issues and respond to a direct request from the 1996 AoC Committee. Specifically, the purpose of the Cultural Audit is to create a baseline study of diversity issues from the perspective of both majority (white, non-Hispanic) and minority students. While diversity extends beyond racial/ethnic groups, the AoC and the Campus Diversity Council decided that the first segment of the Audit would focus on racial/ethnic diversity issues. The specific focus on race/ethnicity does not minimize the significance of diversity issues pertaining to religious affiliation, sexual orientation, gender, or 1
In 1996, the Fisher Creed was developed by students as a statement of goals of the college community.
5
ableism. However, to encompass the diversity issues of all groups in one specific assessment attempt would not ensure a valid and reliable audit. The development and gathering of quantitative data (i.e. survey instrument) and qualitative data (i.e. focus groups) would result in a cumbersome and lengthy task. In regard to these methodological issues, it was proposed that a) the first stage of the cultural audit would focus on racial/ethnic diversity issues; and, b) students’ input for prioritizing and directing the Audit's subsequent foci on other diversity groups will be solicited through the survey. For the purpose of this cultural audit, the following terms were defined: Race – a subgroup of people possessing a definite combination of characteristics, genetic origin, the combination of which, to varying degrees, distinguishes one sub-group from other groups. Ethnicity – membership in a group of people who share a unique social or cultural heritage that is passed on from generation to generation.
6
In Search of a Best-Fit Cultural Audit Model Corporate America has spearheaded most cultural audits of today. Simply stated, outcome measures are easily assessed through the numbers of its diversified workforce and business profits. The not-for-profit arena quickly followed the path of corporate America and established its own benchmark by creating standards and guidelines for cultural competence performance measures. Corporations and human service organizations invest heavily in the retraining of their workforce and organizational restructuring in response to higher education inability to produce a culturally competent workforce. The gap between higher education and the world of work continues to widen as colleges and universities lag behind in implementing diversity beyond their mission statements. Much more challenging is the need to operationalize diversity for strategic planning, curriculum development, and educational outcome measures in lieu of meeting the diversity standards of licensing, certification, and accrediting bodies. More challenging is how to instill the value for diversity, how to disseminate the knowledge for attitudinal change and skill development, and therefore how to produce a cultural competent student body for the 21st century. Recognizing the aforementioned challenges in higher education, the members of the Alumni of Color and the Diversity Council sought several local professional assessment/consulting firms to assist with the Cultural Audit Project (CAP). The lack of a cultural audit model in higher education became more evident as these consulting firms spoke on behalf of their assessment experience pertaining to the corporate world, and to a lesser degree, pre-college educational organizations. Both the AoC and the Diversity Council considered neither assessment experiences similar enough to the undergraduate college environment. In addition, these firms were prohibitively expensive and therefore, not cost effective. Instead, an outside academician with assessment experience in the field of human services was approached and accepted to serve as a consultant to the Cultural Audit Project2.
2
Carmen Aponte, Ph.D. is an Assistant Professor at SUNY College at Brockport. She teaches Cultural Diversity and Research in the Dept. of Social Work. She also served as the main investigator for the Western New York Office of Mental Health "Self-Assessment Cultural Competence" assessment project, and served as a steering committee member for the development of the ‘Cultural Competence Performance Measures for Managed Behavioral Healthcare Programs’ (a federally funded project).
7
Understanding that any existing model for cultural audits in higher education are still in their infant/developmental stages, the following factors were discussed as key elements needed to be in place prior to designing &/or implementing the audit:
8
Key Elements
Demonstrated
Commitment from the top/administrative level
Leadership role, support and involvement of the Provost and the Associate Dean from the Office of Diversity Programs
Diversity as a goal for strategic planning
Embedded within mission statement Plans for a Cultural Audit
Understanding/Embracin g Diversity as an empowering tool for the 21st century
Consultant delivered a workshop on the role of academia in the cultural competence movement to campus wide staff, faculty and students; Diversity series delivered continuously to the campus community
Resource Allocation
Financial support in place for covering CAP costs/expenses (i.e. meetings, materials, presentations, etc.); Non-monetary support identified: statistician, researchers, and recognize through merit those that committed their time and knowledge to the Cultural Audit Project
Inclusiveness (No cultural audit can be achieved without the commitment & involvement of its constituents)
Plans in place for involving faculty, staff, students, AoC, etc. with the CAP assessment process. A participatory approach (shared responsibility) would provide a sense of ‘weness’ and ownership that seldom is achieved through the use of external evaluators
Layers of Diversity
The CAP should adhere to a long-standing developmental model that incorporates at all levels (students, faculty, curriculum, administration, policy, etc.) diversity issues (i.e. diversified groups, etc.). Clearly stated, the Survey on Campus Climate: Race and Ethnicity will assess students’ perceptions (one level) on race/ethnic diversity (one issue) and will constitute one phase of the CAP.
Knowledge Building
The assessment tool and the assessment process will serve as a model for others.
Dissemination of Findings
The creation of a written report accessible on the internet; presentation to the campus, &/or conferences.
9
Methodology Development of Survey Instrument The Diversity Council Cultural Audit Steering Committee developed the Survey on Campus Climate: Race and Ethnicity, during the 1998-99 academic year. Two undergraduate college surveys were used as models for the construction of a 29-item instrument (University of Maryland; Jacksonville State University, Alabama). Any selected model questions/items were adapted to fit Fisher's environment. Other questions/items were added in order to cover a broad range of diversity contexts that were eventually categorized into four major "Comfort Level Indexes" (see section on Comfort Level Indexes). In addition to the demographic questions/items, the following question was added to gain more students’ input, insight and directions for the future development of the CAP: The CAP committee is interested in other diversity issues at Fisher: gender, sexual orientation, religious affiliation, ableism, ageism. In your opinion, which of these are the most important? Please comment on your answer. The survey instrument was not tested for validity and reliability3. Nor was information made available regarding the validity & reliability of the undergraduate college survey models used. Time factor created further constraints and limitations to the total number of items that could possibly be constructed. As noted under the following section (Administration of Survey), in order to achieve the maximum return rate, faculty cooperation and classroom time was needed. Therefore, the development of the survey tool was intentionally limited to the number of items (approximately 30) that would consume the least amount of classroom time (i.e. 15 minutes).
3
The lack of scientific testing for item construct should not inhibit the utility of this survey instrument, nor should it be seen as a major weakness. The lack of such empirical evidence in previous models used, only supports further the preliminary stages of most campuses’ cultural audits. In addition, the effectiveness of the traditional pure research mode has been challenged elsewhere in the field of multiculturalism for measuring and assessing the complexity of racial/ethnic diversity issues. Embedded within the multicultural framework is the principle that diversity is everyone’s responsibility and assessment goals cannot be achieved otherwise. The participatory approached used for the development of this instrument serves to reflect this principle. Yet, the current goal for multicultural researchers is to move further into scientific empiricism with the few tools available as well as not lose sight of the subject nature of diversity. In summary, in spite of its limitations, the survey tool developed for the CAP constitutes a benchmark and can prove fruitful to those campuses that are still struggling with the previous century’s environmental demands for diversity and accountability/assessment.
10
Administration of Survey The survey was administered by faculty in 50 of the 70 designated classes on campus during the week of April 5, 1999. The following three class times were chosen: 1) Monday, Wednesday and Friday at 11:15 a.m.; 2) Tuesday and Thursday at 11:00 a.m.; and 3) Tuesday at 6:15 p.m.. These time periods were deliberately selected since approximately 70 classes met during these times and included a total of approximately 1650 enrolled students. In order to ensure confidentiality, anonymity and privacy, students were instructed in writing to not include any identifying information on the form (See Appendix A).
Sample/Response Rate A total of 766 surveys were completed. An actual response rate was difficult to account for since many students were enrolled in more than one of the designated classes. However, as noted in the Registrar’s Report for Spring 1999, 2338 students were enrolled in credit courses, consisting of 1919 undergraduates (1382 full-time and 537 part-time) and 365 graduate students. Based on these figures, it is safe to report that 33% of enrolled students completed the survey. Since the purpose of the CAP was geared to undergraduate students, out of the 766 respondents, 711 classified themselves as matriculated undergraduates. Therefore the sample represented 38% of the 1871 matriculated undergraduate students taking courses at the College in Spring 1999.
11
Results Demographics Demographic characteristics of the survey respondents were quite similar to the matriculated undergraduate student population in Spring 1999 (see Table I). The percentage of females among respondents was somewhat higher at 66% compared to 60%; the percentage of resident students was also somewhat higher at 45% compared to 41%. The most noticeable discrepancy appears in the percentage of full-time versus part-time students where 91% of the respondents reported being full-time whereas 77% of the population was fulltime. In summary, the majority of the respondents were female (65.5 %), fulltime (91.2%), commuters (55.2%) and white non-Hispanic (84.6%). Table 1. Characteristics of Respondents: Matriculated Undergraduates Survey Respondents Population Spring 1999 Gender: Female 65.5% 60.1% Male 35.5% 39.9% Housing Status: Commuter Resident Student
55.2% 44.8%
59.4% 40.6%
Enrollment Status: Full-time Part-time
91.2% 8.8%
77.1% 22.9%
Class: Freshmen Sophomore Junior Senior
21.4% 18.6% 30.2% 29.8%
18.4% 19.0% 29.9% 32.7%
0.1%
0.1%
1.9% 5.6% 4.6% 84.6% 3.2%
1.6% 5.2% 3.6% 85.6% 3.9%
Race/Ethnicity* Native American Asian American / Pacific Islander Black Non-Hispanic Hispanic White Non-Hispanic Other
* The descriptors used in the survey and given here differ from those used in the Registrar’s Report
12
Comfort Level Indices The instrument ‘Survey on Campus Climate: Race and Ethnicity’ intends to operationalize the campus diversity concerns regarding race & ethnicity. It is a self-assessment process where students examine their own perspectives on diversity. The survey contains 29 items that reflect racial diversity issues and concerns. Comfort Level Indexes (CLI) were developed after the construction of the instrument as an effort to summarize, in a meaningful way, the results of the survey. As a qualitative judgment (content/face validity), various acknowledge experts 4 were used to create the CLIs. Their opinions were summarized and presented to the steering committee. The steering committee further refined the CLIs as a subscale or index in the following areas: Index I:
Comfort Level with Racial/Ethnic Differences - 7 items that refer to one’s personal level, experience &/or personal preference for diversity. Comfort level with self and beliefs for diversity are of central focus.
Index II:
Comfort Level with Social Environment - 6 items that concern how the student views other students pertaining to racial/ethnic issues.
Index III:
Comfort Level with Academic Environment - 6 items that concerns the student’s views on racial factors pertaining to classroom environment, faculty and curriculum matters.
Index IV:
Comfort Level with Organizational Environment - 8 items in reference to students’ perception of the campus organizational and administrative climate. Items also refer to services and staff practices (i.e. student treated with respect).
In summary, each CLI consists of items that imply student’s perceptions to race/ethnic relations and campus climate issues. Any findings and recommendations are based on the mean score derived from each item on a five point Likert scale where the higher the score, the more positive the response (i.e. 1 = lowest rating to 5 = highest rating; 1 = strongly disagree, 2 = disagree, 3 = neutral, 4 = agree, 5 = strongly agree). Reversed items are indicated by a @ symbol where “disagree = a positive response” and agree = negative response”. 4
Christian Itin, Ph.D., Assist. Professor, Greater Rochester Collaborative MSW Program, SUNY Metro Center, Rochester, NY; • Michael Sullivan, MSW, and Ph.D. Student at University of Buffalo; • Charles C. Smith, MA, Chief of Jordan Behavioral Health Services, Rochester, NY, and a cultural competence consultant
13
Average mean scores per level (subscale means) are based on the total sample. Recommendations are based on those items above and below the subscale mean score (strength: as priority areas for intervention and/or issues to be addressed) (See section on Major Findings & Discussions). After reviewing item and subscale scores, the campus establishes priorities as to which items and levels are more important than others. Campus leadership can then identify a prospective training resource, convene a specific training intervention, and at some subsequent time re-assess how the campus climate has improved. Any training/development activities can be configured to meet the general and specific needs of all groups As a reminder, it is through the comparison of the campus’ mean score that the principle of the assessment/audit process takes place. The results are not meant as a rating scheme that compares one campus, student or groups to the other, but rather a self-assessment process whereby practices, knowledge, and content of the campus climate itself constitute the comparative features. Index (Subscale) Means 5 4
3.34
3
3.22
3.69
3.59
2 1 Index I
Index II Index III Index IV Comfort Levels
Table 2 SUBSCALE MEAN SCORES Index I: Comfort Level with Racial/Ethnic Differences Index II: Comfort Level with Social Environment Index III: Comfort Level with Academic Environment Index IV: Comfort Level with Organizational Environment
3.34 3.22 3.69 3.59
In general, students scored the highest on Indexes III & IV, therefore, feeling more comfortable with the academic and organizational environments. Lowest scored Indexes II and I indicate that students felt the least comfortable with their peers’ and their own personal views on diversity. Overall, all four CLIs indicate the need for further growth in awareness and development to ideally achieve scores of 4.5 – 5 on the 5-point Likert scale.
14
RECOMMENDATIONS FOR RETOOLING Results from this Cultural Audit Project led steering committee members to make several recommendations for improving the future campus racial/ethnic climate at St. John Fisher College. The following are their recommendations for retooling by specific Comfort Level Indices. Index I:
Comfort Level with Racial/Ethnic Differences – To increase the students’ personal level, experience &/or personal preference for diversity. Comfort level with self and beliefs for diversity are of central focus.
•
To increase students’ awareness on diversity in academics and its relationship to careers/the world of work. To reduce the level of resistance that students tend to have on taking courses related to race and ethnicity: o The connection between academics and the social external environment must be reinforced through the students’ academic major. o Academic programs will need to develop stronger linkages with the world of work. § Members of the community advisory board(s) should extend their advisement role. § Invite representatives from local corporations, human services agencies, educational/school systems, etc., as guest lecturers in class to provide information to increase student awareness.
•
To develop programs for creating attitudinal change, especially for white male students. o To include the campus’ vision on diversity as part of incoming freshman’s orientation package. o To enhance the role of residential staff through diversity training and conflict resolution (i.e., managing diversity in students’ living environment): § Special sessions/programs for promoting diversity held in residence halls
•
To increase the numbers of racial/ethnic students for increasing race/ ethnic social interactions and communications on campus: o Recruitment of more racial/ethnic minority students. • Revise the current techniques and strategies employed for recruiting minority students. • More awareness and training for admission officers for recruiting more students of color • Develop more outreach and linkages with the ethnic community: churches, formal and informal ethnic community agencies, inner city schools, post-secondary schools (i.e. Educational Opportunity Center), local community colleges, etc.
15
•
Index II:
Revise marketing strategies currently employed: Brochures, commercial/media coverage, billboard advertisements, etc. must be presented in other languages, use minority personnel as models, and strategically placed in the ethnic community via the current minority media source.
Comfort Level with Social Environment – To increase how the student views other students pertaining to racial/ethnic issues.
•
To consider students’ comfort level with their social environment an area of major concern.
•
To increase students’ knowledge and awareness of what constitutes racial tension and the importance of acknowledging its existence. o More dialogue needed for achieving a better understanding of what constitutes racial tension in order to reduce the opposing perceptions held between the white students and students of color.
•
To increase the students’ comfort level with the social environment, especially for female students of color. The degree of social isolated experienced by most female students of color must constitute an area of major concern. o To develop culturally relevant strategies for reaching out to students of color, especially geared to females of color who are at higher risk of social isolation. § Increase linkages with the ethnic community for identifying informal resources for mentoring and support § Increase linkages with other students of color in near-by campuses
•
To increase counselors/ academic advisors knowledge and skills for working with those students victimized by direct/indirect discrimination. o How racial discrimination impacts academic achievement and sense of social belonging o How to incorporate the ethnic minority identity developmental model as a framework for assessment and practice o How to develop a non-traditional approach for service delivery o Increase knowledge and linkages with ethnic minority services and resources (formal and informal) for consultation and/or referrals.
•
To create a directory of the list of formal and informal ethnic community resources, services, leaders and professionals in the Rochester area.
•
To increase the sharing of information of the attrition rate based on race and gender.
•
To increase the number of mentoring/supportive programs through grant writing efforts.
16
o To become more familiar with the Roger McNair, the Rochester TRIO Consortium of Student Support Services Program, etc. already in place in some colleges of the Greater Rochester Area. •
To develop standard policies and guidelines for the newspaper: o Increase the faculty/staff advisement role in the development of the student’s newspaper. o Develop a section dedicated only to racial/ethnic events & issues. o Develop a diversity training program geared to those students directly involved with the newspaper § How to outreach to minority students for their input. § How to ensure unbiased language
•
To develop leadership skills among racial/ethnic diverse students in order to constructively channel their concerns/issues for the betterment of the campus social climate. o Increase linkages with local community leadership programs (i.e. the United Way, etc.)
Index III:
Comfort Level with Academic Environment – To increase student’s views on racial factors pertaining to classroom environment, faculty and curriculum matters.
•
To increase faculty awareness regarding their role in carrying out the college’s mission for diversity (i.e. the diversity disseminators)
•
More training/faculty development for increasing faculty awareness regarding how their teaching styles impact directly/indirectly students of color comfort level with the academic climate. Training/development must focus on: o How not to assume that students of color are the best resources for discussing racial issues in class. o How to instill equal participation in classroom activities – Faculty need to gain more sensitivity/awareness and knowledge of the various learning styles pertinent to ethnic groups o How to appropriately incorporate examples of people of color (minority issues) in their lectures. o How to manage racial tension within the classroom (i.e. managing diversity within the classroom).
•
Increase Departments/Educational programs commitment for diversity and accountability of their educational outcomes by ensuring that courses do integrate minority content across their curriculum. o Most certification/licensing programs (i.e. nursing) can serve as an internal resource for providing leadership and guidance to other departments.
17
o
Index IV:
More discussion during faculty/staff regarding diversity issues in classroom and course content for sharing best practices. Comfort Level with Organizational Environment – To increase students’ perception of the campus organizational and administrative climate. Also, organizational environment includes services and staff practices (i.e. student treated with respect).
•
To increase the numbers of racial/ethnic diverse administrators, faculty, and staff.
•
Review the current recruitment and retention strategies and hiring policies in order to ensure nondiscriminatory practices.
•
To develop a strategic plan for designing goals, objectives and activities for recruitment/retention: o Increase knowledge and understanding of those effective practices utilized at local corporations and other institutions through training o Increase minority initiatives by incorporating a reward system (i.e. add new lines) those programs that do seek out minority faculty and staff. o Ensure mentoring of junior faculty, administrator and staff of color
•
In order to promote multicultural understanding, the mission for diversity must parallel the mission for technology o Enhance the ‘Office of Diversity Programs’ as an integral (rather than an add on) administrative unit within the organizational structure. § Increase administrative, resource and manpower support. § Evaluation/assessment and dissemination of diversity program goals and functions for a better understanding from the campus community. Therefore, more input needed from the campus community, especially from the community of color, with the revision of program goals and activities. § Increase campus-wide participation and commitment to extracurricular activities, especially those pertaining to multicultural events. • Increase faculty implementation of strategies for fostering participation (i.e. offer extra credits, require attendance and use events as topics for developing racial/ethnic dialogue in the classroom; etc.) • Ensure a stronger presenc • • • e from top administrators and staff at campus cultural events as well as at social activities held by the outside ethnic community at large. Such presence will be felt by
18
students and others and perceived as a true organizational commitment for diversity.
19
MAJOR FINDINGS & DISCUSSION INDEX I:
Comfort Level with Racial/Ethnic Differences - 7 items that refer to students’ personal level, experience &/or personal preference for diversity. Comfort level with self and beliefs for diversity are of central focus.
Comfort Level with Racial/Ethnic Differences Q1:
Q3: Q10: Q14: Q15:
Q16: Q19:
• @
My experiences since coming to Fisher have led me to become more understanding of racial/ethnic differences. My social interactions on this campus are largely confined to students of my race/ethnicity I prefer having an instructor of my own race/ ethnicity. Racial discrimination is no longer a major problem in America. At Fisher, I feel comfortable being in situations where I am the only person of my racial/ethnic background. At Fisher I feel comfortable saying what I think about racial/ethnic issues. Fisher should have a graduation requirement that students take at least one course on the role of ethnicity and race in society. SUBSCALE MEAN SCORE
General Population *3.31
*2.76@ 3.47@ 4.24@ *3.13
*3.30 *3.16
3.34
Items falling below the mean Reversed items, 1 = strongly agree … 5 = strongly disagree
General data findings indicate that students’ perception regarding their level of comfort with their personal beliefs on diversity averaged second to the lowest compared to the other three index means. Once gender and ethnicity was considered, the lowest mean score was found for the white male sector (x = 3.11), while the highest mean score was found among females of color (x = 3.6). More students of color, especially females tend to have a higher comfort level with race/ethnic differences than their counterparts especially white males. Items with scores above the mean: •
Racial discrimination is no longer a major problem in America (Q. 14) – reversed item: Constituting the highest mean score for this index (x = 4.24), students in general tend to disagree with the statement, therefore indicating a strong belief that racial discrimination is still a major problem. This level of awareness was more indicative for females/males of color (x = 4.63 and
20
4.53, respectively) as compared to white females (x = 4.25) and white males (x= 4.06). •
I prefer having an instructor of my own race/ethnicity (Q. 10) – reversed item: Students in general tend to disagree with this statement (x = 3.47), therefore appearing quite comfortable with instructors racially/ethnically different than self. A higher indicator for not agreeing with this item was noted for white females (x = 3.61), compared to white males (x = 3.27), females of color (x = 3.26), and males of color (x = 3.00). There is a tendency for males of color preferring an instructor of their own race/ethnicity than any other of the aforementioned groups.
Items with scores below the mean: •
My social interactions on this campus are largely confined to students of my race/ethnicity (Q. 3) – reversed item: Students in general tend to agree that their social interactions are largely confined to students of their own race/ethnicity (x = 2.76;). However, this perception was more apparent for white males and females (x = 2.44 and 2.75, respectively). An opposite trend was found for students of color where females (x = 3.44) and males (x = 3.39) tend to disagree that their social interactions are confined to their own racial/ethnic kind. This data finding clearly indicates that the predominantly white student body, especially the white male sector, tends to interact less with racial/ethnic students, suggesting some degree of discomfort.
•
At Fisher, I feel comfortable being in situations where I am the only person of my racial/ethnic background (Q. 15): A neutral stand was apparent regarding students feeling comfortable in situations where they are the only person in a setting that is not of their own racial/ethnic kind (x = 3.13). Such neutral stand was also indicative of females of color (x = 3.04). A higher degree of comfort was indicative for both males of color and white female students (x = 3.22 for both groups). Any level of this discomfort was noted only for white male students (x = 2.93).
•
Fisher should have a graduation requirement that students take at least one course on the role of ethnicity and race in society (Q. 19): Similar to the previous findings (Q. 15), a neutral position was indicative of how students felt regarding having to take at least one race and ethnic course as a graduation requirement (x = 3.16). Females of color were noted to be the most in favor (x = 3.87); males of color (x = 3.78) as second; while white females (x = 3.25) ranked third. On the other hand, white males tended to disagree with taking a required course on race & ethnicity (x = 2.65), achieving the lowest mean score.
21
•
At Fisher I feel comfortable saying what I think about racial/ethnic issues (Q. 16): Students are less, yet still neutral about feeling comfortable saying what they think regarding racial/ethnic issues (x = 3.30). A higher level of comfort was noted among students of color, especially males (x = 3.78; females of color x = 3.62). A lower mean score was found with the white students, where females (x = 3.27) felt less comfortable than students of color, yet more comfortable than their male counterpart (x = 3.15). As the data indicate, although in the neutral range, white males tend to feel the least comfortable stating their thoughts about racial/ethnic issues on campus.
•
My experiences since coming to Fisher have led me to become more understanding of racial/ethnic differences (Q. 1): Although this item (x = 3.31) scored slightly below that of the sample (X = 3.34), students continue to feel ‘neutral’ about their college experience leading them to become more understanding of racial/ethnic differences. Females of color scored more towards the neutral range (x = 3.02) and the lowest than any of the other subgroups. Although a more positive experience was indicative of males than females of color, no major differences were found between white males and males of color (x = 3.24 and 3.23, respectively). White female students, on the other hand, scored the highest (x = 3.43), tending to agree more than any other group that Fisher has made them more understanding of racial/ethnic differences.
Discussion and Recommendations for Index I: Strength: Students in general are very much aware of racial discrimination as a social problem/issue in America (Q. 14). Areas for further development: •
Students still need to develop more awareness regarding how their coursework (Q. 19) and academic experience will provide them with tools for dealing with such a historical social problem. The connection between academics and the external social environment must be reinforced through the students’ academic major. Students need to understand how racial discrimination is manifested in the world of work. In order to reduce the level of resistance that students tend to have on taking courses related to race and ethnicity, more information from the world of work will be needed. Academic programs will need to develop stronger linkages with the world of work. Members of the community advisory board(s) should extend their advisement role. Proactively, they, as well as others (i.e.
22
human resources), can serve as guest lecturers in class and provide the information needed to increase students’ awareness. As noted in the job market, diversity is no longer a matter of choice, but a marketable skill required for work; much less is the choice of taking a class or two with diversity content. •
Unsurprisingly, students of color tend to have a higher level of awareness and level of comfort than do white students. More clearly evident is the white male students’ low degree of comfort regarding racial/ethnic differences. Reaching out more to white male students for greater attitudinal change is critically needed. However, to single out white male students may not be conducive to reducing barriers. Any programs developed for creating attitudinal change will need to be a standard affair. In this regard, the campus’ vision on diversity will need to be part of each incoming freshman’s orientation package. This vision can be enhanced during the academic year through special sessions held in residence halls. The role for resident directors and their assistants will be to execute this vision as they confront and manage any racial tension that occurs within the students living environment. In order to empower this role, a much more sophisticated diversity orientation and training package for resident directors and their assistants will be needed. The design for both orientation packages will require more strategic planning on behalf of the administration in order to address the need for attitudinal change proactively.
•
Most students of color in predominantly white institutions have limited opportunities to relate to those of their own ethnic/racial group, and therefore, tend to have more exposure to other groups. However, a twoway interaction does not appear evident since most white students did indicate that their social interactions are limited to their own ethnic/racial group (Q. 3). By default (see demographic data), to increase race/ethnic social interactions and communications on campus, there needs to be an increase in the number of diverse students. No longer are the traditional modes for recruitment effective. In this regard, the techniques and strategies currently employed for recruiting minority students to the campus will need to be revised. The campus geographical location to the Rochester community must be seen as a strength. More awareness and training should be geared to admission officers for developing skills on how to tap into the minority community (i.e. churches), formal and informal ethnic community agencies in need for developing further their paraprofessionals of color, inner city schools, post-secondary schools (i.e. Educational Opportunity Center), local community colleges, etc. through more outreach and linkages. As important is the revision of the marketing strategies currently employed. Brochures, commercial/media coverage, billboard advertisements, etc. must be presented in other languages, use
23
minority personnel as models, and strategically placed in the ethnic community via the current minority media sources.
24
INDEX II:
Comfort Level with Social Environment - 6 items that concern how the students view other students pertaining to racial/ethnic issues. Comfort Level with Social Environment
Q4: Q5: Q6: Q20: Q21: Q22: Q25:
At Fisher, students are tolerant of others whose race/ethnicity is different from their own. There is interracial tension in the residence halls. Students, in general, feel that interracial dating is an acceptable social relationship at Fisher. The Pioneer’s coverage of racial/ethnic events and issues is balanced. There is racial conflict on the Fisher campus. There is racial/ethnic separation on the Fisher campus. I feel as though I belong to the Fisher community. SUBSCALE MEAN SCORE
General Population 3.48 3.48@ *3.18 *3.06 3.25@ *2.56@ 3.52 3.22
* Items falling below the mean @ Reversed items, 1 = strongly agree … 5 = strongly disagree
The mean score value for how students view other students pertaining to racial/ethnic issues (x = 3.22) fell within the positive range of “neutral”; the lowest score compared to all other comfort measure index levels. A lower mean score was found for students of color (x = 2.85), indicating that these students have a lower degree of comfort with the social environment than do white students (x = 3.32). More discomfort was noted among females of color (x = 2.7), while the opposite was found for white female students (x = 3.3). Items with scores above the mean: •
I feel as though I belong to the Fisher community – Q. 25: Students felt that they belong to the campus community quite strongly (x = 3.52; item with the highest mean). This sense of belonging was indicative of white females (x = 3.67) and white males (x = 3.51); somewhat indicative for males of color (x = 3.29). On the other hand, females of color tend to have a significantly lower sense of belonging to the campus community (x = 2.92).
•
At Fisher, students are tolerant of others whose race/ethnicity is different from their own - Q. 4: Students tend to perceive other students as somewhat tolerant of others (x = 3.48). A much more positive perception was found among white male (x = 3.61) and white female students (x = 3.56). Male students of color
25
appeared quite neutral (x = 3.10); while their female counterpart tend to perceive less tolerance among the student body (x = 2.96). •
There is interracial tension in the residence halls. – Q. 5 - reversed item: Students tend to slightly disagree that there is interracial tension in the residence halls (x = 3.48). More white females (x = 3.57) as well as the white males (x = 3.47) tend to support this view more strongly than students of color, especially females (x = 2.93). Interestingly, males of color tend to appear as ‘neutral’ (x = 3.18) regarding how they view interracial tension in the residence halls.
•
There is racial conflict on the Fisher campus – Q. 21 – reversed item: Students tend to appear slightly positive regarding how they perceive racial conflict on campus (x = 3.25). White males held a much more positive view (x = 3.42) than any other group. Similar to the overall item mean, white female students’ view appeared slightly positive (x = 3.27). Males of color appeared more neutral (x = 3.16), while females of color (x = 2.68) resulted in the only group that perceived some degree of racial conflict on the Fisher campus.
Items with scores below the mean: •
There is racial/ethnic separation on the Fisher campus – Q.22 – reversed item: This item resulted with the lowest mean score (x = 2.56), therefore, constituting an area of great concern. Data findings indicate that students did agree that there is racial/ethnic separation on campus. Females of color (x = 2.17) perceived racial/ethnic separation much strongly than any of the following groups: white female students (x = 2.57); males of color (x = 2.61); white males (x = 2.69). As noted, the major difference found was mainly between females of color and white male students.
•
The Pioneer’s coverage of racial/ethnic events and issues is balanced – Q. 20 Students were ‘neutral’ regarding the Pioneer’s coverage of racial/ethnic content (x = 3.06). Racial/ethnic differences among students denotes otherwise. White students (males x = 3.19; females x = 3.17) tend to have a slightly more positive view than that held by the general sample. Most students of color, especially males (x = 2.39; females x = 2.58), held an opposing/negative view and perceived that the Pioneer’s coverage of racial/ethnic content was not balanced.
•
Students, in general, feel that interracial dating is an acceptable social relationship at Fisher. – Q. 6 There is a very slim positive feeling that interracial dating is an acceptable social relationship at Fisher (x = 3.18). This positive perception appears to
26
be enhanced only by white female students (x = 3.31), while white males, similar to the findings from the general population, remained more neutral (x = 3.08). Less neutral were the females of color (x = 2.97), while males of color (x = 2.74) tended to feel that interracial dating was not an acceptable social relationship on campus. Discussion and Recommendations for Index II Great caution is suggested in interpreting these data findings. Although most of the item means fell within the neutral range, this level had the lowest subscale mean score. Therefore, students’ perceptions regarding their social environment should constitute an area of major concern. Strength: •
Students in general have a relatively strong sense of ‘we-ness’ and belonging to the campus community. Students perceive a high degree of tolerance of other students who are racially and/or ethnically different from them.
Areas for further development: •
Students tend to disagree that there is interracial conflict on campus (e.g., in the residence halls). Once gender and race differences are considered, white students, especially males, support a positive social view. However, such a positive perception of the social environment is not that strongly held by most students of color; much less by females.
•
Contrary to the findings for Index I, females of color (not white males) show the highest level of social discomfort. The predominance of low scores for females of color may not be only indicative of a low sense of social belonging and negative views of the campus social climate, but also a degree of social isolation. The former is not a surprising finding for most females of color in a predominantly white institution. What was not expected was a) the degree that some of these scores (Q. 21, 22, 25) differed from their male counterparts (i.e., such as these males’ positive sense of belonging and their neutral position type scores); and b), the neutral position assumed mostly by male students of color surrounding the issues of racial conflict (see Appendix B2, Index II for Q. 4, 5, 21). In other words, these women appear isolated not only from their social campus climate, but in various instances, isolated from the social views of their own male peers of color.
•
Therefore, it is recommended that the campus not only become more aware and sensitive to the social isolation experienced by most females of color, but also seek out culturally relevant strategies for reaching out to
27
them. In order to reduce the level of social discomfort and isolation, both traditional and nontraditional approaches must be considered. In this regard, a more informal network of support needs to be established through increasing linkages with the racial/ethnic communities. A closer look at services already in place is needed. Linkages with church/religious groups, minority women support groups, female students of color in nearby campuses, etc., are a few of the many informal resources that enrich the local Rochester community. In addition, the Alumnus Women of Color can be assigned and provide mentoring to those females who are at higher risk of isolation. •
It is not clear how much of the high level of social discomfort experienced by these female students of color is due to the subtleties sexism, racism, and classism that most females tend to experience within their lifetime. Nonetheless, most victims of discrimination do tend to feel pain and isolation. In this regard, any counseling services provided on campus must be tailored to meet the needs of those students victimized by direct and/or indirect discriminatory behaviors of others. Counselors as well as academic advisors must develop more insight, knowledge and skills on how such issues are detrimental for academic achievement. Counselors should also have a directory of special services (i.e., mental health) provided by professionals of color for consulting and/or referring to when appropriately needed.
•
It is also unclear if the level of social discomfort serves as a predictor of the retention rate as it pertains to this private academic institution. Nonetheless, students with a low sense of belonging are definitely at a higher attrition risk. Fisher college administrators can no longer afford to depend only on the benefits reaped by the retention efforts of the HEOP Office. Rather, it must aggressively seek other mentoring and supportive programs through grant writing efforts. Programs such as the Roger McNair, the Rochester TRIO Consortium of Student Support Services Program (at Genesee Community College, Monroe Community College, RIT and SUNY College at Brockport, etc.) have been note worthy for providing tutoring and mentoring to all students with socio-economic disadvantages.
•
Overall, the students’ comfort level with their social environment appears quite contradicting. From a positive standpoint, students tend to perceive other students as somewhat tolerant of others, students tend to slightly disagree that there is interracial tension in the residence halls, and students tend to appear slightly positive that racial conflict does not exist on campus. Yet, from a negative standpoint, students did agree that there is racial/ethnic separation; and remained neutral regarding the amount of coverage of racial/ethnic events and issues in the student newspaper, and neutral on the social issue of interracial dating. It is not clear how to
28
interpret such conflicting views from the general population. More opposing were the differences found between the white students and students of color. These opposing views may reflect a higher degree of racial tension than that previously perceived as strength. Students may need to be made aware of what constitutes racial tension and the importance of acknowledging its existence. •
More faculty/staff guidance for the development of the student’s newspaper is needed. Students directly involved with the newspaper should receive training on diversity and how to outreach to minority students for their input. There should also be a section regarding racial/ethnic events & issues, as a standard policy.
29
INDEX III: Comfort Level with Academic Environment - 6 items that concern the students’ views on racial factors pertaining to classroom environment, faculty and curriculum matters. Comfort Level with Academic Environment Q7:
Faculty at Fisher are fair to all students regardless of students’ racial or ethnic background. Q8: When appropriate, faculty use examples relevant to people of my race/ethnic group in their lecture. Q9: Faculty have the same expectations about students’ academic performance regardless of the students’ racial or ethnic background. Q11: In my experience, students of different race/ethnic backgrounds participate equally in classroom activities. Q12: I feel I am expected to represent my race/ethnic group in discussions in class. Q13: There is racial tension in the classroom. SUBSCALE MEAN SCORE
General Population 3.87 *3.65 3.93
*3.49
*3.45@ 3.73@ 3.69
* Items falling below the mean @ Reversed items, 1 = strongly agree … 5 = strongly disagree
The mean score value (x = 3.69) for how students view the academic environment was the highest of all compared to those mean scores found for the other comfort levels. Therefore, students tend to feel the most comfortable with the academic environment (classroom environment, faculty and curriculum matters). A major difference regarding the level of comfort felt was noted once race was considered. Students of color (x = 3.21) averaged significantly lower than that noted for white students (x = 3.78). Essentially, students of color tend to feel less comfortable (quite neutral) with their academic environment compared to the greater level of comfort found for the majority white student population. Items with scores above the mean: •
Faculty have the same expectations about students’ academic performance regardless of the students’ racial or ethnic background. – Q. 9 Students tend to agree quite strongly that the faculty have the same expectations about students’ academic performance regardless of their racial/ethnic background (x = 3.93). Although this perception was positive for all groups, major differences were found between the female population where white female students held the strongest view (x = 4.01)
30
in comparison to females of color who scored the lowest among all groups (x = 3.63). No major differences were found between the males (white males x = 3.95; males of color x = 3.93). •
Faculty at Fisher are fair to all students regardless of students’ racial or ethnic background. – Q. 7 Students tend to agree that the faculty is fair to all students regardless of their race/ethnicity. Major differences however, was found between the two major racial groups. Both white females and males were more positive about the fairness of the faculty (x = 3.97 and 3.91, respectively). Although still somewhat positive, students of color held a significantly less positive view, more so by females of color (x = 3.45; males of color x = 3.59) than their white counterparts.
•
There is racial tension in the classroom – Q. 13 – reversed item: Overall, students did not perceive much racial tension in the classroom (x = 3.73). A major difference was noted between the white students and students of color. Both white females (x = 3.81) and males (3.78) held a more positive view than students of color. Both students of color scored lower than the overall population mean (x = 3.69), where males of color (x = 3.25) held a slightly less positive perception than their females counterparts (x = 3.34).
Items with scores below the mean: •
I feel I am expected to represent my race/ethnic group in discussions in class. – Q. 12 – reversed item: This item resulted with the lowest mean score for the comfort level with the academic environment (x = 3.69). Although it appears quite positive that students feel that they are not expected to represent their race/ethnic group in class discussions, significant differences were found once the student’s race was considered. Most white students, especially males (x = 3.63; females = 3.57) feel that they are not expected to represent their race/ethnicity. In high contrast, both males/females of color (x = 2.56; 2.50, respectively) do tend to perceive that they are expected to represent their race/ethnicity in classroom discussions.
•
In my experience, students of different race/ethnic backgrounds participate equally in classroom activities. – Q. 11 Students do tend to perceive an equal participation in the classroom in spite of racial/ethnic differences (x = 3.49). Although it appears somewhat positive regarding equal participation with classroom activities, significant differences were found once the student’s race was considered. Most white students, especially females (x = 3.62; males = 3.40) perceive equal participation quite highly. Data findings for males/females of color (x = 3.10 for both) were less positive than that found among their white
31
counterparts. If anything, students of color were more neutral about the perception of students of different background participating equally in classroom activities. •
When appropriate, faculty use examples relevant to people of my race/ethnic group in their lecture. – Q. 8 Students in general tend to perceive that faculty appropriately use relevant examples regarding race/ethnic groups within their lecture (x = 3.65). This perception was significantly held by most white students (females x = 3.78; males = 3.71). Students of color (males x = 3.16; females x = 3.15) remained more neutral about faculty using race/ethnic group examples in their lectures.
Discussion and Recommendations for Index III Strength: This Index constitutes the strongest area (i.e. highest mean score), which suggests that faculty can serve as the main asset/vehicle for creating awareness and increasing knowledge and dialogue on race/ethnicity. Areas for further development: Not only is this area the strongest, but the most critical for producing change in students’ perceptions on diversity. The relationship between professors and students constitute the unique features of any academic environment. Faculty should understand that their level of awareness, attitudes and knowledge of diversity will enhance or curtail the campus mission for diversity. The role of ‘disseminating diversity’ is relatively new and challenging for most academicians in teaching institutions. In lieu of such a delicate and novel role, it is hoped that the following recommendations are seen as avenues for faculty growth and empowerment. Any training/faculty development should increase faculty awareness regarding their teaching styles and subtle comments and/or behaviors. Items with low mean score pertained to the following issues: •
How not to assume that students of color are the best resources for discussing racial issues in class – Faculty may need to go beyond knowing the student by name and gender. Racial/ethnic identity and level of acculturation are intrinsic features for most students of color and may need to be acknowledged without faculty discomfort.
•
How to instill equal participation in classroom activities – Faculty may need to gain more sensitivity/awareness and knowledge of the various
32
learning styles pertinent to ethnic groups. Traditional classroom structure (rather than a semi-circle that facilitates communication), informal style of the professor (i.e. most students of color have a difficult time calling their professors by their first name), class size, etc. are factors that need to be explored further for fostering classroom participation. •
How to appropriately incorporate examples of people of color (minority issues) in their lectures. – Faculty should understand that in spite of the subject matter, there is a need for integrating minority content without the cost of academic freedom. However, faculty alone should not be held accountable for this matter. Departments/ educational programs should adhere to diversity by ensuring that courses do integrate minority content across their curriculum. Most certification/licensing programs (i.e. nursing) are required to do so by their accrediting bodies. Such programs can serve as an internal resource for providing leadership and guidance to others.
•
How to manage racial tension within the classroom – Although this item constituted a strength from the general data, it appears as an area for further development according to the perception of most students of color (see Q.13). This data pertaining to racial tension is also consistent to that previously discussed under social climate. If incorporating racial content in lectures is difficult to do, much more difficult is processing racial issues within the classroom. Some faculty find racial tension quite discomforting, tend to ignore it, and/or lack the skills for addressing such group dynamics. Others tend to see this as an opportunity for student’s growth and utilize it as a scenario for conflict resolution. Any faculty development program should focus on providing teaching skills for managing diversity within the classroom. Rather than ignore, departments/educational program chair should consider these issues as an agenda item during their staff meetings. Most can learn from others as they share ‘best practices’ of dealing with diversity in the classroom.
33
INDEX IV:
Comfort Level with Organizational Environment - 8 items in reference to students’ perception of the campus organizational and administrative climate. Items also refer to services and staff practices (i.e. student treated with respect).
Comfort Level with Organizational Environment Q2: Q17:
Q18:
Q23: Q24: Q26: Q26: Q26:
At Fisher, getting to know people with racial/ethnic backgrounds different from my own has been easy. Fisher has been effective in improving relations and understanding between people of different racial/ ethnic backgrounds. Fisher has done a good job of providing programs and activities that promote multicultural understanding. There is adequate racial/ethnic diversity among administrators, faculty, and staff at Fisher. I would recommend Fisher to siblings or friends as a good place to go to school. Respectful treatment by staff in administrative offices. Respectful treatment by staff in academic support offices. Respectful treatment by staff in student life offices. SUBSCALE MEAN SCORE
General Population 3.39* 3.16*
3.56*
3.02* 3.76 3.91 4.04 4.04 3.61
* Items falling below the mean
The mean score value (X = 3.61) for how students view the organizational environment was the second highest of all mean scores found for the other comfort levels. Therefore, students tend to feel quite comfortable with the campus organizational and administrative climate; as well as with the respect received from the general staff. One of the major differences found pertained to race/ethnicity. Students of color (x = 3.29; females x = 3.2; males x = 3.38) averaged significantly lower than that noted for white students (x = 3.65; females x = 3.7; males x = 3.5). Essentially, students of color tend to feel less comfortable with the organizational climate compared to the greater level of comfort found for the majority white student population. It should be noted that white female students were significantly the most comfortable with the organizational climate than all of the other aforementioned groups. Items with scores above the mean: •
Respectful treatment by staff in academic support offices. Q26: Students in general feel quite strongly that they have been treated with respect by the staff in the academic support offices (x = 4.04). Gender
34
differences found consisted mainly within the white student sector, where white females (x = 4.13) felt highly respected than that perceived from their male counterpart (x = 3.97). A similar but opposite trend was noted for students of color where this time the males of color (x = 4.07) felt highly respected than that perceived from their female (x = 3.90) counterpart. Interestingly, both white males and females of color were similar to their perceptions in comparison to a stronger perception shared by both white females and males of color. •
Respectful treatment by staff in student life offices. Q26: Students in general feel quite strongly that they have been treated with respect by the staff in student life offices (x = 4.04). Similar to the findings of the previous item, the mean for female white students (3.98) was significantly higher than the mean for female students of color (x = 3.60) and white males (x = 3.61); less of a difference was noted for males of color (x = 3.73). Again, most white females and males of color tend to perceive more of a respectful treatment from the staff in students life offices, than that perceived from females of color and white males
•
Respectful treatment by staff in administrative offices. Q26: Students in general felt somewhat strong about the respectful treatment received by the staff in the administrative offices (x = 3.91). Similar to the previous findings, the only significant difference found was between the white females (x = 4.01) and white males (x = 3.84). A similar but opposite trend was noted for students of color where males of color (x = 3.91) felt highly respected by the administrative staff than that perceived from their female (x = 3.80) counterpart. Interestingly, both white males and females of color felt significantly less respect from the administrative staff than their racial counterparts.
•
I would recommend Fisher to siblings or friends as a good place to go to school. - Q24 Students in general agreed that they would recommend Fisher to siblings or friend as a good place to go to school (x = 3.76). Although the responses of all groups were somewhat positive, females of color was significantly the lowest (x = 3.27). White females students had the highest mean (3.94), males of color ranked second, (x = 3.74) and white males ranked third (x = 3.69).
Items with scores below the mean: •
There is adequate racial/ethnic diversity among administrators, faculty, and staff at Fisher. - Q23: Students in general tend to feel ‘neutral’ in reference to racial/ethnic diversity among administrators, faculty and staff at Fisher (x = 3.02).
35
Major discrepancies were found between the two main racial categories. White students tend to support the overall view (males x = 3.18; females x = 3.15; positive side of neutral). Students of color (females of color x = 2.24; males of color x = 2.21; negative side of neutral) tend to disagree that there is adequate racial/ethnic diversity among administrators, faculty and staff. •
Fisher has been effective in improving relations and understanding between people of different racial/ethnic backgrounds - Q17: Students in general tend to have a neutral perception regarding Fisher’s effectiveness in improving relations and understanding between people of different racial/ethnic backgrounds (x = 3.16; slightly on the positive side of neutral). A similar neutral perception was indicative of most males (males of color x = 3.09; white males x = 3.15). Major differences were found between the females where white females (x = 3.28) tend to have a more positive perception of Fisher’s effectiveness, contrast to a significantly poorer perception held by females of color (x = 2.82).
•
At Fisher, getting to know people with racial/ethnic backgrounds different from my own has been easy. - Q2: Students in general tend to perceive that it has been somewhat easy at Fisher to get to know people from different racial/ethnic backgrounds (x = 3.39). Although no major differences were found, white students were somewhat more positive (females x = 3.48; males x = 3.39); students of color (females x = 3.15; males x = 3.09) remained more neutral.
•
Fisher has done a good job of providing programs and activities that promote multicultural understanding - Q18: Slightly below the subscale mean (X = 3.61), students in general tend to agree that Fisher has done a good job of providing programs and activities that promote multicultural understanding (x = 3.56). However, significant differences were found between the two predominant racial groups. Both gender groups of color (females x = 3.20; males x = 3.21) felt less positive that Fisher has done a good job of promoting multicultural understanding, than that felt by white students (females 3.73; males x = 3.49).
Discussion and Recommendations for Index IV Strength: § In essence, students feel respected by the staff in administrative offices, academic support offices and student life offices. Areas for further development: • Students in general are aware that there is a need for more racial/ethnic diversity among administrators, faculty, and staff. A stronger indication of this
36
issue was found among females and males of color (i.e. item with the lowest mean score). The recruitment and retention of racial/ethnic minorities remains a problem for academia. In this regard, the current recruitment and retention strategies may need to be revised. In addition, any Affirmative Action policy in place may need to be reaffirmed and executed vigilantly during all searches and hiring of new staff. Administration may want to reward (i.e. add new lines) those programs that do seek out minority faculty and staff. Strategic planning may need to tap into external resources (i.e. effective practices utilized at local corporations) and delineate more clearly those activities (i.e. training on recruitment and retention) needed for achieving diversity on campus. Campus should mirror with staff the diversified student body it seeks to achieve. Data findings suggest that students in general do perceive ‘getting to know people with racial/ethnic backgrounds different from my own’ somewhat difficult. •
Although students perceived that minority/diversity programs has somewhat promoted multicultural understanding, a lower score was found among students of color. The institutionalization of the ‘Office of Diversity Programs’ constitutes an organizational strength. However, there is room for growth and development. The effectiveness of such diversity programs in most predominantly white institutions is challenging and somewhat isolating for program deliverers. These program deliverers, mostly staff of color, are seen by the administration as the solution to their campus diversity mission. For many campuses it constitute a one-person ‘add on’ unit, with limited administrative, resource and man power support. More awareness regarding program goals and functions may be needed in order to strengthen any positive perception/value/embracement this program holds within the campus community. A revision of program goals and activities may be needed and should seek input from the campus community, especially students of color.
•
In addition to the aforementioned issues, the level of students’ participation in extracurricular activities, especially those pertaining to multicultural events, were not studied. More insight may be needed since current studies do indicate a decrease in students’ participation and social commitment to campus issues. In spite of the survey’s limitation, more support from faculty may be needed. Strategies for fostering participation may include faculty offering extra credit to those who attend and discussing the impacts of these events during classroom sessions. Such dialogue may result fruitful, especially to those who struggle with how to incorporate minority content into their lectures. However, this requires more time and commitment from the faculty since they will also need to attend these sessions in order to increase racial/ethnic dialogue in the classroom. As important, is the need to ensure a stronger presence from top administrators and staff. Such a presence will be felt by students and perceived as a true organizational commitment for diversity.
37
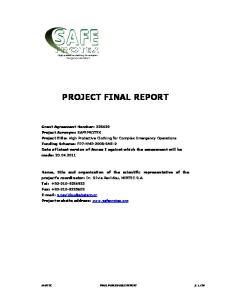
Which diversity issues (besides race and ethnicity) are most important? 76
Gender 59
Sexual Orientation 21
Ageism
18
Religious Affiliation 7
Ableism 0
20
40
60
80
Number of times mentioned
Student Responses: ζ I believe that sexual orientation is more important. Since I’ve been here I have had to deal with issues of harassment and abuse. ζ Gender is most important. Men at Fisher are considered dominant in the classroom full of women. ζ Religious affiliation - those of us who are not Catholic have no guidance as to where to go for spiritual experiences of our own denomination. ζ Ageism - with the influx of adult students on the campus, traditional students need to be more welcoming and not perceive us as others.
More comments on diversity issues ζ Sexual orientation is the most important diversity issue in my opinion. It is 1999. We must learn to accept homosexuality, bisexuality without slandering people because of the way they feel. ζ I believe gender is a big one because I have noticed a few professors only pick on the male students even though the females always raise their hands too. ζ Sexual orientation - I see & hear too many derogatory - hurtful - hateful comments about this on & off campus. ζ None - concentrate on providing practical education that helps students find employment in their field.
38
REFERENCES
Carnevale, Anthony P. "Diversity in Higher Education: Why Corporate America Cares." In Diversity Digest: Communicating Diversity in Higher Education." Association of American Colleges and Universities, Spring 1999: 1,6. Gurin, Patricia. "Diverse environment benefits college students educationally." University of Michigan, Ann Arbor. August 12, 1999. http://www.DiversityInc.com/ Archive/ MichDiv/michdiv.html. Pp. 1-3. "New Research on The Benefits of Diversity in College and Beyond: An Empirical Analysis." In Diversity Digest: Communicating Diversity in Higher Education." Association of American Colleges and Universities, Spring 1999: 5, 15. Daryl G. Smith et. al. "Executive Summary." In Diversity Works: The Emerging Picture of How Students Benefit. Washington, D.C.: Association of American Colleges and Universities, 1997. Pp. V-VII. Diversity Blueprint: A Planning Manual for Colleges and Universities. A collaboration between University of Maryland, College Park, and Association of American Colleges & Universities. Washington, D.C.: Association of American Colleges and Universities, 1998 RPT completed SUMMER 2000
39