Available online at www.scholarsresearchlibrary.com
Scholars Research Library Archives of Applied Science Research, 2012, 4 (1):128-136
(http://scholarsresearchlibrary.com/archive.html) ISSN 0975-508X CODEN (USA) AASRC9
Crystallization and characterization of mixed crystals of strontium calcium barium tartrate M. Mary Freedaa*, R. Krishna Priyab, T. H. Freedac and S. Mary Delphinea a
Department of Physics, Holy Cross College, Nagercoil, Tamil Nadu, India Department of Physics, Rajas International Institute of Technology for Women, Nagercoil, Tamil Nadu, India c Physics Research Centre, S.T. Hindu College, Nagercoil, Tamil Nadu, India _____________________________________________________________________________ b
ABSTRACT Single crystals of strontium calcium barium tartrate (SCBT) were grown by controlled diffusion in silica gel at ambient temperature. The structural characterization of the grown crystals was carried out by Single crystal and Powder X-ray diffraction analysis. The functional groups present in the crystals were identified using Fourier Transform Infrared spectral analysis. The UV-Vis-NIR transmission spectrum was recorded to study the optical transparency of the grown crystals. The nonlinear optical (NLO) property of the grown crystals was confirmed by KurtzPerry powder technique. The chemical composition of the sample was verified using EDAX spectrum. Mechanical strength of the grown crystals was analyzed by Vickers microhardness test. The dielectric constant and dielectric loss of the crystal were measured as a function of frequency and temperature. Keywords: Gel Growth, Optical property, Characterization, X-ray diffraction, FTIR, Microhardness. _____________________________________________________________________________ INTRODUCTION Tartrate single crystals show many interesting physical properties such as ferroelectric, piezoelectric, dielectric, optical and other pertinent characteristics [1-4]. They are used for nonlinear optical devices based on their optical second harmonic generation, optical transmission characteristics, fabrication of crystal oscillators and resonators and controlled laser emission [57]. Among the several tartrate compounds, strontium tartrate and calcium tartrate have received greater attention on account of their ferroelectric, non linear optical and spectral characteristics [1,8-9]. Calcium tartrate crystals are well known for its ferroelectric properties in pure [1] as well 128 Scholars Research Library
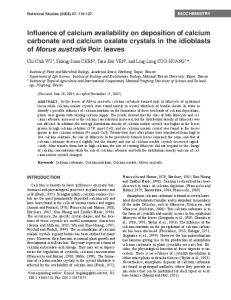
M. Mary Freeda et al Arch. Appl. Sci. Res., 2012, 4 (1):128-136 ______________________________________________________________________________ as doped forms [10] and their structural characterization [11] and FT-IR and thermal properties [12] have been reported. Strontium tartrate is an important member of the tartrate family with device applications [13]. Growth and characterization of strontium tartrate single crystals, both pure and doped have been reported by many researchers [14-17]. Growth of mixed crystals of various compositions is a fast growing field of research because of the great need of such crystals for several applications. Recent focus is on tartrate mixed crystals which constitute a very interesting system for academic and research studies. The physico-chemical characterization of calcium strontium tartrate crystals grown from light irradiated sodium meta silicate gel medium was reported [18]. Single crystals of barium mixed calcium tartrate tetrahydrate have been grown and reported [19]. The physico-chemical characteristics of barium mixed calcium tartrate were determined [20]. In the present work, we report the growth of mixed crystals of strontium calcium barium (SCBT) tartrate by gel method and the structural, spectral, optical, chemical, dielectric and mechanical characterization of the grown crystals by single crystal and powder XRD studies, FTIR, optical absorption studies, SHG efficiency measurement, energy dispersive analysis, dielectric and microhardness studies. MATERIALS AND METHODS 2. Experimental Procedure 2.1. Crystal Growth Strontium calcium barium (SCBT) tartrate crystals were grown in silica gel by employing the test tube diffusion method [21]. Silica gel was prepared by adding sodium meta silicate solution of specific gravity 1.04 to tartaric acid (1M) drop by drop with continuous stirring with a view to avoid excessive local ion concentration which may cause premature local gelling and make the final solution inhomogeneous and turbid. The pH of the gel was adjusted to attain the value of 4.2. This gelling mixture was allowed to set in glass tubes of length 20 cm and diameter 2.5 cm. Mouths of the test tubes were closed with cotton to prevent evaporation and contamination of the exposed surface of the gel. The gel was found to set in about 4 days. After ensuring firm gel setting, the supernatant solution was poured above the set gel with the help of a pipette, so as to allow the solution to fall steadily along the wall of the tube to prevent the gelled surface from cracking. The supernatant solution was a mixture of aqueous solutions of strontium chloride (0.5 M), calcium chloride (0.25 M) and barium chloride (0.25 M). The supernatant solution diffuses into the gel column and reacts with the inner reactant, giving rise to the formation of strontium calcium barium tartrate crystals. The crystals were harvested after a month. The maximum size of the crystals grown was about 6x5x3 mm3. All the chemicals used were of Analar grade. The photograph of the grown crystal is shown in Fig.1.
Fig. 1. Photograph of the grown SCBT single crystals
129 Scholars Research Library
M. Mary Freeda et al Arch. Appl. Sci. Res., 2012, 4 (1):128-136 ______________________________________________________________________________ 2.2. Characterization The grown SCBT crystals were subjected to the single crystal X-ray diffraction studies using BRUKER-NONIUS CAD4 single crystal X-ray diffractometer with MoKα radiation (λ=0.71073 Å) to obtain the unit cell parameters. To confirm the values of the lattice parameters obtained from single crystal XRD studies and to identify the diffraction planes, powder X-ray diffraction pattern of the powdered sample was obtained using a powder X-ray diffractometer (PANalytical Model; nickel filtered CuKα radiations with λ=1.54056 A˚ at 35 KV and 10 mA). The sample was scanned over the required range for 2Ө values (10 -70o). The crystalline phase of the sample was identified from crystallographic parameters such as 2Ө, relative intensity and hkl values. The Fourier Transform infrared spectrum was recorded for the powdered sample in the range 400–4000 cm-1 using a Perkin Elmer Fourier transform infrared spectrometer (Model:Spectrum RXI) using KBr pellet technique. The optical absorption spectrum of the SCBT crystal was recorded using VARIAN CARY 5E spectrophotometer in the wavelength range of 200–900 nm. The NLO conversion efficiency was tested using a modified set-up of Kurtz and Perry and was carried out using a Q-switched mode locked Nd:YAG laser with the first harmonic output at 1064 nm. Qualitative chemical analysis was performed using an energy dispersive X-ray spectrometer (JEOL Model JED- 2300). The mechanical property was studied using Shimadzu HMV-2 Vickers microhardness tester fitted with a diamond indenter. The measurements were made at room temperature, and various loads from 25 to 100 gm were applied and the indentation time was kept as 5s for all the loads. The hardness of the crystal was calculated using the relation Hv = 1.8544 P / d2 where Hv is the Vicker’s hardness number, P is the indentation load in Kg and d is the diagonal length of the impression in mm [22]. Dielectric studies were carried out on the grown crystals using an LCR meter (Agilent 4284 A) at various frequencies in the range 103–106 Hz and at different temperatures ranging from 313 to 393 K. RESULTS AND DISCUSSION 3.1. Single crystal X-ray Diffraction Analysis Single crystal X-ray diffraction analysis has been carried out to confirm the crystallinity and to find the lattice parameters. From the single crystal X-ray diffraction analysis it was inferred that the grown strontium calcium barium tartrate crystals belong to orthorhombic system with space group P212121. The determined lattice parameters are a= 9.25Å, b=9.61Å, c=10.61Å, V=942 Å3. 3.2. Powder X-ray diffraction analysis X-ray diffraction technique is used to investigate the inner arrangement of atoms or molecules in a crystalline material. The grown SCBT crystals were subjected to powder X-ray diffraction studies. Well defined peaks at specific 2 θ values show high crystallinity of the grown crystals. All the reflections of the powder XRD pattern were indexed using the INDEXING and TREOR software packages. The indexed powder XRD diffractogram of SCBT crystals is shown in Fig.2. From the XRD analysis it is observed that the grown crystals belong to orthorhombic system with space group P212121. The lattice parameters obtained from the indexed XRD pattern using the UNIT CELL software package are a=9.268Å, b=9.622Å, c=10.599Å, V=943.73Å3 and are comparable with the values obtained from single crystal XRD studies.
130 Scholars Research Library
320
M. Mary Freeda et al Arch. Appl. Sci. Res., 2012, 4 (1):128-136 ______________________________________________________________________________ 3000
500
314 430
622
425
232 401 240 323 043
121 220
1000
020 201
011
1500
031 131 123 004
2000
110
Intensity (counts)
2500
0 10
20
30
40
50
60
70
Two theta (degrees)
Fig. 2. Powder X-ray diffractogram of SCBT crystals
3.3 Fourier Transform Infrared Spectral (FTIR) Analysis The FTIR analysis is a technique that provides information about the chemical bonding or molecular structure of materials. The FTIR spectrum of the grown crystals is shown in Fig. 3. The absorption peaks correspond to the molecular group vibrations. The relations of the molecular group vibrations and the characteristic absorption bands were assigned according to the theories of infrared spectra [23]. In the FTIR spectrum, the absorption bands in the region 3568-2600 cm1 are due to OH stretching mode, water and C-H stretch. The band at 1593 cm-1 is attributed to the C=O stretch of carbonyl group. The strong peak at 1390 cm-1 is assigned to C=O symmetric and δ (O-C=O) mode. The peaks at 1329 cm-1 is due to -OCH stretching mode. The peaks at 1060 and 965 cm-1 are assigned to C-O stretching and C-C stretching modes. 100
0 400 0
3 50 0
3 00 0
2 50 0
2 00 0
533
816 712
1390
1593
3568
20
1329
2600
40
1146 1060
2997
60
3429
% Tr ansmittance
80
1 500
1 000
5 00
-1
Wav e n u m b er (c m )
Fig. 3. FTIR spectrum of SCBT Crystals
131 Scholars Research Library
M. Mary Freeda et al Arch. Appl. Sci. Res., 2012, 4 (1):128-136 ______________________________________________________________________________ The peak at 712 cm-1 is due to the deformation vibrations of CO2. The peak at 533 cm-1 is attributed to metal-oxygen bond. The presence of O-H bond, C-O bond, water of hydration and carbonyl C=O bond are established from the spectra. 3.4 Optical Absorption Spectral Analysis The recorded optical absorption spectrum of the grown SCBT crystal in the wavelength range 200-900 nm is shown in Fig. 4. It is inferred from the spectrum that the grown crystals have low absorbance in the entire UV-Vis-NIR region considered and the cut off wavelength is around 240 nm, closer to UV range. The spectrum further indicates that the crystal has a wide optical transmission window range from 240-900 nm. The presence of low cut off wavelength and the wide optical transmission window range are the most desirous properties of materials possessing NLO activity [24]. 3.5 3.0
Absorbance
2.5 2.0 1.5 1.0 0.5 0.0 200
300
400
500
600
700
800
900
Wavelength (nm)
Fig. 4. Optical absorption spectrum of SCBT crystal
3.5. Second harmonic generation (SHG) efficiency measurement Kurtz and Perry powder technique is extremely useful for the initial testing of materials for second harmonic generation (SHG).The second harmonic generation (SHG) conversion efficiency of the grown crystal was measured by powder Kurtz and Perry technique [25]. The crystal was grounded into a homogenous powder and densely packed between two transparent glass slides. A Q switched Nd:YAG laser beam of wavelength 1064 nm with an input power of 0.68 J/pulse, pulse width of 6 ns and repetition rate of 10 Hz was directed on the sample. The doubling of frequency was confirmed by the emission of green radiation of wavelength 532 nm using a photomultiplier tube. A sample of powdered potassium dihydrogen phosphate (KDP) was used as the reference material in the SHG measurement. From the obtained data, the efficiency of second harmonic generation was found to be 0.28 times that of the standard KDP. 3.6. Energy Dispersive X-ray analysis In order to confirm the presence of the elements in the grown SCBT crystals, the sample of grown crystals were subjected to Energy Dispersive X-ray analysis. The obtained spectrum (Fig.5) confirms the presence of calcium, strontium and barium.
132 Scholars Research Library
M. Mary Freeda et al Arch. Appl. Sci. Res., 2012, 4 (1):128-136 ______________________________________________________________________________
Fig. 5. EDAX spectrum of SCBT single crystal
3.7. Vicker’s Microhardness test Microhardness studies of any system has direct correlation with the crystal structure and is very sensitive to the presence of any other phase or phase transition and temperature conditions prevalent in the system. The microhardness characterization is extremely important as far the fabrication of devices is concerned. The grown SCBT crystal was tested for the microhardness property. The relation between hardness number (Hv) and load (P) is shown in Fig.6. It was observed that the microhardness increases with increase in load, and above 100g cracks develop on the smooth surface of the crystal due to release of internal stresses generated locally by indentation [26]. This can be explained qualitatively on the basis of the depth of penetration of the indenter [27]. For small loads, only a few surface layers are penetrated by the indenter. The measured hardness is characteristic of these layers and Hv increases with load in this region. With increase in load, the overall effect is due to the surface as well as the inner layer of the sample. Fig.7 shows the variation of log d versus log P. The work hardening coefficient n was determined from the slope of log P versus log d plot using least square fit method. The value of n was found to be >2. According to Onitsch [28], if n>2, the materials are said to be soft ones. He also found that microhardness increases with increasing load when n>2 and decreases with increasing load when n