CROP EXTENT MAPPING USING MODIS DATA IN EL SALVADOR Chi-Farn Chen, Nguyen-Thanh Son, Cheng-Ru Chen Center for Space and Remote Sensing Research, National Central University, Jhongli, Taoyuan City 32001, Taiwan Email:
[email protected],
[email protected],
[email protected]
ABSTRACT This study aimed to develop a mapping approach to investigate the extent of major crops (e.g., maize, beans, and sorghum) in El Salvador using MODIS data. We processed the data for 2011 through four main steps: (1) constructing the time-series enhanced vegetation index 2 (EVI2) data, (2) noise filtering of the time-series data with the empirical mode composition (EMD), (3) crop area mapping using phenogical information extracted from the smooth EVI2 data, and (4) accuracy assessment. The mapping results compared with the ground reference data indicated an overall accuracy of 82.7% and a Kappa coefficient of 0.65, respectively. The results also validated with the government’s statistics of cropping areas at the department level confirmed a close correlation between the two datasets (R2 = 0.77). KEY WORDS: MODIS, food crops, crop phenology, El Salvador. 1. INTRODUCTION Agriculture is thus playing a vital role in El Salvador to meet food demands of the growing population. Climate change have however caused profound impacts on agriculture in the country. There was thus a need to delineate spatial distribution of major food crops to produce reliable geo-databases primarily important for crop monitoring and planning. Remote sensing concerning crop conditions and agricultural production has demonstrated an efficient tool to provide reliable estimation of the cultivated area at the national scale. In this study, MODIS 250 m data were used for crop mapping because it has a wide swath coverage and high spectral and temporal resolutions. A number of studies of crop monitoring have been carried out using phenological information derived from multitemporal MODIS imagery (Foerster et al., 2012; Sibanda and Murwira, 2012; Vintrou et al., 2012; Wardlow and Egbert, 2008; Wardlow et al., 2007). However, one of disadvantages of MODIS data is cloud contamination. Thus, filtering methods are often applied to reduce such a noise in the time-series MODIS data prior to the image classification and analysis. The present study applied the empirical mode decomposition (EMD) (Huang et al., 1998) for noise filtering of the time-series MODIS enhanced vegetation index 2 (EVI2) data. Based on information of crop phenology, an approach was developed for delineating the fields of major crops (e.g., maize, bean, and sorghum) in the study region. The main objective of this study was to develop an approach using MODIS data for investigating the cultivating areas of major crops in El Salvador. 2. STUDY AREA The study area (El Salvador) is the smallest and the most densely populated country in Central America, covering approximately 21,040 km2 (Figure 1). The elevation in the country ranges
from 0 to 2,343 m. Approximately 23% of the country’s land was allocated for agriculture (Stibig et al., 2004). Maize was the most important food crop among beans and sorghum. Maize planted area was approximately 286,000 ha, and those of beans and sorghum were roughly 117,000 ha and 104,000 ha (MAG, 2012). Crop cultivation was heavily depends on the rain-fed condition. Farmers mainly grow one maize crop per year, starting from May–Jun to November. Beans and sorghum are inter-planted amongst the maize in the second season (Aug–Sep) as the maize matures and its stalk cane be folded.
Figure 1. The study area showing the elevation levels with a reference to the geography of Central America region. Black points indicated ground reference sites used for accuracy assessment of the mapping results.
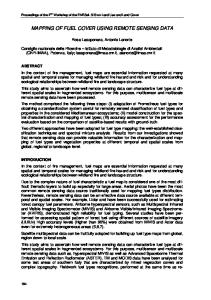
3. DATA COLLECTION The 8-day MODIS data (MOD09Q1) acquired from NASA for 2011 were used. The data product has two spectral bands (red and near infrared) and the spatial resolution is 250 m. The data have been geometrically and radiometrically corrected for all spectral bands (Vermote et al., 2008). The Aster DEM (30 m resolution) collected from NASA was also used for masking high-elevation areas. The 2011 El Salvadorian land-use/land-cover (LULC) map provided by the Salvadoran Ministry of Agriculture and Livestock (MAG) were collected and used for cross checking and preparation of ground reference data for mapping accuracy assessment. The department-level statistics of planted areas of maize, beans, and sorghum was also collected from the MAG and used for examining the consistency with the mapping results. 4. METHODS The time-series EVI2 data contained some noise due to individual band noise contaminated by cloud covers, such noises were filtered using the empirical mode decomposition (EMD) method (Huang, 1998). An example shows the results of EMD sifting processing of a crop signature in the study region (Figure 2). Because the objective of this study was to map areas of major crops, non-cropped areas (e.g., forests, grassland, built-up areas, and water bodies) were thus masked out to limit the analysis to agricultural areas using the slope map (derived from Aster DEM data). The areas with the slope greater than 15% were identified as unsuitable for crop production due to mechanization difficulties and were thus excluded from the analysis (Gusso et al., 2012).
The cultivating areas for major food crops were mapped using phenological information of crop profile. Based on characteristics of crop phenology, a threshold of 0.4 was set to remove unrealistic cropping patterns. Because a cycle of a crop fell within a specific cropping period based on the cropping calendar, the heading dates should also fall within the periods, namely DOY 121−297 for maize in the first cropping season, and DOY 185−361 for the second cropping season, respectively. Moreover, a growing cycle of crops in the region was generally longer than four months. Thus, the interval between the two heading dates should also be longer than 100 days because from planting date to heading date was approximately 65 days and that from heading period to the end of the crop season was approximately 70 days (FAO, 2013). A refinement process was eventually performed to group the cropping areas of the first and second seasons into a so-called cropland class. The classification map was assessed using the ground reference data. 500 pixels for each class (i.e., cropland and non-cropland) were randomly selected from this ground reference data to compare with those from the classification map. We also measured the consistency between the classification results and the government’s statistics of crop planted areas. 0.8 EVI2 Filtered EVI2
0.7
EVI2
0.6 0.5 0.4 0.3 0.2 0.1 1
41
81
121
161 201 DOY (2011)
241
281
321
361
Figure 2. Temporal EVI2 profile of major crops in the study region.
5. RESULTS AND DISCUSSION The mapping results indicated the spatial distributions of major food crops in El Salvador (Figure 3). Crop distribution was spatially scattered throughout the study region in plains along rivers, with more concentrated in the west and north parts of the country due to unfavourable soil and climatic conditions. The classification results were compared with the ground reference data indicated close agreement between the two datasets. The overall accuracy and Kappa coefficient were 82.9% and 0.66, respectively (Table 1). The relationship between the planted areas (derived from MODIS data) and those from the government’s statistics of planted areas was examined, indicating a close correlation (R2 = 0.78). However, the relative error in area between these two datasets indicated a slightly underestimation with the overall relative error of −10.1%. The mixed pixel issues could cause the patterns of these major crops to be confused with those of other land-use types, leading to misclassification of the fields of major crops. Moreover, this study used the ground reference data prepared from the higher resolution data, while the mapping results were produced from the course resolution MODIS data. The resolution bias between these two datasets could also exaggerate the mapping errors.
Figure 3. Spatial distribution of major food crops (maize, beans, and sorghum) in El Salvador achieved from the classification of the 2011 smooth time-series EVI2 data. Table 1. Results of the classification accuracy assessment. Ground reference data (pixels) Cropland Non-cropland Total Producer accuracy (%) User accuracy (%) Overall accuracy (%) Kappa coefficient
Classification results (pixels) Cropland Non-cropland Total 412 88 500 83 417 500 495 505 1,000 82.4 83.4 83.2 82.6 82.9 0.66
6. CONCLUSIONS This study aimed to investigate the applicability of MODIS 250 m data for mapping major crops in El Salvador, Central America. The mapping results compared with the ground reference data indicated the satisfactory agreement. The overall accuracy and Kappa coefficient values were 82.9% and 0.66, respectively. The crop planted areas compared with the government’s statistics also revealed the consistency between two datasets, reaffirming the validity of the mapping approach. The results could provide quantitative information on cropping areas for major food crops in the region, which was useful for agronomic planners to monitor agricultural practices and production estimation in the country. REFERENCES FAO, 2013. Crop water information, FAO Water Development and Management Unit, Food and Agriculture Organization of the United Nations. Foerster, S., Kaden, K., Foerster, M., Itzerott, S., 2012. Crop type mapping using spectral–temporal profiles and phenological information. Computers and Electronics in Agriculture 89, 30-40. Gusso, A., Formaggio, A.R., Rizzi, R., Adami, M., Rudorff, B.F.T., 2012. Soybean crop area estimation by Modis/Evi data. Pesquisa Agropecuária Brasileira 47, 425-435.
Huang, N.E., Shen, Z., Long, S.R., Wu, M.C., Shih, H.H., Zheng, Q., Yen, N.C., Tung, C.C., Liu, H.H., 1998. The empirical mode decomposition and the Hilbert spectrum for nonlinear and non-stationary time series analysis. Proceedings of the Royal Society of London. Series A: Mathematical, Physical and Engineering Sciences 454, 903-995. Huang, N.E., Shen, Z., Long, S.R., Wu, M.C., Shih, H.H., Zheng, Q., Yen, N.C., Tung, C.C. and Liu, H.H., 1998. The empirical mode decomposition and the Hilbert spectrum for nonlinear and non-stationary time series analysis. Proceedings of the Royal Society London A 454, 903 995. MAG, 2012. Statistical yearbook, Ministry of Agriculture and Livestock. Sibanda, M., Murwira, A., 2012. The use of multi-temporal MODIS images with ground data to distinguish cotton from maize and sorghum fields in smallholder agricultural landscapes of Southern Africa. International Journal of Remote Sensing 33, 4841-4855. Stibig, H.J., Achard, F., Fritz, S., 2004. A new forest cover map of continental southeast Asia derived from SPOTVEGETATION satellite imagery. Applied Vegetation Science 7, 153-162. Vermote, E.F., Kotchenova, S.Y., Ray, J.P., 2008. MODIS surface reflectance user’s guide. Vintrou, E., Desbrosse, A., Bégué, A., Traoré, S., Baron, C., Lo Seen, D., 2012. Crop area mapping in West Africa using landscape stratification of MODIS time series and comparison with existing global land products. International Journal of Applied Earth Observation and Geoinformation 14, 83-93. Wardlow, B.D., Egbert, S.L., 2008. Large-area crop mapping using time-series MODIS 250 m NDVI data: An assessment for the U.S. Central Great Plains. Remote Sensing of Environment 112, 1096-1116. Wardlow, B.D., Egbert, S.L., Kastens, J.H., 2007. Analysis of time-series MODIS 250 m vegetation index data for crop classification in the U.S. Central Great Plains. Remote Sensing of Environment 108, 290-310.