March 14, 2007 5th Conference on Systems Engineering Research
Ricardo Valerdi MIT; 77 Massachusetts Ave., Cambridge, MA 02139
[email protected] John E. Gaffney, Jr. Lockheed Martin; One Curie Court, Rockville, MD 20850
[email protected]
Reducing Risk and Uncertainty in COSYSMO Size and Cost Drivers: Some Techniques for Enhancing Accuracy
•
•
•
•
•
2
This presentation describes how the COSYSMO systems engineering effort model/tool develops a probabilistic range of estimates rather than just a single point cost estimate. – This is the COSYSMO Risk or COSYSMO-R approach. The purpose of doing so is to provide systems engineers, managers, and other decision makers insight to make better decisions concerning such matters as the probability of a project’s meeting its cost target. COSYSMO-R provides “risk” and “confidence” distributions for the labor and schedule or project duration estimates, based three-point values for each of its parameters that the user enters. Risk=Prob[actual value >target value]; the complementary cumulative distribution function (CCDF). Confidence=100%-Risk%=Prob[actual≥ target value]; the cumulative distribution function (CDF) of the cost. Note: these definitions apply to quantities for which “better” is smaller, e.g., effort/cost and project duration. They are reversed for cases in which “better” is larger, such as Mean-Time-Between Failure.
Overview
Acquisition & Supply Technical Management System Design Product Realization Technical Evaluation
**inspired by ISO 15288
Conceptualize Develop Operational Test & Evaluation Transition to Operation
*from ANSI/EIA 632
– – – –
• The four phases** are:
– – – – –
• The academic COSYSMO model is implemented on an excel spreadsheet that provides an estimate of the total effort for five systems engineering activities over four life cycle phases • The five activities* are:
Basic or Academic COSYSMO Overview
3
PH=systems engineering person hours A=unit effort constant S=equivalent size, number of equivalent requirements E=exponent Di, i=1,2,….,14 are the cost driver values
• All of these parameters are considered to be mutually independent.
– – – – –
where:
Basic or Academic COSYSMO Overview, Contd. • The fundamental equation implemented by COSYSMO (Valerdi 2005) and COSYSMO-R is: PH = A*(SE)*П Di
4
5
– Rather, it generates an approximation to the distribution from the 3 point approximations to each variable. For example, if there are 4 (mutually independent) variables, the approximation has 81 values (=3x3x3x3).
• The COSYSMO-R risk assessment capability is implemented using three-point approximations; they are non-parametric, meaning that they are not derived as approximations to any particular distribution such as a Gamma or a Weibull. • This in contrast to the use of Monte Carlo methods, in which a particular distribution is used and then a large number of instances are generated from it. • COSYSMO-R does not generate such a large number of instances.
Probability Approximation Used In COSYSMO-R
•
•
Probability Assigned 0.185 0.630 0.185
Fractile 0.05 0.50 0.95
This method approximates a continuous distribution by a discrete one:
– They evaluated 22 approximations, and found this one to be the best in terms of its ability to estimate the means and variances of various distributions.
We used the approximation developed by Keefer and Bodily, the “extended Pearson-Tukey” method.
Probability Approximation Used In COSYSMO-R, Contd.
6
•
• • Number of System Requirements Number of System Interfaces Number of System-Specific Algorithms Number of Operational Scenarios
– – – – – – – – – – – – – –
Requirements Understanding Architecture Understanding Level of Service Requirements Migration Complexity Technology Risk Documentation # and diversity of installations/platforms # of recursive levels in the design Stakeholder team cohesion Personnel/team capability Personnel experience/continuity Process capability Multi-site coordination Tool Support
Cost/Performance Characteristics, Cost Drivers:
– – – –
Model Parameters A and E Scope or Project Size Characteristics, Equivalent Size Drivers:
The COSYMO-R User Enter Three-Point Estimates For:
7
8
• In this example, the range of values for each of four cost drivers is given in terms of Low, Likely , and High values that characterize the uncertainty in the estimator’s belief in their values.
COSYSMO-R Example of Uncertainty Capture for Four Cost Drivers
4
3
2
1
Number
High Estimate
Likely Estimate
Low Estimate
Tool Support
High Estimate
Likely Estimate
Low Estimate
Pers/Team Cap.
High Estimate
Likely Estimate
Low Estimate
Technol. Risk
High Estimate
Likely Estimate
Low Estimate
Reqm'ts. Under.
Name
Driver
1.43
1.59
0.5
1.9
XL
x
1.1
1.12
1.26
1.30
L
x
x
x
1.00
1.00
1.00
1.00
N
Most Likely Driver Product Value=
1.4
x
1.5
x
0.68
1.71
VL
x
x
Values
1.131
0.87
0.87
1.3
0.75
H
x
x
x
x
0.75
0.68
1.75
0.65
VH
0.62
0.62
2.00
0.50
XH
COSYSMO-R Example of Uncertainty Capture for Four Cost Drivers, Contd.
9
– In some cases, the estimator might choose to show just the smooth curve to his audience.
10
• COSYMO-R generates a plot of the “risk” for systems engineering labor hours. • Shown is both the discrete (point-by-point) representation as well as a smooth curve through it.
COSYSMO-R Example of Uncertainty Representation of Systems Engineering Person Hours Risk
P erson H ours R isk (= P rob. That A ctual P H W ill E xeed X -A xis V alue)
0%
10%
20%
30%
40%
50%
60%
70%
80%
90%
100%
0
20000
40000
Person Hours
60000
3
2
80000
2
100000
R = 0.9643
11
120000
y = -2E-15x + 5E-10x - 4E-05x + 1.1887
Systems Engineering Person Hours Risk
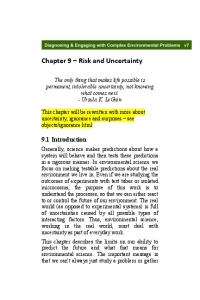
COSYSMO-R Example of Uncertainty (Risk) Representation of Systems Engineering Person Hours Risk
P erso n H o u rs Overru n R isk (=P ro b T h at T arg et P H V alu e W ill B e E xceed ed )
95% 90% 85% 80% 75% 70% 65% 60% 55% 50% 45% 40% 35% 30% 25% 20% 15% 10% 5%
0
2500
5000
10000
12500
Person Hours Overrun
7500
2
2
17500
R = 0.9643
15000
3
12
20000
y = -2E-15x + 4E-10x - 3E-05x + 0.7623
Person Hours Overrun Risk For Target Person Hours= 12729
COSYSMO-R Example of Systems Engineering Person Hours Overrun Uncertainty (Risk) Representation
Schedule Risk (=Prob. That Actual DurationWill Exceed X-Axis Value)
0%
20% 10%
30%
40%
60% 50%
70%
90% 80%
100%
0
5
2
10
Months
R = 0.8558
2
y = 0.0083x - 0.3317x + 3.1041
15
Systems Engineering Schedule Risk
20
COSYSMO-R Example of Systems Schedule Uncertainty (Risk) Representation
13
25
• The two top risk areas were found to be requirements understanding and architecture understanding. 14
– They were obtained from a survey of twenty systems engineering experts who participated in a COSYSMO workshop. The numbers in each cell represent the number of votes received by that combination.
• Example: Ten high risk scenarios are provided in the figure on the next page.
– For example, if the architecture understanding cost driver is rated “Very Low” and the “Technology Maturity” is also rated “Very Low,” then this indicates a risk.
• Pre-determined combinations of cost driver ratings can provide red flags for possible risks.
– COSYSMO can help to assess a risk profile for a project based on the combination of inputs.
• There are other approaches to the estimation of risk in systems engineering.
Future Work
Future Work, Contd.
15
16
• There is nothing as certain as uncertainty in cost estimation. • The approach implemented in COSYSMO-R is useful for assessing the uncertainty in cost estimates and in quantifying the subjectivity involved in the estimation process. • COSYSMO/COSYSMO-R can be used when doing “what if” scenarios in order to support the consideration of alternatives for project implementations. • COSYSMO/COSYSMO-R can be used to help the enforcement of a systematic methodology in doing estimation. The estimator is forced to quantify his uncertainty in the values of key parameters and have them subjected to the scrutiny of others.
Conclusions