Cost-Benefit Analysis of Separation Distances - a utility-based approach to risk management decision-making Kylefors, Martin
Published: 2001-01-01
Link to publication
Citation for published version (APA): Kylefors, M. (2001). Cost-Benefit Analysis of Separation Distances - a utility-based approach to risk management decision-making Lund University
General rights Copyright and moral rights for the publications made accessible in the public portal are retained by the authors and/or other copyright owners and it is a condition of accessing publications that users recognise and abide by the legal requirements associated with these rights. • Users may download and print one copy of any publication from the public portal for the purpose of private study or research. • You may not further distribute the material or use it for any profit-making activity or commercial gain • You may freely distribute the URL identifying the publication in the public portal ?
L UNDUNI VERS I TY PO Box117 22100L und +46462220000
Cost-Benefit Analysis of Separation Distances - a utility-based approach to risk management decision-making Martin Kylefors Department of Fire Safety Engineering Lund University, Sweden Brandteknik Lunds tekniska högskola Lunds universitet Report 1023, Lund 2001
Cost-Benefit Analysis of Separation Distances - a utility-based approach to risk management decision-making
Martin Kylefors
Lund 2001
Cost-Benefit Analysis of Separation Distances – a utility-based approach to risk management decision-making Martin Kylefors
Report 1023 ISSN: 1402-3504 ISRN: LUTVDG/TVBB--1023--SE Number of pages: 90 Illustrations: Martin Kylefors Keywords Risk management, decision-making, cost-benefit, land use planning, separation distance, risk analysis. Sökord Riskhantering, beslutsfattande, kostnad-nytta, fysisk planering, skyddsavstånd, riskanalys. Abstract Decision-making in risk management reflects a normative choice of approach. This dissertation is concerned with the possibility of putting the decision in focus by employing an optimum decision criterion within a utility-based approach. The dissertation describes a cost-benefit analysis of separation distance, a risk-reducing measure used in land use planning in the vicinity of hazardous installations and transport routes for dangerous goods. Calculations were performed employing general (i.e. average) data and the results are presented as a function of distance. The results showed that recommendations on separation distances exceeding 20 to 40 metres are difficult to motivate from an economic point of view. The issue of uncertainty was given particular consideration, and a sensitivity analysis and an explicit uncertainty analysis were performed. For a number of activities it might be necessary to employ local data and perform a specific cost-benefit analysis. The methodology for this is outlined. Based on the uncertainty analysis it was concluded that it is unlikely that a separation distance exceeding 120 metres could be motivated from an economic point of view. The findings indicate an overestimate in current recommendations from authorities. © Copyright: Brandteknik, Lunds tekniska högskola, Lunds universitet, Lund 2000.
Brandteknik Lunds tekniska högskola Lunds universitet Box 118 221 00 Lund
Department of Fire Safety Engineering Lund University P.O. Box 118 SE-221 00 Lund Sweden
[email protected] http://www.brand.lth.se
[email protected] http://www.brand.lth.se/english
Telefon: 046 - 222 73 60 Telefax: 046 - 222 46 12
Telephone: +46 46 222 73 60 Fax: +46 46 222 46 12
ii
Summary
Summary Major hazards associated with industrial and transportation activities arise from the handling of dangerous substances, such as toxic and flammable materials. The activities impose risks of catastrophic potential on people living and working nearby. These risks must be dealt with in risk management decision-making, for example in land use planning. Health and safety should be considered in all planning and building processes, according to the Swedish Planning and Building Act. Environmental impact assessments should be undertaken for activities that could have a significant impact, and risk is one such impact, according to the Swedish Environment Code. Separation distance is a measure that can be applied to reduce risk. Such distances create zones around hazardous activities where the land use is restricted. National recommendations on separation distances have been issued, for example 100 metres from roads on which dangerous goods are transported, 500 metres from transhipment centres, and 1000 metres from non-organic chemical plants. In specific cases where the issues have been discussed, different authorities have suggested different separation distances. One approach to decision-making in risk and safety matters is the rights-based approach, where the most common decision criterion is constrained risk, i.e. risks are judged “not acceptable” if they exceed certain levels of, for example, individual or societal risk. This approach has been criticized because of the difficulty in assessing acceptability in isolation, the variability in the results of quantified risk analyses and, specifically, the logical rigor of the FN format. Another approach is the utility-based approach, which is based on the valuation of possible outcomes. Within this approach cost-benefit analysis is a common method. When the problem can be specified as being dependent on one variable only, such as separation distance, the approach allows for the employment of an optimum decision criterion. Some basic features of this approach are the assumptions that the overall criterion for societal decision-making is maximum public welfare, that each individual is the best judge of his/her own welfare, and that distributional effects can be taken into account. The effects of employing separation distances have been identified. Benefit items quantified were accident risk reduction (including injuries and material damage) and noise reduction. Quantification required the valuation of a statistical life and noise exposure. These were both based on the willingness to pay approach. Other benefit items were considered but then neglected; e.g. option value, reduction in pollution levels and improvements in the environment for animals. The cost item quantified was opportunity cost of land. A few other cost items were explored but rejected. Based on an economic lifetime of 40 years and a 5 percent discount rate, the benefit-cost ratio was calculated as a function of distance. The optimum was defined as being when the benefits equal the costs, based on the Hicks-Kaldor criterion of economic efficiency. Calculations were based on general (average) data on individual risk, noise levels, population densities and exposure index, and differentiated for various land prices. The results showed that separation distances greater than 20 to 40 metres range could not be economically motivated on an average. This suggests that the separation distances recommended in Sweden are too generous and ought to be reviewed. However, the variability in the calculated benefitcost ratios was large, which may motivate greater separation distances in specific cases. Based on the explicit uncertainty analysis it seemed highly unlikely that a separation distance exceeding 120 metres could be economically motivated in any situation (in order to reduce accident risks; other benefits might be considered). A methodology for cost-benefit analysis in a specific case was outlined.
i
Cost-Benefit Analysis of Separation Distances
In conclusion, separation distances seem to be ineffective as a risk-reduction measure. This can be explained by the hazardous substances causing the risks. Accidents involving toxic substances are so rare that separation distances are hardly justified. Such accidents can affect large areas and separation distances would not be of much use in such cases. Accidents involving flammables are more frequent, but the area affected is usually limited, which means that only short separation distances are of any use.
ii
Sammanfattning (Summary in Swedish)
Sammanfattning (Summary in Swedish) Verksamheter (industri och transporter) som är farliga för omgivningen beror på hantering av farliga ämnen, såsom giftiga och brandfarliga ämnen. Verksamheterna innebär risker med katastrofpotential för människor i närområdet. Dessa risker måste hanteras i beslutsfattande om riskhantering, och särskilt i frågor om fysisk planering. Hälsa och säkerhet måste enligt Planoch Bygglagen övervägas i all planering och byggnation. Miljökonsekvensbeskrivningar måste enligt Miljöbalken genomföras för verksamheter som skulle kunna ha en signifikant miljöpåverkan, och olycksrisker hör till sådan påverkan. Skyddsavstånd är en åtgärd som är möjlig att vidta för att minska riskerna. Dessa avstånd skapar en zon kring de farliga verksamheterna med restriktioner i markanvändningen. Nationella rekommendationer för skyddsavstånd har utfärdats, bland annat 100 meter från transportleder för farligt gods, 500 meter från omlastningscentraler, och 1000 meter från oorganisk kemisk industri. I specifika fall där frågorna har diskuterats har olika myndigheter förespråkat varierande skyddsavstånd. Ett förhållningssätt till beslutsfattande i risk- och säkerhetsfrågor är det rättighetsbaserade, där det vanligaste beslutskriteriet är begränsad risk, dvs risker bedöms som ”icke acceptabla” om de överskrider vissa nivåer av t ex individrisk eller samhällsrisk. Detta förhållningssätt har blivit kritiserat p g a svårigheterna att bedöma acceptans för sig, variabiliteten i resultatet av kvantitativa riskanalyser samt, mer specifikt, den logiska konsistensen av FN-kurvan som format. Ett annat förhållningssätt är det nyttobaserade, som baseras på en värdering av olika utfall. Inom detta förhållningssätt är kostnad-nytto analys en vanlig metod. När ett problem kan specificeras till att bero på endast en variabel, som skyddsavstånd, är det möjligt att lösa med optimering. Några grundläggande egenskaper hos det nyttobaserade förhållningssättet är antaganden att det övergripande kriteriet för samhälleligt beslutsfattande är maximal välfärd, att individer bäst bedömer sin egen välfärd, och att fördelningseffekter kan tas med i beräkningarna. Följderna av att använda skyddsavstånd identifierades. Nyttoposter som kvantifierades var reduktion av olycksrisker (där även skador på människor och förstörd egendom beaktades) och buller. Kvantifieringen krävde en värdering av ett statistiskt liv och bullerexponering, vilket gjordes med en betalningsviljeansats. Andra nyttoposter som övervägdes men inte togs med var optionsvärde, luftföroreningar och förbättringar i den lokala miljön för djur. Den kostnadspost som kvantifierades var alternativkostnaden för mark. Ett par andra kostnadsposter övervägdes men förkastades. Baserat på en ekonomisk livslängd om 40 år och en diskonteringsränta om 5 procent beräknades kvoten nytta genom kostnad som en funktion av skyddsavstånd. Optimum definierades som när nyttor och kostnader var lika stora, grundat i Hicks-Kaldor kriteriet för ekonomisk effektivitet. Beräkningarna baserades på generella (genomsnittliga) data på individrisk, bullernivåer, befolkningstäthet och exponeringsindex, och differentierades för olika markpriser. Resultaten visade att skyddsavstånd över intervallet 20 till 40 meter i genomsnitt inte går att motivera ekonomiskt. Detta indikerar att de skyddsavstånden som rekommenderas i Sverige är för stora och borde revideras. Dock befanns variabiliteten i kostnads-nytto kvoten vara stor, vilket tolkades som att det i enskilda fall kan vara berättigat med större skyddsavstånd. Baserat på osäkerhetsanalysen verkar det dock osannolikt att ett skyddsavstånd överstigande 120 meter i något fall skulle kunna motiveras ekonomiskt (för att reducera olycksrisken; andra nyttor kan behöva övervägas ytterligare). Beskrivningar för hur kostnads-nytto analysen kan göras i specifika fall gavs.
iii
Cost-Benefit Analysis of Separation Distances
Sammanfattningsvis verkar skyddsavstånd vara en ineffektiv riskreducerande åtgärd. Detta kan förklaras med de ämnesgrupper som ger upphov till riskerna. Olyckor med giftiga ämnen (t ex kondenserade gaser) är så lågfrekventa att de knappast motiverar skyddsavstånd. Olyckorna kan vidare få stor utbredning, varför skyddsavstånd troligen inte gör så mycket nytta. Olyckor med brandfarliga ämnen är mer frekventa, men utbredningen på dessa olyckor är i de flesta fall begränsat, vilket innebär att endast kortare skyddsavstånd gör nytta.
iv
Table of contents
Table of contents SUMMARY............................................................................................................................................................ 1 SAMMANFATTNING (SUMMARY IN SWEDISH).......................................................................................iii TABLE OF CONTENTS ...................................................................................................................................... v ABBREVIATIONS .............................................................................................................................................vii NOMENCLATURE ...........................................................................................................................................viii 1.
INTRODUCTION ....................................................................................................................................... 1 1.1 1.2 1.3
2.
BACKGROUND .......................................................................................................................................... 3 2.1 2.1.1 2.1.2 2.2 2.2.1 2.3 2.3.1 2.3.2 2.3.3 2.4 2.4.1 2.4.2 2.4.3 2.4.4
3.
OBJECTIVES AND APPROACH ................................................................................................................. 1 OVERVIEW OF THE DISSERTATION ......................................................................................................... 2 LIMITATIONS ......................................................................................................................................... 2 THE HAZARDS ....................................................................................................................................... 3 Objective representation of the risks ............................................................................................... 3 Public perception of risks ................................................................................................................ 4 RISK ANALYSIS PRACTICE ..................................................................................................................... 5 Risk analysis practice in Sweden ..................................................................................................... 6 THE USE OF SEPARATION DISTANCES..................................................................................................... 7 Regulations ...................................................................................................................................... 7 Recommendations............................................................................................................................ 7 Planning situations .......................................................................................................................... 8 PREVIOUS STUDIES ................................................................................................................................ 9 QRA of handling of dangerous substances in the UK...................................................................... 9 Transport of dangerous goods in Sweden...................................................................................... 10 Application of benefit-cost ratios to risk-reducing measures ........................................................ 10 Application of MAUA in land use planning and major hazards.................................................... 11
DECISION-MAKING IN MATTERS OF RISK AND SAFETY.......................................................... 13 3.1 DECISION-MAKING IN GENERAL .......................................................................................................... 15 3.2 THE RIGHTS-BASED APPROACH ........................................................................................................... 16 3.2.1 Acceptability .................................................................................................................................. 16 3.2.2 Variability...................................................................................................................................... 17 3.2.3 Logical rigor.................................................................................................................................. 17 3.3 THE UTILITY-BASED APPROACH .......................................................................................................... 17 3.3.1 Defining society ............................................................................................................................. 18 3.3.2 Economic efficiency and welfare ................................................................................................... 19 3.3.3 Multi-attribute utility analysis ....................................................................................................... 20
4.
COST-BENEFIT ANALYSIS................................................................................................................... 23 4.1 METHODOLOGY FOR COST-BENEFIT CALCULATIONS ........................................................................... 23 4.2 DECISION RULES ................................................................................................................................. 24 4.2.1 Net present value ........................................................................................................................... 24 4.2.2 Benefit-cost ratio ........................................................................................................................... 24 4.2.3 Internal rate of return.................................................................................................................... 25
5.
APPLICATION TO SEPARATION DISTANCES ................................................................................ 27 5.1 MARKET CONDITIONS ......................................................................................................................... 27 5.1.1 Impact of separation distances on the market model..................................................................... 28 5.2 THE DECISION PROBLEM ...................................................................................................................... 30 5.2.1 Decision options ............................................................................................................................ 30 5.2.2 Choice of decision rule .................................................................................................................. 32
v
Cost-Benefit Analysis of Separation Distances 5.3 5.3.1 5.4 5.5 5.5.1 5.5.2 5.5.3 5.5.4 5.5.5 5.6 5.6.1 5.6.2 5.6.3 5.6.4 5.6.5 5.7 5.8 6.
TIME HORIZON .................................................................................................................................... 33 Economic lifetime .......................................................................................................................... 34 BENEFIT AND COST ITEMS ................................................................................................................... 35 THE BENEFITS ..................................................................................................................................... 36 Reduction in death risk .................................................................................................................. 36 Reduction in injuries and property damage................................................................................... 39 Reduction in noise exposure .......................................................................................................... 40 Reduction in air pollution exposure............................................................................................... 43 Other benefits ................................................................................................................................ 45 THE COSTS .......................................................................................................................................... 46 Opportunity costs........................................................................................................................... 46 Planning, design and construction costs ....................................................................................... 47 Management costs ......................................................................................................................... 48 Other costs..................................................................................................................................... 48 Comments on non-quantifiable effects........................................................................................... 48 DISCOUNT RATE .................................................................................................................................. 49 COMMENTS ON COST-EFFECTIVENESS ANALYSIS................................................................................. 50
RESULTS ................................................................................................................................................... 51 6.1 CBA OF SEPARATION DISTANCES IN GENERAL .................................................................................... 51 6.1.1 Defining general parameters and variables .................................................................................. 52 6.1.2 CBA for all benefits ....................................................................................................................... 57 6.1.3 CBA for accident risk reduction only ............................................................................................ 58 6.2 UNCERTAINTY..................................................................................................................................... 59 6.2.1 Sensitivity analysis......................................................................................................................... 59 6.2.2 Risk aversion ................................................................................................................................. 61 6.2.3 Explicit uncertainty analysis.......................................................................................................... 63 6.3 DISTRIBUTIONAL EFFECTS ................................................................................................................... 65
7.
CONCLUSIONS AND DISCUSSION ..................................................................................................... 67 7.1 THE UTILITY-BASED APPROACH .......................................................................................................... 67 7.2 THE USE OF SEPARATION DISTANCES................................................................................................... 67 7.2.1 Separation distances in general..................................................................................................... 67 7.2.2 Separation distances in specific cases ........................................................................................... 68 7.3 FUTURE WORK AND RESEARCH ........................................................................................................... 69
ACKNOWLEDGEMENTS ................................................................................................................................ 71 REFERENCES .................................................................................................................................................... 73
vi
Abbreviations
Abbreviations ACDS ALARP BanV BoV CBA FN NVV PLL QRA SIKA SRV VägV WTA WTP
Advisory Committee on Dangerous Substances (UK) As low as reasonably practicable The Swedish National Rail Administration National Board of Housing, Building and Planning (Sweden) Cost-benefit analysis Frequency of number (a measure of societal risk) The Swedish Environmental Protection Agency Potential loss of life Quantitative risk analysis The Swedish Institute for Transport and Communications Analysis The Swedish Rescue Services Agency The Swedish National Road Administration Willingness to accept Willingness to pay
vii
Cost-Benefit Analysis of Separation Distances
Nomenclature A bt B BTA ct C ε G γ IR ki kp k(r) l λ MB MC N NL NPV p PL PV q r ρ t T TY TUF UF u(NL) v w(PL) x x0
area of safety zone, m2 benefits (in monetary units) year t benefits, total building gross area, m2 costs (in monetary units) year t costs, total exposure index benefit-cost ratio (B/C) utilization coefficient individual risk factor in IR generalization coverage factor discounting coefficient coefficient of the average relationship between the total value of injuries plus property damage and lives lost factor in IR generalization marginal benefits marginal costs number of people equivalent noise level, dB(A) net present value land price (in some cases ‘price’ in general) pollution level present value quantity discount rate population density year index economic lifetime, time horizon total land area, m2 total uncertainty factor uncertainty factor value of a person exposed to noise level NL value of a statistical life value of a person exposed to pollution level PL separation distance variable specific separation distance
All values are expressed in SEK (2000), unless otherwise stated.
viii
Introduction
1. Introduction The risks associated with major hazards due to industrial activities and the transport of dangerous substances have been highlighted in the past decade. In land use planning the location of industries, transport routes, commercial areas and nearby housing and other premises are considered. The possibility of reducing the risks is discussed. A common topic of discussion is the employment of separation distances, i.e. restrictions in the land use around hazardous activities. Risk analysis can be employed in such land use planning as an objective aid in decision-making. When employing a rights-based approach, risks are quantified as individual or societal risk and are compared with a (supposedly) predetermined level of acceptable risk. If the risks do not meet the criteria, the project is rejected. The possibility of setting Swedish levels of acceptability, as in the UK and the Netherlands, has been investigated and criteria have been suggested (Davidsson, Lindgren & Mett, 1997). The acceptability of risk is, however, a complex issue, and the rights-based approach has been accused of having some deficiencies, such as the concept of acceptability, the variability in the results, and the logical rigor of the FN format specifically (FN being the frequency of number curve; see further in Section 3.2). An alternative to the rights-based approach is the utility-based approach, in which the basic assumption is that all decisions involve trade-offs, especially in risk and safety decisions. Instead of isolating the risks and judging the acceptability, an analysis of the costs and benefits of activities or risk-reducing measures can be performed. This allows the acceptability of trade-offs and social welfare to be assessed, as well as providing optimum rather than satisfactory decision criteria. It is recognised that the definitions of hazard and risk can vary within the multidisciplinary domain of risk research. In this dissertation the definitions in IEC (1995) are employed: •
Hazard: Source of potential harm or a situation with a potential for harm.
•
Risk: Combination of the frequency, or probability, of occurrence and the consequence of a specified hazardous event.
Since other definitions are also in circulation the use of these definitions throughout the dissertation may be not entirely consistent.
1.1 Objectives and approach One of the two main objectives of this study was to determine the possibility of focusing on decision in major hazard decision-making, employing an optimum rather than a satisfactory decision criterion. This was done in a utility-based approach. The second objective was to investigate the costs and benefits associated with the current implementation of separation distances in Swedish land use planning. In performing the study the following aspects were specifically addressed: (a) The results of the cost-benefit calculations were expressed as a continuous function, rather than as measures of a few, chosen alternatives. (b) The concept of risk aversion in the case of major accidents was considered. (c) Uncertainty in the calculations was explicitly addressed.
1
Cost-Benefit Analysis of Separation Distances
The calculations focused on decision-making at the national level and hence generic data was employed. The intention is, however, to present a methodology that can also be adopted at the local level using more specific data.
1.2 Overview of the dissertation Chapters 2 to 4 are introductory chapters, presenting the framework of the study. In Chapter 2 the context of the problem is defined, i.e. the hazards and the current practice of employing risk analyses and separation distances in Sweden. Previous work in the domain is also described. Theories of decision-making are presented in Chapter 3, together with a scrutiny of the rights-based approach. Basic assumptions in the utility-based approach that have implications for the cost-benefit analysis (CBA) are also discussed. The concepts of society, economic efficiency and welfare are also presented. A separate chapter is devoted to CBA, Chapter 4, to introduce the methodology and the available decision rules. The major part of the work is divided between Chapters 5 and 6. In Chapter 5 the decision options are presented, a decision rule is chosen, assumptions on basic parameters are made and cost and benefit items used in the CBA are identified, and to some extent, quantified. In Chapter 6 the benefit and cost items are quantified by employing average data and the overall results obtained are presented. Uncertainty is explicitly addressed, including sensitivity analysis, risk aversion and explicit uncertainty analysis. Distributional effects are discussed. Finally, in Chapter 7, an interpretation of the results is given and discussed, and the comprehensive objectives of the study are examined. Suggestions for future work and research are also made. It should be noted that one part of this work involved an interview study, presented in Harrami, Kylefors and Magnusson (2000a and 2000b). This study had two aims: •
To improve knowledge concerning the current practice of risk analysis in Sweden, with a focus on incentives and objectives, and employment of the results.
•
To explore questions regarding the concept of quality, quality assurance and various quality aspects of risk analysis.
Some of the findings from this study are presented in Section 2.2.1.
1.3 Limitations The risks associated with industrial activities and transport considered in this study are limited to the consequences of immediate effects. Protracted consequences, such as the risk of cancer, are excluded. No calculations have been made regarding measures that could be regarded as competitive or complementary decision options to separation distances (e.g. dikes, walls, alarm systems and ventilation control).
2
Background
2. Background The hazards considered in this study are industrial and transportation activities, where dangerous substances are handled. This chapter presents the framework for the study. Firstly, the risks associated with these hazards are characterized. Secondly, a brief description of the practice of risk analysis, internationally and in Sweden, is given. Thirdly, the current use of separation distances in Sweden (together with regulations and recommendations) is explored. Finally, the most relevant previous studies are discussed.
2.1 The hazards The hazards associated with the handling of dangerous substances have the potential to cause a wide range of accidents, depending on the specific substance. The negative effects can be grouped and defined by the generic properties of the substances, e.g. toxicity and flammability. Lack of control in the handling of such substances may lead to fires, explosions or toxic gas release. The consequences may be catastrophic and places where such accidents have occurred are quite well known. Flixborough, Bhopal, Seveso and Herborn are etched in history because of tragic accidents involving hazardous substances, which lead to many casualties or environmental damage. Sweden has so far been spared from such catastrophes, although in recent years a number of potentially very serious incidents have occurred. Derailments in Kävlinge (1996) involving ammonia, and in Kälarne (1997) involving acetic acid, ammonia and ethylene oxide, are well known. See, for example, Larsson (1996) and Haverikommissionen (2000). The LPG incidents in Stockholm (1998) and Borlänge (2000) are also well known. See, for example, Eksborg and Mansfeld (1999) and Nord (1998).
2.1.1 Objective representation of the risks According to the governmental report “A safer society” (SOU 1995:19) the number of accidents involving hazardous substances (with more than three casualties) in ten industrial countries in the years 1954-1991 was 170, resulting in 1464 casualties and 3662 injuries. This is equivalent to a yearly average of 4 accidents, resulting in 39 casualties and 96 injuries. These figures must be related to the number of inhabitants in the ten countries to obtain the rate per capita. The number of inhabitants in these countries is about 670 million (according to 1998 and 1999 figures in the Swedish National Encyclopaedia; NE, 2001), which results in an annual rate of 1 death per 17 million inhabitants and 1 injury per 7 million inhabitants (“average individual risk”). These figures were obtained assuming no change in the rate of deaths and injuries for the years 1998-1999. See further in Section 5.5.2. Accidents involving hazardous substances may also have consequences for the environment and for property. Whereas the damage to property can be fairly easily calculated, as it is possible to replace most materials (although not sentimental or cultural value), the assessment of the cost of environmental damage is far more complex. The result is often a broad range and the valuation of various ecological effects is the subject of debate. Suter (1993) suggested that both biological and societal relevance should be taken into account and stressed the need to consider the different spatiotemporal scales (the varying extension in time and space). In conclusion, the average rate of death and injury seems to be low, but the average number of deaths and injuries per accident seems to be high, 9 and 25, respectively. 3
Cost-Benefit Analysis of Separation Distances
2.1.2 Public perception of risks Slovic (1987, p. 283) states that “conflicts of risk may result from expert and lay people having different definitions of the concept”. The public perception of risks can vary significantly from that of experts. A great deal of work has been done by researchers within psychometrics (a branch of science in itself) to understand what constitutes the apprehension of different risks, e.g. Slovic (2000) and Sjöberg (1991, 1994 and 1996). Values other than the expected number of fatalities come into question. Research deals with differences in risk perception between different populations and differences in the perception of different risks. The influence of the media on risk perception is also of interest (Sjöberg & Wåhlberg, 1997). Surveys comparing lay people’s judged frequencies of death with statistical estimates show that risks with low death frequencies, such as botulism, often are overestimated, whereas risks with high death frequencies, such as stroke and diabetes, are underestimated (Royal Society, 1992). The relationship between risk perception and risk analysis is under development and a special issue of Reliability Engineering and System Safety (1998) has been devoted to it. Hansson (1989) proposed eight “dimensions” that can be used for risk comparisons, and these may provide a good starting point from which to better understand the risks dealt with in this study. Hansson’s dimensions are written in italics below. The character of the negative consequences includes death and injuries; the specific effects vary between the substances involved and may be difficult to understand or imagine in some cases. Fire and explosion can cause lethal burns and pressure-induced injuries. Gas and vapour releases can, for example, be poisonous, affect breathing organs or cause oedema. The degree of control and free choice is regarded as moderate since most people are exposed as the result of others handling the substances. In the dimension of individual and collective perspectives, these risks are considered to be basically collectively shared, since everybody is exposed to them to various degrees. Regarding large disasters and probability, the risks considered have a catastrophic potential but at a low probability. There are differing views on whether the disaster potential should be used to correct the probability of a risk, and in which way. It is commonly argued that more weight should be given to a risk with disaster potential (risk aversion), than to a risk without disaster potential, even though they present the same expected average rate of deaths. The time factor is rather short considering that, in most cases, the negative consequences are immediate and local, but long for systems used for production, transportation and handling of hazardous substances. The risks are structurally built into society, as a great deal of money has been invested in such systems. However, society is also subject to technological change which may change the situation. There are many decisions under uncertainty since the risks are not completely known. Considering the last two dimensions, new and old risks and availability of knowledge, these risks are not new, and the availability of knowledge may be regarded as moderately good. The Royal Society (1992) refers to eleven negative attributes of hazards that influence risk perception and acceptance (adopted from Otway and von Winterfeld, 1982). Of these, six may be considered as highly relevant attributes (A-F) and three as relevant attributes (g-i) to the risks considered in this study. They are: A. B. C. D.
Lack of personal control over outcomes Lack of personal experience with the risk (fear of the unknown) Infrequent but catastrophic accidents (“kill size”) Benefits not highly visible
4
Background
E. Benefits to others F. Accidents due to human failure, rather than natural causes (g) Involuntary exposure to a risk (h) Difficulties in imagining risk exposure (i) Uncertainty about probabilities or consequences of exposure In conclusion, it can be noted that the perception of risks associated with the handling of hazardous substances is subject to some bias, which means that the objective representation of risks does not entirely reflect the public notion of the same risks.
2.2 Risk analysis practice In attempts to standardise risk analysis an international standard for risk analysis was issued by the International Electrotechnical Commission (IEC, 1995). Some countries have developed national standards, e.g. Norway (NS 5814, 1991) and Denmark (DS/INF 85, 1993). According to Pitblado (1996) the quality standard ISO 9001 is also applicable when performing a risk analysis. The relationship between risk analysis and other risk management activities according to the IEC standard is presented in Figure 2:1.
Risk analysis * Scope definition * Hazard identification * Risk estimation
Risk assessment
Risk evaluation Risk management
* Risk tolerability decisions * Analysis of options
Risk reduction/control * Decision making * Implementation * Monitoring Figure 2:1. A simplified relationship between risk management activities according to IEC (1995).
In reality, these standards have not been found to be that applicable so far. Also, different businesses have different practices for both risk analysis and the implementation of analyses in decision-making, as concluded at a workshop organized by the European Commission (Kirchsteiger & Cojazzi, 2000). Businesses represented were the chemical process industry,
5
Cost-Benefit Analysis of Separation Distances
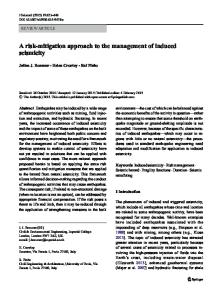
the nuclear industry, the construction industry, the offshore oil and gas industry, and the waste and transportation sectors. In the case of land use planning, Smeder, Christou and Besi (1996) have given an overview of the approaches of different European countries to major hazards. The member states were broadly categorised as “risk-oriented” or “consequence-oriented”. In the “risk-oriented” approach typical results give areas with a given probability of a specified level of harm. Most countries, however, employ the “consequence-oriented” approach, where typical results give areas for lethal effects and serious injuries from assessed scenarios. Belgium, The Netherlands, Denmark and the UK represent countries that employ the “risk-oriented” approach. The Netherlands is often referred to as the most risk-oriented country (e.g. Davidsson et al., 1997) and has established quantitative criteria for the evaluation of major hazards (both individual and societal risk criteria). Guidelines for quantitative risk analysis (QRA) have been presented, based on these criteria (Uijt de Haag, Ale & Post, 1999). The QRA methodology has been presented frequently, see, for instance CCPS (1989). The most common risk measures for individual risk are individual risk profiles (graphs of individual risk as a function of distance) and individual risk contours (closed curves of equal risk values superimposed over a local map). The most common risk measures for societal risk are FN curves (a graph of the cumulative probability or frequency distribution of events causing N or more fatalities, see Figure 2:2) and potential loss of life (PLL, an expected number of annual deaths, which is an average value). 1,00E-02 1,00E-03
F (1/yr)
1,00E-04 1,00E-05 1,00E-06 1,00E-07 1,00E-08 1
10
100
1000
N - number of fatalities
Figure 2:2. The FN format employed to present the result of a QRA. The curve displays the cumulated frequency (or probability) of N or more fatalities.
2.2.1 Risk analysis practice in Sweden According to Harrami et al. (2000a & 2000b) the main incentive for performing a risk analysis is legal requirements, and the objective of the analysis is to fulfil these requirements. The requirements can be found in several laws and ordinances, e.g. the Rescue Services Act and Ordinance (Räddningstjänstlagen, 1986, and Räddningstjänstförordningen, 1986) and the Planning and Building Act (Plan- och bygglagen, 1987). The most general requirements in the legislation refer to (i) any activity that can lead to accidents which could cause serious harm
6
Background
to humans or the environment, or (ii) any land use planning decision or licensing decision where the activity may have an environmental impact (safety is included in the definition of environment). Qualitative techniques are used most often, while QRAs are still rare. Local authorities consider it difficult to understand or accept probabilistic approaches hence concentrate on the consequences. In matters of tolerable and acceptable risk, especially community planning, the difficulties in communicating the results were immense, according to the risk owners and analysts. The matter most discussed in regard to evaluation of the analyses was risk-reducing measures. Davidsson et al. (1997) investigated the use of risk criteria and put forward suggestions for both individual and societal criteria for Sweden (regarding major industrial hazards and transport activities). The aims of the criteria are to facilitate the evaluation of hazardous activities or installations and to facilitate communication of the results of risk analyses. Since transportation activities are extended geographically the criteria can only be applied to a limited route; this was set to 1 kilometre (for other route lengths the criteria can easily be proportionally transformed).
2.3 The use of separation distances Current practice in the implementation of separation distances can be traced to recommendations from authorities and from planning situations where disagreement on the length of such distances has occurred.
2.3.1 Regulations The Planning and Building Act regulates land use planning and building, and states that the health and safety of people should be considered in all planning and building processes. In Sweden, the municipalities prepare and establish the plans after public consultation. The plans can be stopped by the County Administrative Boards or appealed to them, and further to the Swedish Government. The Environment Code (Miljöbalken, 1998) provides guidelines for environmental impact assessments (EIA) which should be undertaken for activities that could have a significant impact. EIAs are employed as decision support for licensing and sometimes planning. Effects on people’s health (also including safety) are considered important when applicable. No specific separation distances are given in either of the regulations. The Road Act (Väglagen, 1971) prohibits the erection of new buildings within twelve metres of a road, unless the County Administrative Board gives its permission. The distance is chosen from a traffic safety perspective, and can be extend to 50 metres if necessary.
2.3.2 Recommendations The National Board of Housing, Building and Planning (Boverket, BoV) recommends 100 metres as the separation distance from infrastructures where dangerous goods are transported in connection with industrial areas (Boverket, 1995). Regarding transhipment centres where dangerous goods are transhipped or directed the recommendation is 500 metres. These recommendations have been produced in cooperation with the Swedish Environmental
7
Cost-Benefit Analysis of Separation Distances
Protection Agency (Naturvårdsverket, NVV), the Swedish Rescue Services Agency (Räddningsverket, SRV) and the National Board of Health and Welfare (Socialstyrelsen). For other industrial facilities different separation distances are recommended. Examples are given in Table 2:1. All these recommendations are based on joint considerations of the effects on safety, health and environment, and refer to distances between establishments and housing that would yield non-problematic situations. In a subsequent publication (Boverket et al., 2000) separation distances are given as one example of risk-reduction measures. Table 2:1. Recommendations for separation distances for various activities (Boverket, 1995) Activity / establishment
Separation distance (m)
Paper industry
500 or 1000
Oil refinery
1500
Non-organic chemical industry
1000
The Swedish National Road Administration (Vägverket, VägV) refers to the BoV recommendation (Boverket, 1995) and in turn recommends a separation distance of 100 metres between housing and roads where dangerous goods are transported (Vägverket, 1997). VägV emphasizes the need to take precautionary measures in the early phase of land use planning bearing in mind the relatively small cost at that stage. If a separation distance of less than 100 metres is to be used VägV recommends a risk analysis be performed. The National Inspectorate of Explosives and Flammables has issued an extensive list of recommendations on separation distances for different premises (SIND-FS 1981:2); the longest recommendation being 100 metres. The recommendations refer to establishments where flammable materials are handled or stored in certain quantities. All distances are minimum distances, and as a rule of thumb they need not exceed twice those distances. The County Administrative Board of Stockholm has issued recommendations regarding separation distances in the transport of dangerous goods by road and rail, and in the cases of petrol stations (Länsstyrelsen i Stockholms län, 2000). The recommendations are presented in Table 2:2. For the establishment of new petrol stations the recommendation is 100 metres to housing and certain care facilities. Table 2:2. Recommendations for separation distances made by the County Administrative Board of Stockholm Road
Rail
Petrol station
Housing and occupations involving several people
75
50
50
Offices with many workers
40
25
25
2.3.3 Planning situations BoV presented five actual planning cases in which industries and housing were in conflict and where separation distances were discussed (Boverket, 1990). In one of the cases, the opinions regarding a relevant separation distance varied between 80 and 300 metres (adding provisions on building within another 300 m). In another case, the building of a sports arena 400 metres away from an ammonia handling facility was cancelled. BoV described how six municipalities took risk into consideration in different planning situations and how their work was organised (Boverket, 1992). Separation distance was one of the proposed measures. 8
Background
Other recent planning situations that have been discussed: (a) The area of Norra Älvstranden in Gothenburg. This case has been commented upon several times, e.g. SOU 1995:19 (“A Safer Society”) and Davidsson et al. (1997), and is concerned with the renewal of an industrial area to provide housing, beside a railway track along which dangerous goods are transported. The authorities involved reached divergent conclusions. The municipality planned a zone of 100 metres beside the track as a separation distance, but most of the other authorities argued for a 200-metre separation distance. (b) The area of Norra Strandvägen in Stenungsund. This case has been presented by Persson (1998). It is concerned with housing in an area that could be affected in the case of an accident at a nearby petrochemical plant. The case revealed discrepancies in views on how to measure separation distances – from planning boundaries or from actual activities. (c) The area of Svågertorp in Malmö. The Malmö Fire Brigade performed a QRA of the Svågertorp area, situated next to the ring road, Yttre Ringvägen, in Malmö (Malmö Brandkår, 1999). Based on the QRA it was proposed that no buildings should be allowed within 60 metres, and that restrictions should be placed on activities in the zones 60 to 200 and 200 to 600 metres. The risks arise from the transportation of dangerous goods.
2.4 Previous studies The risks associated with the transport of dangerous goods and various risk-reducing measures have been studied previously. In this section the most relevant studies and findings will be summarised.
2.4.1 QRA of handling of dangerous substances in the UK Inadequate accident records led the Advisory Committee on Dangerous Substances to perform a QRA of the handling of dangerous substances in the UK (airports, pipelines and radioactive materials excluded) (ACDS, 1991). The study was divided into three parts: 1) Transport by rail and road of toxic and flammable substances, represented by ammonia, chlorine, LPG and petrol 2) Transport by rail and road of explosives 3) Handling at harbours Besides the aim of quantifying the associated risks the purpose was to compare the risk levels of rail and road to determine whether any recommendations or instrumental control ought to be used to reduce risks. The findings were basically, (i) it was not possible to say in general whether rail or road was safer for the transport of any substance and (ii) using the ALARP criteria (As low as reasonably practicable; see Figure 2:3), no risks were intolerable and few were negligible. The conclusion was therefore drawn that cost-benefit calculations of different risk-reducing measures were needed.
9
Cost-Benefit Analysis of Separation Distances
F - frequency of N or more fatalities (1/yr)
1,00E+00
1,00E-01
1,00E-02
Intolerable
1,00E-03
1,00E-04
ALARP region
1,00E-05
Neglible 1,00E-06 1
10
100
1000
10000
N - number of fatalities
Figure 2:3. Societal risk criteria in the UK applied in the ACDS study (ACDS, 1991). The criteria were employed at the national level and modified for identifiable communities or at the local level.
2.4.2 Transport of dangerous goods in Sweden The Swedish Road and Transport Research Institute conducted a major research project on the transport of dangerous goods with the purpose of producing a methodology that would make it possible to estimate probabilities, consequences and expected social economic costs of specific transportation tasks (Lindberg & Morén, 1994). The intention was that the methodology would be used in choosing local transportation solutions. SRV has produced a handbook based on this methodology that allows for specific risk comparison of different transport alternatives (Räddningsverket, 1996). Of most interest in the present study are the results presented by Svarvar and Persson (1994), where a method for calculating the social cost of accidents involving dangerous goods was developed. It was exemplified by calculations concerning ammonia and petrol accidents, which resulted in expected average costs of nine and one million SEK (1994 prices), respectively. Svarvar and Persson also performed some cost-effectiveness calculations; one of which indicated that a separation distance of 30 metres was not effective. The analysis was however limited to one substance (ammonia) and one measure (a separation distance of 30 metres), and it was not possible to tell from the result how effective the measure was.
2.4.3 Application of benefit-cost ratios to risk-reducing measures When planning an extension of the rail track between Lund and Kävlinge in southern Sweden to a dual track, the Swedish National Rail Administration (Banverket, BanV) commissioned the Det Norske Veritas (DNV; a consultancy company) to carry out a CBA of possible protection measures, focusing on those living round the tracks. DNV (1995) presented quantitative assessments of two measures, constructed dikes and an extended expropriation of nearby houses. The cost efficiency factor, CEF, was calculated as:
10
Background
40
CEF =
Si
∑ (1 + r ) i =1
40
I0 + ∑ i =1
where
i
Mi (1 + r ) i
Si = Societal savings in year i I0 = Investment Mi = Maintenance cost in year i
and resulted in values of 0.002 for expropriation and 0.01 for constructed dikes. The analysis suggests that the measures were not beneficial. It should be noted that the analysis was performed for a specific case and that it was assumed that the only saving was due to a reduction in the average, expected, fatality rate, and that the costs were for construction only.
2.4.4 Application of MAUA in land use planning and major hazards Papazoglou, Bonanos and Briassoulis (2000) presented a methodology, and an application, where multi-attribute utility analysis (MAUA; further explained in Section 3.3.3) was employed to support decisions on land development in the vicinity of a major hazard. The input consisted of three criteria regarding safety and one criterion regarding benefits in terms of economic development. The land was divided in cells (300 by 300 metres) and for each cell different land use patterns were defined (commercial, industrial, recreational, restricted or blocked). Efficient frontiers were calculated by dynamic programming. The methodology allows for the consideration of local particularities, optimum solutions and value trade-offs at the end of the analysis but, on the other hand, is cumbersome and confusing due to the extremely high number of alternatives and the high number of efficient solutions.
11
Cost-Benefit Analysis of Separation Distances
12
Decision-making in matters of risk and safety
3. Decision-making in matters of risk and safety Granger Morgan and Henrion (1990) asserted that every policy analysis is performed within a certain philosophical framework that reflects a normative choice. Criteria for decision-making in risk management policy issues can be categorised into three approaches: (a) Rights-based approach Criteria within this approach are zero risk, bounded or constrained risk, approval/compensation or approved process. Zero risk is a strategy which can only be employed for new technologies (assuming that all technologies should not be introduced just because it is possible; cf. the precautionary principle). Constrained risk is the most common criterion, setting levels of risk that should not be exceeded, and its deficiencies are further examined in Section 3.2. The approval/compensation criterion allows risks to be imposed on people only if voluntarily consent is given (perhaps after compensation). The approved process criterion is a hybrid criterion as it allows for many involved parties to apply their own criterion and the decision reached will be acceptable, once the process has been accepted. (b) Utility-based approach This approach (which is further examined in Section 3.3 and applied throughout the present work) is based on valuation of the outcomes, and includes criteria such as costbenefit, cost-effectiveness, bounded cost and multi-attribute utility. The cost-benefit criterion balances costs and benefits, whereas the cost-effectiveness criterion is the cheapest way to attain a certain level of performance. Bounded cost is a budget-constraint strategy, i.e. doing the best possible with limited resources. Multi-attribute utility is a more general form of cost-benefit where all effects need not be expressed in monetary values. (c) Technology-based approach The criterion used is the best available technology (BAT) criterion, most widely used in environmental regulation. The criterion focuses on the technical feasibility both in safety design and in risk-reducing measures, and assumes that all measures possible (defined by technical capability) are undertaken. This strategy is seldom pure, as available technology generally has a strong link to affordability. It is recognised that hybrid criteria exist; e.g. the ALARP criteria employed in the UK are a combination of bounded risk (at the upper limit of acceptability) and cost-benefit criterion (below the upper limit). It is also recognised that political considerations, for example, call for criteria that minimize the probability of the worst possible outcome, or maximize the chances of the best possible outcome. Employing the technology-based approach in the area of this study would possibly result in an investigation of the shaping of areas next to risk-imposing activities. However, this approach would probably be employed in other decision frames such as the construction of establishments (pipes, tanks, road and rail, train and trailer construction, etc.). A parallel can be drawn between the categories above and ethics. The two main ethical principles are obligation ethics and consequence ethics (Henriksen & Vetlesen, 1997), and they can be compared with the rights-based and utility-based approaches, respectively. In the case of decision-making obligation ethics would prescribe certain rules such as, “the risk should not exceed…”, whereas the consequence ethics prescription would be, “if the benefits
13
Cost-Benefit Analysis of Separation Distances
balances the risk…”. The clearly normative choice of approach to decision-making thus has an ethical dimension. Once the decision-making criterion has been chosen the relevant decision support tool has to be chosen. Merkhofer (1999) defined the decision-making process in ten steps and categorised about a hundred tools according to their primary use. A selection is presented in Table 3:1. Table 3:1. Categorisation of tools in the decision-making process (Merkhofer, 1999). (AHP = Analytical Hierarchy Process, DA = Decision Analysis, PRA = Probabilistic Risk Assessment, RA = Risk Assessment, WSM = Weighted Scoring Methods.) Note that CBA and DA are the only tools used for all steps in the process 1 2 3 4 5 6 7 8 9 10 x x x x AHP x x x x x x x x x x CBA x x x x x x x x x x DA x x x MAUA x x x x x x x x PRA x x x x x x x x RA x x WSM Key to steps in decision-making process: 1 Problem definition
2 Assessing health or environmental risks
3 Assessing other risks
4 5 Determining Collecting whether information action is needed
6 Screening alternatives
7 Identifying alternatives
8 Evaluating alternatives
9 Selecting options
10 Communicating decisions
Is decision-making in risk and safety matters science? Are there any right answers? Granger Morgan et al. (1990) described the differences in science and policy analysis in terms of empirical testing, documentation, reproducibility, reporting of uncertainty and peer review. Their description showed that science and policy analysis are two separate activities. Hellström (1998) demonstrated how the understanding of the science-policy interface has shifted from a fully separated, bipolar model to a contextual (semi-bi-polar) model, as in Figure 3:1, implying that, although parted, science and policy cannot be regarded as separate or independent activities.
Science
Science
Policy
Policy
Figure 3:1. The shift in the science-policy interface from a bi-polar model (left) to a contextual semi-bi-polar model (right). From Hellström (1998).
14
Decision-making in matters of risk and safety
3.1 Decision-making in general The stages of decision-making processes have been defined in different ways, a selection presented by Hansson (1991) is reproduced in Figure 3:2.
Condorcet (1793) Simon (1960)
First discussion
Intelligence
Second discussion
Design
Mintzberg et al. (1976)
Recognition
Diagnosis
Search/design
Brim et al. (1962)
Identification
Obtaining information
Production of solutions
Resolution
Choice
Screen
Evaluation – choice
Evaluation
Authorisation
Selection
Time Identification
Development
Selection
Figure 3:2. Stages in the decision-making process according to various authors, summarized as the phases Identification, Development and Selection. From Hansson (1991).
The study of decision-making can be classified in different ways depending on the focus. •
Category of theory The focus of decision-making theories is completely different for normative, descriptive and prescriptive theories. Normative decision theory deals with how decisions should be made, and focuses on rationality and correctness. Descriptive theory deals with how decisions are actually made, and focuses on empirical data. Prescriptive theory deals with real decision problems, focusing on one specific problem at a time.
•
Decision-maker Decisions can be classified depending on whether they are decisions made by individuals or collective decisions. Collective decisions can be made by small groups as well as organisations. Societal decision-making is also a form of collective decision-making.
•
Degree of knowledge Decision-making can also be classified according to the knowledge available, and would be different for decisions under ignorance, uncertainty, risk and certainty (increasing degree of knowledge).
From a normative point of view decision-making is the combination of objective information and subjective values in option selection. Depending on the decision-maker’s preferences and 15
Cost-Benefit Analysis of Separation Distances
the information available different decision rules can be applied; e.g. minimax, maximax, Hurwicz α-criterion, minimax regret, maximal expected utility or maximal minimal expected utility (Hansson, 1991). Descriptive theories, on the other hand, claim that most decisionmakers do not follow such a structured process in reality (Orasanu & Connolly, 1993). However, decision-making could be structured, analogously to the skill-rule-knowledge framework (Reason, 1990), developed to understand the cognitive processes in different levels of task performance. This suggests that different decision situations require varying amounts of intuitive and analytical thinking and that they utilize working and long-term memory differently. When it comes to collective, organisational decision-making, the process may be even more opaque; it is often unclear when the process begins and when the decision is actually made. From an organisational decision-making point of view, the question might be asked if decision-making is an instrumental activity, merely concerned with problem solving, or if decision-making should be understood in terms of goal setting and establishing individual as well as social meaning (March, 1997). Koopman and Pool (1991) presented the limitations in cognitive capacity of the decision-makers, the role of information and power, the ambiguity in decision situations and participation issues as a background in their presentation of eight models of organisational decision-making.
3.2 The rights-based approach This section deals with the matter of constrained risk, which is the most common decision criterion in the rights-based approach. Risk can be expressed by different measures, but the most common in matters of major hazards are individual risk (profile or contour) and societal risk expressed in FN format. There are, however, some deficiencies in this approach and the risk formats that will be presented in this section. Possibly the most general quantitative definition of risk is given by Kaplan and Garrick (1981), who suggest the definition to be a set of triplets; answers to the questions: •
What can happen? (i.e. What can go wrong?)
•
How likely is it that it will happen?
•
If it does happen, what are the consequences?
The most extensive and general definition would then be R = { si , pi (φ i ), ζ i (ci ) } , where s represents the scenario i, p the probability of frequency φ, and ξ the probability of consequence c.
3.2.1 Acceptability Kaplan et al. (1981) stated that the major difficulty in applying acceptability to risk is that it cannot be spoken of in isolation, as no risk would ever be acceptable in isolation, regardless of benefits or costs. In terms of decision-making and regulation, Kaplan (1997) argued that the question is put the wrong way; it should be “What is the best decision option?”, instead of “How much is acceptable?”.
16
Decision-making in matters of risk and safety
Matters of acceptability are a political issue, and as noted in Section 2.1.2, experts and laymen alike may have different conceptions of risk, which complicates the determination of a tolerability level.
3.2.2 Variability The Royal Society (1992) concluded that risk estimation is not a precise technique, and that comparisons can subsequently only be approximate. In attempts to estimate the total uncertainty the variability in the results has been found to be large. Amendola, Contini and Ziomas (1992) reported the results of a European benchmarking exercise, in which eleven teams of analysts carried out an analysis of the same plant. Although the aim was to compare the differences in approaches rather than to obtain numerical estimations of the deviations in the results, the results of the QRAs were found to deviate by one to four orders of magnitude (depending on the comparison). Marsili and Soggiu (1998) reported that the 90% central range distribution of individual death risk could cover more than three orders of magnitude (calculated for a chlorine tank using a 10000-trial Monte Carlo simulation).
3.2.3 Logical rigor Deficiencies in the logical rigor are basically concerned with the FN format. Kaplan et al. (1981) pointed out that it must be observed that different risk curves are not linearly comparable. It will thus not be possible to tell if one risk, A, exceeds another risk, B, and the same would hold for comparison with a specified criterion. Evans and Verlander (1997) have made a more thorough analysis of the logical rigor of the FN format, especially the criterion line employed for judging acceptability. They have two objections, both connected with the fact that an acceptability curve is a minimax decision criterion (this criterion suggests that the maximal outcome should be minimized). Firstly, the criterion concentrates on one extreme feature of the statistical distribution, thus ignoring other relevant information. This can lead to decisions that seem unreasonable. Secondly, the criterion is incoherent, i.e. it gives inconsistent assessments of tolerability. When the problem is presented in different ways the criterion gives different decisions.
3.3 The utility-based approach Instead of claiming a universal right to certain levels of risk or compensation (or other attributes), the utility approach claims that resources should be spent where they are most beneficial for welfare. Some basic features of this approach are: •
It focuses on the situation at hand. What can the decision-maker decide upon? What options does the decision-maker have?
•
It assumes that the main criterion for all societal decisions is maximum public welfare. Public welfare is dependent on the welfare of all artefacts included.
•
Each individual is the best judge of his/her own welfare.
•
The individuals’ preferences can be measured by “willingness to pay” (WTP) or “willingness to accept” (WTA). See further in Section 5.5.1.
•
It can take into account both intra- and intergenerational distribution problems. 17
Cost-Benefit Analysis of Separation Distances
•
Welfare in society is increased if the total discounted benefits are in excess of the total discounted costs.
All people differ in their preferences, which means that we place different values on things in life. These preferences rule our behaviour in that they determine how much we are willing to pay for different products and services or what compensation we demand in cases of tradeoffs. A utility function can be used to represent our preferences. The function is individual and basically an imaginary, constructed function. We reveal our preferences in our decisions on whether or not to buy different goods. For many goods there is a market where those preferences are reflected. As in the case of risk, when there is no explicit market, the preferences must be obtained in other ways, either by stated or revealed preferences (see further in Section 5.5.1).
3.3.1 Defining society When performing a cost-benefit calculation it is always necessary to define whose costs and benefits are being calculated. The cost-benefit calculations in the present work were made from society’s point of view. The results imply what is best for society, but “society” as such does not exist and thus needs a thorough definition. “Society” is an abstraction in the sense that it does not make any decisions; it will never be possible to point out “society”. It consists of e.g. individuals, households, companies, non-profit organisations and authorities at different levels (i.e. municipality, county or government levels) that make decisions. Each and every one of those decision-makers has at their disposal some money and the possibility to spend that money according to their preferences. Some artefacts (typically authorities) have the power to make decisions that restrict the possibilities for others to act and spend freely. “Society” is defined as the imaginary overall sum of all artefacts; see Figure 3:3. This study is limited to Sweden and thus only includes Swedish artefacts. It should be emphasized that it is a societal account, not a national account (which would cover the account of the state).
Individuals Government Companies Counties
Municipalities
Households
Figure 3:3. The definition of “society” in this study should be interpreted as the sum of all the different artefacts represented within Swedish society. Examples are given in the figure.
Societal calculations will show whether a certain measure is beneficial or not, i.e. yields a positive or a negative result. All decision-makers will, however, make their own calculations on whether a decision is beneficial to themselves or not, i.e. if they yield a positive or a negative result. This yields four possible combinations of the results of the calculations as
18
Decision-making in matters of risk and safety
indicated in Table 3:2. In two of the four combinations these results coincide (1. and 4.), while in the other two they diverge (2. and 3.). To make real world decision-makers change their decisions an instrument must be utilized. Such instruments may be economic (taxes or subsidies), regulatory or informative. Table 3:2. The four possible combinations of societal and real world decision-maker calculations. The results in combinations 2 and 3 are divergent, which means that an instrument could be considered Societal calculation
Real world decision-maker
Positive
Negative
Positive
1. Pos-Pos
2. Pos-Neg
Negative
3. Neg-Pos
4. Neg-Neg
3.3.2 Economic efficiency and welfare Apart from goals of economic justice and distribution, Pareto efficiency is one of the main goals of economics, and is a useful criterion for comparing alternatives in economics (Varian, 1999). An allocation of resources is called a Pareto improvement if at least one person can become better off without making anybody else worse off. When no further Pareto improvement can be made, the allocation of resources is called Pareto efficient (other allocations are Pareto inefficient). Welfare is a concept introduced to capture the social preference; the idea is to handle aggregations of individual preferences. A welfare function can be constructed based on the individuals’ utility functions (e.g. as a sum or a weighted sum of utilities). An increase in any single person’s utility would increase welfare in society. Welfare maximization as an evaluation criterion is then by definition Pareto efficient since any allocation that allows for a Pareto improvement would increase welfare. The meaning of terms in this section is illustrated in Figure 3:4. The situation is simplified as only two individuals are represented. The grand utility frontier, Uf, represents all efficient combinations of well-being between person 1 and 2 (derived from all allocation possibilities where the marginal rate of production equals the marginal rate of consumption.) Any point below the frontier, such as point a, thus represents inefficiency. Any reallocation from point a towards points b or c (or any point on the curve between b or c) are Pareto improvements, which differs concerning the distribution between person 1 and 2. A reallocation towards d is a potential Pareto improvement on the condition that it would be possible for person 2 to compensate person 1 and still be better off, as it increases the well-being of person 2 at the expense of person 1. W represents social indifference curves, reflecting societal equally valuation of the individuals’ utility functions at different levels (the utility of person 1 and 2 are given equal weight). Welfare maximization will then be reached at the tangential point of the grand utility frontier and the highest attainable social indifference curve, depicted W2 in the figure.
19
Cost-Benefit Analysis of Separation Distances
U1
b
a
c
W1 W2
d Uf
U2 Figure 3:4. Economic efficiency and welfare can be described by resource allocation and the utility frontier as described in the text. Inspired by Nas (1996).
Unfortunately, the criterion of Pareto efficiency and welfare maximization is difficult to apply in practice since most allocations increase the benefit of some at the expense of others. The criterion used in most CBAs is the Hicks-Kaldor criterion (sometimes called the criterion for potential Pareto improvements), which suggests that an allocation is effective when the net benefit is positive, i.e. when the people who gain the benefit can compensate those who loose benefit, and still have a surplus. It is noteworthy that the compensation does not actually have to be carried out. A CBA can make a special account of the distributional effects.
3.3.3 Multi-attribute utility analysis The main alternative to CBA for decision support within the utility-based approach is multiattribute utility analysis, MAUA (Keeney & Raiffa, 1993), a branch within multi-criteria decision-making (MCDM). (Another branch is multi-objective decision-making, MODM.) Within MAUA a set of alternatives (cf. solutions, options etc.) are suggested. In the case of separation distances these could be different length of distances. These alternatives are evaluated with the aid of a number of criteria (objectives), each determined by a set of attributes. In the case of separation distances attributes could be risk level, noise level, option value, air pollution, local environment, aesthetics etc. Each and every attribute of all the alternatives is then quantified. MAUA provides a very general theoretical framework for collecting and weighting information on those attributes when it is not appropriate to convert them into monetary values; achieved by employing the utility function. The utility function is an individual function, reflecting values of different outcomes, and thus MAUA mainly supports individual decision-making. Keeney and Raiffa (1993) have suggested how individual utility functions could be aggregated, or at least incorporated, in one decisionmaker’s utility function. MAUA has been described as conceptually simple but operationally complex (Granger Morgan et al., 1990). It should be noted that the difference between CBA and MAUA is small when applied to societal decision-making based on public values, as those are aggregated individual values and will correspond to values obtained from the market. The difference between CBA and MAUA could, however, be large if the values in MAUA reflect the preferences of one decision-maker only.
20
Decision-making in matters of risk and safety
MAUA has been applied in cases of land use planning and major hazards (e.g. Grønberg, Duijm & Rasmussen, 1998 and Papazoglou et al., 2000; Section 2.4.4).
21
Cost-Benefit Analysis of Separation Distances
22
Cost-benefit analysis
4. Cost-benefit analysis Cost-benefit analysis (CBA), defined as “the attempt to compare the total social costs and benefits of an activity, usually expressed in monetary terms” (Black, 1997), is the method employed within the utility-based approach in this study. This chapter is devoted to presenting basic CBA methodology and decision rules, to complement the more general presentation of the utility-based approach in Section 3.3. It should be noted that the term “project” used in most CBA literature is interchangeable with the term “alternative” used in most decision theory literature. A project (alternative) is a certain use of resources (land, labour, capital, energy etc.). CBA is intended to support decision-making when choosing between projects or recommendations regarding one single project. Nas (1996) outlines the basic features of CBA: •
Identify all costs and benefits of a project
•
Quantify all costs and benefits and express them in monetary terms
•
Discount the future stream of costs and benefits to the present value using a discount rate
The results of the calculations make it possible to select a project on the principle of maximizing net social benefits, thus employing the Hicks-Kaldor criterion. In analogy, it is possible for authorities to assess and select appropriate measures, if required.
4.1 Methodology for cost-benefit calculations To undertake a CBA in a systematic fashion, an established procedure needs to be followed. The following generic procedure is based on Mattsson (2000) and Nas (1996): i. Determine which projects to analyse The set of projects is by no means obvious, and the definition of the set is likely to affect the resulting ranking of projects. To develop different projects brainstorming (internal or external) can be used. The importance of distinguishing between the roles of the decision-maker and the investigator before the set is established is emphasized. A normal CBA often comprises four to eight projects. ii. Delimit the projects (in time and space) The economic lifetime of the projects must be defined, i.e. for how long period of time the effects should be calculated. Limitations in space should be interpreted as the need to have a reference project, which is often a “zero-alternative”, i.e. no project is chosen (preservation of current situation). iii. Identify all relevant effects on society All cost and benefit items must be identified and, to avoid counting some items twice, special attention must be paid to the difference in flow and stock quantities. iv. Quantify the effects All cost and benefit items should be expressed in the same units, usually monetary. All monetary units employed must be comparable and thus special attention should be paid to indirect tax differences, so that the tax effects are treated in the same way for all 23
Cost-Benefit Analysis of Separation Distances
items. Principles for quantifying the effects, both when markets exist and when no market exists must be established. v. Discount the effects Since the costs and benefits usually appear at different times, the values must be transformed to the same point in time (a uniform measure). vi. Consider the uncertainties The different categories of uncertainty must be identified and assessed. The extent of the uncertainty may vary, but a sensitivity analysis at least is recommended. vii. Document the relevant distributional effects If costs and benefits are unevenly distributed the effects can be described for relevant subpopulations.
4.2 Decision rules When selecting from various projects a decision rule should be applied. There are basically three decision rules that can be applied in CBA (Nas, 1996), and each one can be interpreted by the Hicks-Kaldor criterion.
4.2.1 Net present value All benefits (b) and costs (c) from each year (t) must be transformed to the cost at the same time, using the discount rate (r). The sum of benefits (B) and costs (C) expressed as the present value will then be: T
B=∑ t =1 T
bt (1 + r ) t
(4.1)
ct (1 + r ) t
(4.2)
C=∑ t =1
Both costs and benefits are then expressed as single values. The net present value (NPV) can easily be calculated as the difference between benefits and costs, (4.3)
NPV = B − C
The value should be interpreted as the current monetary value of the project, if it were to be realized. A positive value implies that the project is beneficial, according to the Hicks-Kaldor criterion.
4.2.2 Benefit-cost ratio When the present values of costs and benefits have been calculated, the benefit-cost ratio (G) can be calculated:
G=
B C
(4.4)
24
Cost-benefit analysis
The value of G should be interpreted as a profitability index, such that projects reaching a value above one (1.0) are beneficial, but projects below one (1.0) are not, according to the Hicks-Kaldor criterion.
4.2.3 Internal rate of return All calculations require the transformation of costs and benefits, and the third decision rule is based on this transformation. By calculating an internal rate of return (IRR), defined as the specific discount rate that results in a zero NPV, a comparison can be made with the market rate of return or the social discount rate, or any other predetermined rate. The IRR that results in zero NPV is calculated by solving the equation: T
bt − ct
∑ (1 + i) t =1
t
=0
(4.5)
The IRR (in Eq. (4.5) denominated by i) should be interpreted as beneficial if the value exceeds the comparison rate (i>r), according to the Hicks-Kaldor criterion.
25
Cost-Benefit Analysis of Separation Distances
26
Application to separation distances
5. Application to separation distances Several combinations of measures can be introduced to reduce the risks arising from the handling of hazardous substances in land use planning. All such measures demand decisions and the outcome of such decision-making processes in turn depends on the decision support. The basic assumption in this study is that decisions are better supported within the utilitybased approach such as CBA. In this study, only the use of separation distance will be investigated, for reasons more thoroughly discussed in Section 5.2. It is recognized that employing separation distances creates a zone around the hazardous activity, and that the terms “separation distance” and “(safety) zone” are interchangeable. It is further recognized that these zones may be different for “point sources” such as industrial facilities and “line sources” such as infrastructure (transportation risks).
5.1 Market conditions This section is concerned with the effect of separation distances according to economic theories. The core market is identified as the land market. Figure 5:1 presents a simple macromodel of the economic behaviour of individuals, representing the land market. The demand function says how much land individuals (artefacts) would wish to demand at different prices, and the supply function says how much land individuals (artefacts) would wish to supply at different prices. The intersection of the curves is the equilibrium point where the selling and buying prices are equal. Supply and demand are then balanced (as pd=ps). At prices above this point the supply of goods would be greater than the demand, and the price will decrease until it reaches the equilibrium point.
Price Supply pd
pd=ps
ps Demand q*
Quantity
Figure 5:1. The supply and demand functions and the equilibrium point. At any quantity below q* the price, pd, that people are willing to pay is higher than the price, ps, that people are willing to sell at. This will increase the supplied quantity until the equilibrium point is reached, at quantity q*.
The model presented assumes that the market is perfectly competitive. Nas (1996) has distinguished four criteria for a perfectly competitive market:
27
Cost-Benefit Analysis of Separation Distances
(a) There is perfect information available, and all decision-makers maximize their own net benefits employing this information. (b) Firms are too small (in relation to the market) to influence market price. (c) No barriers or structural impediments prevent firms from entering or exiting the market. (d) All factors of production are privately owned. Is the land market a competitive market? This question is difficult to answer generally as conditions may vary from one place to another. It is probably competitive, but not perfectly competitive. Of the above-mentioned four criteria at least (d) fails, as the municipalities own some land. It is also doubtful whether the information available can be regarded as perfect, since information on attributes such as risk can be difficult to derive and estimate. It is thus uncertain if the decision-makers can maximize their net benefits. In a perfect market environment (a market with perfect competition) there is no need for governmental intervention. Intervention from authorities can be used to optimise societal benefits (as presented in Table 3:2). Reasons for public authorities to intervene exist if:
•
there is a lack of information, or
•
there are externalities that need to be balanced, or
•
products are missing on the market. (Not relevant in this study.)
An externality can be defined as “a cost or benefit arising from any activity which does not accrue to the person or organization carrying on the activity” (Black, 1997). Externalities will lead to individuals or organisations having unfavourable options when costs are transferred to (or benefits deprived from) other agents who do not receive any compensation. In the case of risk-imposing activities it might be argued that the risks are externalities of different activities. The benefits are accrued to the owners of the risk-imposing companies, but the negative effects are accrued to society and the neighbouring companies and people. The riskimposing activities (industry or infrastructure) do not bear the diseconomies of the negative effects. The situation could then be described as market failure, and the presence of externalities is a reason for authority intervention.
5.1.1 Impact of separation distances on the market model In Section 4.2, three decision rules were presented, together with interpretations of economic efficiency. A project increases welfare if it fulfils the efficiency criterion. This change in welfare can be explained (and measured) in terms of consumer and producer surplus. From an economic point of view, the implementation of separation distances is an intervention, employed by governmental agencies and municipalities in order to reduce the external effects. This will affect the balance of supply and demand on the land market since some land (safety zones) will be prevented from being put to more productive use. This will change the producer and consumer surplus as follows (area denominations as in Figure 5:2). The change in producer surplus is [A+D]-[D+E+F]=A-E-F and the change in consumer surplus is [G]-[A+B+C+G]=-A-B-C. This should be interpreted as a loss for consumers (those who wish to buy land) since the change in consumer surplus is negative. For producers (those
28
Application to separation distances
who own land) the situation is more complex, since it depends on the actual demand and supply functions. For individual landowners who can sell at a higher price there will be a surplus whereas those who cannot sell due to the restrictions may find their land subject to redemption at a lower price. The change in welfare is depicted by the sum of the changes in consumer and producer surplus, [A-E-F]-[A+B+C]=-E-F-B-C, and should thus be interpreted as a loss of welfare. Besides this loss the cost of administration may be added. Price
Supply
G
p2 A
p1
C
B
F D E
Demand
q2
q1
Quantity
Figure 5:2. A restriction on land use (a shift from the full to the dotted line) affects the supply function and, consequently, the equilibrium price. The change in welfare is the sum of the area [E+B+C+F] (shaded).
The model depicted in Figure 5:2 assumes a certain elasticity in the supply and demand functions. Since no data are available on the elasticity a simplified model is assumed, as depicted in Figure 5:3, where the demand function is assumed to be infinitely elastic and the supply function has zero elasticity. Employing this assumption in estimations of land prices leads to an underestimation of the real prices, yielding a somewhat conservative value in the CBA. Price
Supply
Demand
p
q2
q1
Quantity
Figure 5:3. A simplified model, assuming a non-elastic demand function, of the effect of the restriction on land use. The change in welfare is the shaded area [p·(q2-q1)].
29
Cost-Benefit Analysis of Separation Distances
It can be observed that the effect on the supply-demand balance is the same as when a tax is levied.
5.2 The decision problem It is possible to characterize decisions according to a number of fundamental perspectives of the decision, namely: (a) System level Different system levels have different sets of decision options. At higher levels the options are mainly non-specific (e.g. policy decisions and regulations), whereas at lower levels the options are mainly specific. (b) Decision situation There are two main situations for decision-making. Firstly, when there is an expressed request for a decision (e.g. application for permission); the options are usually approval or disapproval. These situations often have an established decision-making procedure. Secondly, when there are several options to choose between, and one is “do nothing”. These decision-making procedures are more often opaque. (c) Time scale The lasting impact on society resulting from different decisions varies considerably, depending on the structural binding they imply. Combining these three perspectives, and assigning two alternatives to each, yields eight (23) different decision characteristics. In this study, the focus was on a decision characterized by:
•
High system level; as there are general recommendations on the applicability of separation distances,
•
Decision situations with several options; as the decision-makers can recommend any distance they judge appropriate (or not recommend any distance at all), and
•
Long time scale; as the employment of separation distances implies a high degree of structural binding.
In the study it was assumed that the time of the decision and the restriction in land use coincide. This can be interpreted as a limitation, because this excludes situations where the restriction can be postponed several years, which would mean lower costs. This puts aside aspects of dynamic investment planning, i.e. maximizing outcome in a temporal scale (Andersson, 1991). For example, if the land next to a hazardous activity can be employed for forestry another 20 years before restrictions have to be put on the area, the costs would be substantially reduced.
5.2.1 Decision options Irrespective of whether we are considering a general policy recommendation or a specific case, the physical implications of the decision options in respect of hazardous substances and land use planning (and design) are basically the same. An arbitrary selection of alternatives is presented in Table 5:1.
30
Application to separation distances Table 5:1. A few of the different alternatives (arbitrary selection) and associated requirements which can be decided upon Alternatives
Requirements on…
Physical barriers
Design of surrounding area, e.g. walls or dikes
Ventilation control
Ventilation shutdown possibilities in specified buildings, for specified circumstances
Alarm
Detection and alarm devices
Information/education
Communication of risks and recommended behaviour
Land use restrictions
Relations, e.g. distances, between housing and activities
In order to make it feasible to study the different decision options and to support policy recommendations it is necessary to be specific in the problem definition. In Tables 5:2-4, the increased level of specification in this study is illustrated. In order to perform a CBA the final question “What separation distance should be used for restrictions in land use planning?” is transformed into “What distance is optimal from a social-economic point of view?”. Table 5:2. Different options when the problem is defined as the design of the system that involves all handling of hazardous materials How should the safety of handling hazardous substances be improved? A B
Technical improvements (tank and pipe design, materials, etc.) Near-accident reporting system
C
Information to the public
D
Control of people involved (drug tests, certificates, etc.)
E
Design of area next to activity
Table 5:3. Different options when the problem is limited to “design of area next to activity” E How should the area next to an activity be designed? 1 Barriers (banks, walls) 2 Warning systems (detectors and alarm) 3 Separation distances 4
Ventilation control
Table 5:4. Different options when the problem is limited to the appropriate separation distance 3 What separation distance should be used for restrictions in land use planning? i
10 metres
ii
50 metres
iii
100 metres
iv
200 metres
It is recognised that it is absolutely necessary to specify the problem as above to make it open to argument (which is necessary in a science-policy interaction as described in Chapter 3), thus reducing what Hansson (1998) refers to as demarcation uncertainty. It would not be of 31
Cost-Benefit Analysis of Separation Distances
interest to investigate any separation distance if the argument refers to, and the problem is defined as, whether or not to accept any handling of dangerous goods at all (for instance). In a similar way, the importance of sequencing, i.e. in what order the decision situations appear, must be recognized. The assessment of costs and benefits may be different in the cases of, e.g. (i) the establishment of a new, risk-imposing activity, (ii) the establishment of new housing near an existing activity, and (iii) existing housing and activity. The basic assumption in this study is the situation of establishment of new housing near an existing, risk-imposing activity. An ordinary CBA at this point would define some alternatives to choose between (typically four to eight) and would predict the associated costs and benefits. In this study, however, the calculations were performed as a continuous function, where the separation distance is the main variable. The reason for this is that it extends the set of alternatives in a way that allows for an optimum approach in the evaluation. The set of alternatives selected is thus separation distances, x (m), within certain bounds, defined as x ∈ R : 20 ≤ x ≤ 500
The lower boundary of 20 metres was chosen because it is assumed that within the first 20 metres the safety zone is beneficial and is motivated for several reasons. Regarding road and rail links these reasons are visibility in traffic, protection against direct impact accidents, vibration, and particles (such as ice and litter). Regarding industrial activities the reasons are more arbitrary. The upper boundary of 500 metres was chosen as a maximum plausible distance, based on the BoV guidelines (Boverket, 1995) and the planning situations discussed. The boundaries can easily be changed if the calculation shows that the application of the decision rule is restricted by the boundaries.
5.2.2 Choice of decision rule Which decision rule should be selected in this study? The net present value (NPV) method has the advantage that the size of the cost or benefit surplus is clearly presented. Further, there would be no doubts about how to handle items that could be classified as either a benefit or a reduction in cost. Consider, for example, such an item, β. The adjustment of the benefit-cost calculations employing the NPV method then yields (irrespective of the classification): NPV = B − C + β
(5.1)
The disadvantages of the NPV method are that it is intuitively difficult to understand the results and that it is sensitive to the size of the project (in this case, the total sum of separation distances in Sweden). The benefit-cost ratio, on the other hand, is not sensitive to the size of the project considered. The results from a study of the separation distance at one specific site would yield results comparable to any other site or any other measure (in Sweden). The measure is rather intuitively understood, and thus easy to interpret and communicate. If there are doubts as to if a certain item is a benefit or a cost reduction, the classification will affect the results. Consider
32
Application to separation distances
item β in the example above. The adjustment to the benefit-cost calculations can be made either as:
G=
B C−β
(5.2)
G=
B+β C
(5.3)
or
If the other cost and benefit items are of equal size, the first adjustment will increase G most. However, if the cost and benefit items are of equal size and item β constitutes less than a 10% addition or reduction, the classification will affect G by less than 1%. The internal rate of return (IRR) provides a rapid reference against which a project can be judged to be beneficial or not. However, the method results in more than one rate under certain circumstances (e.g. when there are recurrent investment costs). Further, the method is unreliable when projects of various sizes are compared and ranked, and the quantitative difference between rates is difficult to interpret. In this study the benefit-cost ratio (Eq. 4.4) was chosen as the decision rule, because it is intuitively easy to understand and interpret, and it is independent of the size of the project (the total sum of separation distances). The Hicks-Kaldor criterion is fulfilled when G>1.0. An optimum separation distance (Gopt) exists only if there is a distance at which dG/dx = 0 and d2G/dx2 is negative. The maximum separation distance at Gmax that fulfils the Hicks-Kaldor criterion and which may serve as a guideline for societal recommendations is obtained when G equals 1.
5.3 Time horizon When performing a CBA it is necessary to determine the time horizon, i.e. to define the period for which the costs and benefits will be considered and calculated. All investments have two time horizons: (i) the physical lifetime, determined by the expected durability of the investment, and (ii) the economic lifetime, determined by the anticipated difference in benefits and costs. It is important to distinguish the economic lifetime from the physical. The physical lifetime, which is almost always longer than the economical lifetime, is the time horizon during which the investment can be used. For example, the physical lifetime of a bridge will be determined by its load-bearing capacity and whether this is sufficient for the vehicles using it, and the physical lifetime can thus be very long. There are bridges still in use that are more than two hundred years old. Similarly, the physical lifetime of a computer will be determined by its ability to process and store information. Also in this case, the physical lifetime can be long as the computer is considered to be working as long as it starts when the on-button is pressed. Most computers from the seventies and eighties are, however, found in museums, irrespective of their functionality. The economic lifetime of a computer is very short because of the rapid development of new products, and the economic lifetime is determined by the computer’s
33
Cost-Benefit Analysis of Separation Distances
ability to handle new software and communication features and to do it fast. The reason for introducing the concept of economic lifetime is that an investment can lose its value faster than its functionality. This, in turn, is due to the development of new or alternative solutions competing with the first investment. The duration of the economic lifetime is determined on a case-to-case basis.
5.3.1 Economic lifetime The specification of economic lifetime is thus made considering how beneficial a project is considered to be in the future, i.e. for how long bt-ct>0. The choice of economic lifetime will have an impact on the results, especially in cases where the costs and benefits are unevenly distributed. However, at longer time horizons (e.g. thirty years) the marginal impact decreases, and the effect on the results is smaller, as is illustrated in Table 5:5. If, for instance, forty years is chosen but it should have been thirty or sixty years (the “correct” value of T), the deviation in the results when calculating G is ten percent (10.4% using a 5 percent discount rate), assuming that bt-ct is constant and that the project entails only one initial (investment) cost. The decreasing marginal influence of the lifetime can also be understood by calculations of the annual cost of an investment (which is an interchangeable method), which approaches the discount rate as the time horizon increases. Table 5:5. Present values of an annual benefit surplus from an arbitrarily chosen, constant amount (58.3) employing a 5% discount rate and the impact on the benefit-cost ratio (G) for different time horizons, and the deviation from T = 40 years T (years)
Present value
Deviation from 40 years (%)
30 40 50
896 1000 1064
-10.4 % 0 +6.4 %
60
1104
+10.4 %
The Swedish Institute for Transport and Communications Analysis (Statens institut för kommunikationsanalys, SIKA) have presented some recommended values for the economic lifetime within the transport area (SIKA, 1999). Those of interest here are: (a) New railway, 60 years (b) New road, 40 to 60 years. The recommendation is forty years in urban areas and their vicinity; reasons should be stated for extensions of this time. For roads in rural areas, a maximum of sixty years is applicable. Since the use of separation distances is connected with the transport of dangerous goods, which is part of the transport system, the economic lifetime of the safety zones should be the same or less than for roads and railways. Assuming that dangerous goods will continue to be part of the transport system is a reason for choosing the same period, but assuming that the transport of dangerous goods will change more dramatically would reduce the time horizon. Assuming that the risks due to industry are given more weight (than the risk due to transport), with possibly shorter economic lifetimes, could also be taken as an argument for reduction of the time horizon. In this study, the economic lifetime of separation distances was assumed to be forty years.
34
Application to separation distances
5.4 Benefit and cost items Once the CBA demarcation has been set, all cost and benefit items within the time horizon must be specified, i.e. identified and calculated. At first, the actual physical implication of separation distances must be interpreted. Will the land be kept as it is, or will it be redesigned in a certain way? Would this be a standard design or on a case-to-case basis? Can the land be used for agricultural, recreational or other purposes? In the absence of relevant guidance some assumptions must be made. These are the basic assumptions made in this study. (a) The main purpose is to minimize the accident risk exposure level by separating people from risk-imposing activities. (b) The land is regarded as reserved for separation purposes in the first place. The land might in exceptional cases, be used for agricultural purposes, but the environment may not be the best for crops. The land might, furthermore, be used for other, not predefined, purposes as long as they do not involve many people. (c) There are other benefits of separation distances than reduction in accident risk. Based on these assumptions the effects of separation distances are identified, both as physical implications and as economical consequences as in Figure 5:4. (a) Public exposure to accident risk levels would be reduced. (b) Public exposure to noise levels would be reduced. (c) Reserving land is a second-best alternative, thus involving an opportunity cost for society. (d) The reserved piece of land must be planned, designed, constructed and managed. (e) The level of air pollution will be affected, on local, regional and, possibly, global scales. Air pollution involves health effects, corrosion and dirt. (f) Using separation distances on a large scale would mean longer travelling distances and travelling times. (g) Improved local environment for vegetation and animal life. The pattern of animal movements and the structure of the flora might benefit from these conditions. (h) Exposure to vibration might be reduced. (i) The use of separation distances might have an option value (if the measure is considered to have a value for non-users).
+ Reduced accident risk exposure Reduced noise level exposure Reduced air pollution exposure Others
Opportunity costs for land Planning & construction costs Management costs Others
Figure 5:4. Basic calculation sheet of anticipated benefit (+) and cost (-) items of separation distances.
35
Cost-Benefit Analysis of Separation Distances
5.5 The benefits The restrictions on land use mean that people will not be within a zone, hence not be exposed to certain levels of risk, noise and pollution. The extent of these benefits will depend on the zone created by the separation distance and the population density. The zone may be shaped either as a circle (around a point source, e.g. a plant) or as a square (next to a line source, e.g. a road of a specified length). The benefits will further depend on whether the marginal or total benefits are calculated, see Section 6.1. Consider the case of the separation distance, x0, and a certain population density, ρ. The marginal benefit (MB) results from the number of people in a zone, dA, created by an increase in the separation distance, dx, not exposed to the specific levels of risk etc. at the distance x0. The total benefit (B) is the integrated value of all marginal values within the separation distance, x0.
5.5.1 Reduction in death risk A separation distance reduces the average number of people exposed to the risks. Four parameters determine the effectiveness in risk reduction. i.
The risk levels at different distances - Separation is more effective at distances with higher risk levels.
ii.
The population density - The more densely populated the area, the more effective are separation distances as more people will not be exposed to a risk level they otherwise would have been.
iii.
The degree of exposure - The degree of exposure varies over time and with land use and depends on the pattern of people’s movements. There are, for example, differences in daytime and night-time populations and between housing and business areas. The degree of exposure is obtained from an adjustment of the population data.
iv.
The value of a statistical life - The weight associated with the risk reduction in monetary terms will inevitably be strongly coupled to the value of a statistical life.
The reduction in the number of people exposed to risk will be expressed as reduced potential loss of life, PLL, which will be based on the site-specific individual risk since it is the only measure that takes the spatial distribution of risk into account, and is thus the most commonly used quantitative measure in planning purposes. Site-specific individual risk is defined as the annual probability of death for a person (fictitious) at the position (x,y) assumed to be exposed 24 hours per day. The risk can be presented as a function of distance, evenly distributed in all directions, or an average can be approximated. Individual risk can be expressed in other ways, for example:
•
Average individual risk, which is based on general data on fatality and exposure, often calculated as the number of fatalities divided by the number of people exposed to the risk.
•
Maximum individual risk, which is expressed as the probability of death of the most exposed individual.
•
Specific individual risk, which is expressed as one specific individual’s probability of death, considering his or her specific occupancy and activities.
Since the measure of benefits is in monetary terms, the calculations demands that a price be put on life. This might seem an impossible task, but four things must be noted:
36
Application to separation distances
i.
Resources in society are scarce. It is impossible to spend an infinite amount of money on saving lives. The allocation of resources demands effective use of the money available.
ii.
All decisions regarding measures that involve costs and which affect the risk to the population also imply a value of a statistical life.
iii.
It is the value of a statistical life that must be included in the calculations. Society (as defined in Section 3.3.1) will in most cases be prepared to spend more than this value to save a specific life at risk (e.g. a badly injured person may receive rather expensive medical treatment).
iv.
The value does not reflect the value of a single individual’s life.
The term statistical life refers to the expected change in fatality when there is a small change in the level of risk that several people are exposed to. The value of a statistical life is the value placed on this change and can be established from the two approaches presented below. The relation between the different approaches is illustrated in Figure 5:5. (a) Production-oriented approach This approach assumes that the loss of a statistical life results in lost future production and consumption and that the value of the statistical life can be estimated from the average income calculated as the present value. Mattsson (2000) reported that the result using this approach is a value of SEK 3 to 4 million per life, but asserts that this is an underestimation since it does not reflect other values of life than future income. Vrijling, van Hengel and Houben (1998) suggested a similar measure; that the present value of the net national product per inhabitant be calculated. This sort of approach seems to have very low validity and Mattsson, in fact, questions whether this method reflects the value it is intended to at all. (b) Willingness to pay or willingness to accept This approach assumes that there is a correlation between differences in risk levels and prices that reflects the value placed on life. The value can be reflected in different ways. One way is based on the revealed preferences, i.e. how much money individuals or society have been prepared to pay for various risk-reducing measures compared with their risk-reducing effects (willingness to pay, WTP), or how much money we demand as compensation for an increase in risk (willingness to accept, WTA). As there is no explicit market for trading accidental risk, the values are obtained as attributes of other products and at other markets; these values obtained are called hedonic prices. Values can, for example, be obtained from studies on how much extra individuals pay for safer vehicles (knowing how much safer these are), or from jobs associated with different salaries and different levels of risk. Another way is to investigate stated preferences, i.e. how much money individuals say that they would be prepared to spend on certain risk-reducing measures (or accept as compensation for an increase in risk). This is done by interview surveys, and the most common is the CVM (contingent valuation method).
37
Cost-Benefit Analysis of Separation Distances
Value of a statistical life?
Production oriented
WTP WTA
PV of future income
Revealed preferences
Stated preferences
Hedonic prices
CVM
Figure 5:5. The different approaches used to establish the value of a statistical life.
In this study, the willingness to pay approach was adopted, because it best reflects the value sought. Mattsson (1990) made a survey of the value of a statistical life using different methodologies and found a span of values. A value of SEK 23.5 million (1990) was extracted from 9 CVM studies and a value of SEK 38.8 million (1990) was extracted from 28 WTP studies of individual decisions. Ramsberg and Sjöberg (1996) studied 147 life-saving interventions in Sweden and, after removing one extreme value, they found the implicit valuation of life to be SEK 38 million (1996). Lindell et al. (1997) attempted to adjust the value for multiple purposes in safety investments and suggested the value of life to be in the range of SEK 3 to 30 million (unclear whether this is 1995 or 1997 prices). Mattson (2000) recommended a value in the range of SEK 19 to 48 million (1999) based on several studies, including American figures adjusted for income elasticity (from Viscusi, 1992). Some comments on the estimates of the value of life may be appropriate at this juncture. (a) The value of a statistical life is correlated to the initial risk level; an increase in initial risk level usually means an increase in willingness to pay, and thus a higher value of the statistical life (Mattsson, 2000). The initial risk in this study is, however, not considered to deviate in such a way as to motivate a correction of the values obtained as above. (b) This study employs the measure “statistical lives saved” (by reduction of PLL) and thus ignores the measure “remaining life-years saved” and QALY (quality-adjusted life years), Mattsson (2000). The latter can take demographic distributions into account, and this may be important if risk-reducing measures are targeted at certain sub-populations, or part of a redistribution policy. However, the measure of remaining life-years saved could be interpreted as a home for the aged not requiring the same separation distance as a kindergarten. Although the difference between age groups will be reduced when the value of life is discounted, the relevant measure reflecting the average risk-reducing effect is “statistical lives saved”. The best estimate of a statistical life employed in this study was SEK 30 million, and a range of values between SEK 5 and 50 million was used in the sensitivity analysis. 38
Application to separation distances
A change in separation distance of dx at the distance x0 (m) yields a change in area of dA (m2), and a subsequent marginal benefit from the reduction in PLL could then be calculated as:
MB( x0 ) = v ⋅ k (r ) ⋅ IR( x0 ) ⋅ dA ⋅ ρ ⋅ ε where
(5.1)
MB = the marginal benefit of the reduction in PLL due to separation distance x0 v = the value of a statistical life k(r) = discounting coefficient, dependent on the discount rate, r IR(x0) = individual risk at location x0, (year-1) ρ = population density ε = exposure factor
The total benefit (B) from the reduction in PLL, due to the separation distance x0, can then be calculated as: x0
B( x0 ) = ∫ MB( x)dx
(5.2)
20
5.5.2 Reduction in injuries and property damage One way of estimating the benefit (value) of the reduction in injuries and property damage is to assess the relationship between these items and the item “reduction in PLL”. In order to do this, the relations between number of injuries and number of deaths, and between the value of one single injury and one single death, must be determined. The relation between the cost for property damage and other costs arising from accidents must also be determined.
In analogy to the “value of a statistical life”, a “value of a statistical injury” can be employed. Statistics allow for a separation between serious and light injuries. From Mattsson (2000) it can be noted that the relation between the value of one serious injury and the loss of one statistical life is 0.17:1 (employed by VägV), which is equivalent to six serious injuries compared with one death. There are estimates regarding the relationship of numbers of injuries to number of deaths in the case of accidents. From SOU 1995:19 (“A Safer Society”) the relationship seems to be 2.5:1 for chemical accidents and accidents involving the transport of dangerous goods, see Table 5:6. The variation is of course large; the relationship calculated for different country’s reported accidents results in values between 0.01:1 and 5.8:1, see Table 5:7. The relationship calculated is not really a measure of the different countries’ specific number of injuries per fatality, but an illustration of the variation in this number. Sweden is not included in the survey, but there is no reason to assume a significant deviation for Swedish circumstances.
39
Cost-Benefit Analysis of Separation Distances Table 5:6. Number of injuries per fatality for accidents involving hazardous materials with three or more fatalities. Data from SOU 1995:19 (collected from the database MHIDAS; Major Hazard Incident Data Service) for ten industrial countries during the years 1954-1991 Number of Number of Number of Number of injuries accidents fatalities injuries per fatality Accidents leading to explosion or fire Accidents leading to gas release Accidents during the transport of dangerous goods Total
73
524
1233
2.4
19
92
387
4.2
78
848
2042
2.4
170
1464
3662
2.5
Table 5:7. Data illustrating the variation in the number of injuries per fatality for accidents involving hazardous materials with three or more fatalities. Data from SOU 1995:19 (collected from the database MHIDAS) for ten industrial countries during the years 1954-1991 Number of Number of Number of Number of injuries Country accidents fatalities injuries per fatality Belgium 4 18 39 2.2 The Netherlands 2 22 128 5.8 France 8 59 214 3.6 Spain 5 234 374 1.6 Germany 11 48 170 3.5 UK 7 68 212 3.1 Norway 2 18 48 2.7 Canada 4 71 1 0.01 USA 117 842 2357 2.8 Japan 10 84 119 1.4 Total
170
1464
3662
2.5
These findings imply that the benefits in terms of a reduced number of injuries could add, on average, about forty percent (2.5·0.17=42.5%) to the value of the reduction in PLL. To obtain an estimate of the reduction in material damage, values from Sund (1997) were used. Sund found that the cost of material damage in 1995 (environmental damage included) represented 22 percent of the overall accident costs in Sweden, and could thus add 28% (22/(10022)=22/78=28%) to the accident costs. However, Sund employed a production-oriented value of lives lost which makes a 28% addition an overestimate. As noted before, the productionoriented value of a statistical life is about ten to fifteen percent of the WTP estimate (employed in this study), and the addition to the reduction in loss of life is thus reduced to approximately 3%. It is not known if this value would differ for accidents involving hazardous materials, and thus no basis for the adjustment of this value is available. The total benefit of accidental risk reduction would then be 47% (1.425·1.03=1.47) more than the expected reduction in PLL, and Eqs (5.1) and (5.2) must thus be multiplied by a coefficient l = 1.47.
5.5.3 Reduction in noise exposure Defining the health effects of noise is closely related to defining noise itself. (The introductory part of this section is based on Landström (2000).) Whereas sound is defined as differentials in pressure or elastic oscillation, noise is defined as unwanted sound. The main 40
Application to separation distances
characteristics of noise are thus the same as those of sound, i.e. frequency and amplitude. Employing the definition of sound leads to an understanding that sound is not the same as what humans are able to hear, since most people are only able to apprehend sound within a certain frequency interval, usually 20 Hz to 15 kHz (the span decreases with age). Lower frequencies are called infrasound and higher frequencies ultrasound. The effect of noise is dependent on these characteristics, but also on the duration of exposure and the variability of the sound (differentials in acoustic pressure). Factors which influence how a sound/noise is experienced are the activity undertaken, the conception of the source (attitude), predictability and ability to control the sound/noise. Individual differences such as sex, age or personality have not been found adequate to identify more sensitive categories of people. Exposure to noise can induce temporary as well as permanent hearing damage, but it can also lead to physical reactions similar to stress-induced reactions. Below damaging levels, noise might induce subjective, negative experiences that can affect performance (similarly to stress). In analogy to the human apprehension of sound or noise, regulations regarding limitation in exposure are extremely divergent. As pointed out by Johansson (1992), different authorities have issued different regulations and recommendations, ranging from 30 to 85 dB(A). A few illustrative examples are given below. (a) The Swedish Work Environment Authority has issued regulations regarding the working environment that limit the exposure to an 85 dB(A) equivalent noise level for a working day (eight hours) (AFS 1992:10). (b) NVV has issued a recommendation for outdoor levels of 55 dB(A) from roads to houses, care facilities and educational facilities. (c) BanV recommends 60 dB(A) from new railways to housing, and 75 dB(A) for outdoor levels in existing situations. The recommendation also includes maximum indoor levels. The regulations and recommendations referred to above are, however, of little help in the assessment of the societal benefits of distance as a noise-reduction measure. What we need is estimates of the value of noise reduction, and the actual reduction of noise due to greater distance from the source. VägV employs values of people exposed to road noise to assess possible noise-reduction measures. The values are expressed as the annual cost of one person subjected to a certain equivalent noise level (dB(A)), see Figure 5:6. The values were initially (1981) derived from studies of costs of noise-reduction measures and changes in real estate values due to noise exposure (Hansson, 1994), i.e. a WTP approach. In 1986 VägV increased the values (excluding inflation) by approximately 100% which, combined with a decrease in the discount rate (from eight to five percent) for all VägV’s CBAs gave a real write-up effect of 200%. This write-up effect has been described as rather arbitrary (Wibe, 1992). The present recommendation regarding road noise (SIKA, 1999) is non-linear, which means a higher demand for noise reduction at higher initial noise levels. The values are expressed in 1999 prices and include a weighted average of indoor and outdoor exposure where a 25 dB(A) reduction from the facade is assumed.
41
Valuation (SEK/year/person)
Cost-Benefit Analysis of Separation Distances
16000 14000 12000 10000 8000 6000 4000 2000 0 50 51 52 53 54 55 56 57 58 59 60 61 62 63 64 65 66 67 68 69 70 71 72 73 74 75 Noise level, dB(A)
Figure 5:6. The annual valuation (in 1999 prices) of one person exposed to noise from roads at different noise levels. From SIKA (1999).
Note that these values only refer to road noise, and that the valuation of other sources of noise is likely to be different. SIKA claims that the model in Figure 5:6 can also be employed for railways if railways are given a 5 dB(A) general discount, a 30 dB(A) facade reduction and a weighting that means 90% of the values originate from indoor values. Assuming that the values derived for road noise provide an acceptable approximation of the overall value of noise exposure, raises the following questions. What is the initial level of noise, and how great a risk-reducing effect does distance have? The initial level of noise can be measured or calculated. NVV (Naturvårdsverket, 1996) presented a model for the calculation of noise from roads based on e.g. traffic intensity, speed, elevation differences and the nature of the surface. However, the possibility of obtaining any generic values from this model seems small. These values are also difficult to derive from noise inventories, as their aim is to assess the number of people exposed to different noise levels (see, for instance, Länsstyrelsen i Göteborgs och Bohus län, 1994). As in previous two parts most of the material found is transport related. Jonasson and Göransson (1995) made a survey of the phenomena of noise and the attenuation of noise. (a) Divergence (the dispersion of noise in different directions). The equivalent noise level decreases by 3 dB(A) when the distance is doubled. (b) Frequency composition. The attenuation varies between 0.1 and 80 dB(A) per 1000 metres for frequencies ranging from 60 to 4000 Hz. At high frequencies and long distances this effect is not insignificant. (c) Weather conditions (attenuation in air). The attenuation is small, approximately 0.5 dB(A) per 100 metres for road noise and 1 dB(A) per 100 metres for railway noise, and the effect is often neglected. Temperature and relative humidity affect the attenuation, but differently for different frequencies. (d) Ground attenuation (due to the nature of the surface). Acoustically soft surfaces such as grass and meadow land (also snow) decrease the noise by a maximum of 3 dB(A) when the distance is doubled. Acoustically hard surfaces, like concrete or asphalt, will not decrease the noise level.
42
Application to separation distances
(e) Wind. Most data are based on a moderate tailwind, which is also the basis for most calculations. Headwind will reduce the noise further, while an increase in the wind velocity will have the opposite effect. Empirical data from noise measurements at different distances are presented in Table 5:8. The presented noise levels employ a wind velocity of 3 m/s (a rough estimate of wind velocity data from Malmö referred to in Malmö Brandkår, 1999, yields 4 m/s). Table 5:8. Measured noise levels (dB(A)) at three different distances in a 3 m/s tailwind and headwind. From Larsson et al. (1979) referred to in Jonasson et al. (1995). Traffic intensity 1000 vehicles/hour 50 m
100 m
200 m
Tailwind
67
62.5
61
Headwind
64
58.5
53.5
The benefit of noise reduction thus depends on the nature of the sound, and the only data found refer to road noise. A change in separation distance of dx at the distance x0 (m) yields a change in area of dA (m2), and a subsequent marginal benefit from the reduction in people exposed to noise, can then be calculated as: MB( x0 ) = u ( NL( x0 )) ⋅ dA ⋅ ρ ⋅ k (r ) where
(5.3)
MB = the marginal benefit of the reduction in noise exposure u = the value of one person not exposed to noise level NL NL(x0) = equivalent noise level at distance x0, dB(A)
The total benefit of a reduction in noise exposure, due to a separation distance x0, can then be calculated as: x0
B( x0 ) = ∫ MB( x)dx
(5.4)
20
Noise is a problem mainly in housing areas as the tolerability of noise exposure in e.g. the working place and commercial areas is much higher. The value of separation distances in regard to noise is thus considered beneficial only for housing. The valuation will be dependent on the noise level and the specific source (noise characteristics).
5.5.4 Reduction in air pollution exposure Air pollution has local and regional effects and contributes to global effects. The primary aim of a separation distance is to reduce the local effects, i.e. health effects, increased corrosion and dirt. As the emission is different for different activities, the substances of interest vary. In order to define general air quality, a number of substances have been employed as basic references. These are nitrogen oxides, sulphur dioxide, carbon oxides, particles and polynuclear aromatic hydrocarbons. The recommendations of central authorities on limits for
43
Cost-Benefit Analysis of Separation Distances
various compounds are, however, divergent (Wibe, 1992), and none of these limits were examined regarding cost and benefits of measures needed to reach or maintain these levels. Attempts have been made to quantify and account for the effects of air pollution in road and rail planning. The results are expressed as a monetary value per emitted unit mass of different substances, and are intended to indicate the marginal effects of additional air pollution. The major economic impact of health effects is assumed to be the change in mortality risk. The values are obtained from assumptions on relations between emission and content, content and exposure and exposure and effect (SIKA, 1999). The values are derived in two steps. Firstly, the value “per exposure unit” is calculated, i.e. the value of one person exposed to 1 µg/m3 of the substance for one year. Secondly, the number of exposure units per kg of each emitted substance is calculated, taking into account population density. Finally, the actual emissions must be calculated. According to Gabinus et al. (1995) the model for the calculation of road transport emissions takes into account four different vehicles categories, and each vehicle category is represented by three different exhaust categories. Furthermore, tyre and vehicle wear are estimated, and different speed categories are considered. An exception in the valuation is the value for carbon dioxide, which is derived from the anticipated tax required on emissions to reach the target level of emissive levels in 2010, as agreed upon in the Kyoto agreement. The recommended value is SEK 1.50 (1999) per emitted kg CO2 (SIKA, 1999). A number of observations can be made. The valuation of the effects is differentiated for local and regional effects, and the valuation of local effects has a large variation due to the differences in population density. A rough estimate indicates that local effects are dominated by the emission of particles (>95% of the value), see Table 5:9. The regional value contributes less than 5% in densely populated cities and 10 to 15% in less densely populated towns and villages. Table 5:9. The valuation of air pollution (SEK/kg, 1999) for different compounds and cities, by SIKA (1999). The local valuation of NOx were not updated in 1999 since the effects of second-hand formation were not estimated, hence the parentheses Particles
VOC
SO2
NOx
-
30
20
60
Stockholm inner city (600,000)
7600
45
220
(49)
Södertälje (60,000)
2300
14
70
(49)
700
4
9
(49)
340
2
10
City (number of inhabitants) Regional valuation Local valuation
Laholm (6,000) Valuation (per exposure unit)
From the examples in Table 5:9 it can also be noted that the valuation of local effects in more densely populated areas may be ten times higher than in less populated areas (Stockholm vs Laholm). In fact, the valuation is a function of the square root of the affected population (SIKA, 1999). So far, the valuation has consisted of the marginal effect of differences in emission levels. The possibility of reduction due to increased distance has not been valued. Important 44
Application to separation distances
parameters in dispersion calculations, apart from discharge rate, are source height, ground roughness (topography), weather class (stability), wind velocity and turbulence. The maximum concentrations are not necessarily closest to the source (depending on source height) although this is the case for road traffic emissions. Leksell and Löfgren (1995) presented dose calculations in circles of 400 metres diameter, up to 13,600 metres. The model used should not be used within 200 metres. Leksell and Löfgren further concluded that: •
the exhaust plume from a street is spread over large areas of a town, i.e. the relation between emission and damage was less local than expected,
•
the dose contribution decreases relatively slowly as a function of distance.
Furthermore, they estimated that the total valuation of local health effects, in the case of road traffic, is about 20% of the accident cost, and the dirt effect is about 20 to 25% of the health effect cost. A change in separation distance of dx at the distance x0 (m) yields a change in area of dA (m2), and a subsequent marginal benefit from the reduction in air pollution exposure, can then be calculated as MB( x0 ) = w( PL( x0 )) ⋅ k (r ) ⋅ dA ⋅ ρ where
(5.5)
MB = the marginal benefit of reduction in pollution level w = the value of one person not exposed to pollution level PL PL(x0) = pollution level at the distance x0 (m)
The total value of the reduction in pollution exposure due to the separation distance x0 can then be calculated as: x0
B( x0 ) = ∫ MB( x)dx
(5.6)
20
However, reduction in pollution levels will not be further accounted for in this analysis because: (i) the dispersion models are not valid within 200 metres, and (ii) the emitted levels have an effect over such large areas that it is doubtful if separation distances would have any positive effect at all (as people will be exposed to several sources).
5.5.5 Other benefits In specific situations other factors may require consideration, such as smell and vibration. Valuation of such benefits could be undertaken in the same way as for other benefits, i.e. establish a value of the exposure and determine the exposure level as a function of distance. Another factor, which would be more difficult to quantify, is changes in the local environment for flora and fauna. In the absence of agriculture, housing, industrial and commercial utilization there is room for different species to breed and seek food and to move between biotopes. The variety of species and their living conditions may be improved. In the planning of new roads this encroachment is considered a cost, but SIKA (1999) has no recommended value. Both effects are difficult to quantify and were, therefore, neglected in this study.
45
Cost-Benefit Analysis of Separation Distances
The benefit of an option value might also be considered. The classic example is the option value of national parks, where it has been shown that people are willing to pay a certain amount to have the future of visiting a park; a value added to the WTP for the park (Weisbrod, 1964). It has been suggested that the option value can be divided into a quasioption value, a heritage value and an existence value (Hanemann, 1989 and Barrick & Beazley, 1990). In the case of separation distances, the safety zones constitute structural constraints for future development, and the option value could be regarded as a premium paid for the possibility to make future choices that would not be possible if not paid for now, i.e. an option for future decision possibilities. This was, however, neglected in this study. It could be argued that a reduction in near-accident costs should be included as a benefit, as they could involve quite expensive evacuation and rescue operations. This item is, however, only weakly dependent on the separation distance and was furthermore considered to be too small to be included in this study.
5.6 The costs The cost of implementing separation distances is determined by the area [E+B+C+F] in the economic model in Figure 5:2. This cost consists of the opportunity cost of land due to the restrictions, and administrative costs and specific cost items associated with the design and shaping of the zone.
5.6.1 Opportunity costs The main cost item resulting from restrictions in land use is the opportunity cost, since the area set aside within the separation distance should be considered the second best alternative. The opportunity cost was calculated as the market value of the land (land prices), which is an approximation since it neglects elasticity, see Figures 5:2 and 5:3. The value will vary significantly depending on the location and the adaptation for different purposes. Svarvar and Persson (1994) employed values in the range from SEK 5 to 400 per square metre, obtained from local planning authorities in Lund, see Table 5:10. Table 5:10. Land prices employed by Svarvar & Persson (1994) Land use Agriculture Industry in a village Industry in a city Housing in a village Housing in a city
Land price (SEK/m2) 5 25 200 150 400
Based on data from Real Estate Office in Malmö, Nilsson (2000) stated that the price of land in Malmö is dependent on location, and ranges from SEK 150 to 1500 per square metre, excluding land for agricultural use. See further in Table 5:11. Nilsson stressed the difference in total land area (TY) and building gross area (BTA), both expressed in square metres. For many purposes prices are given as the unit square metre BTA, building gross area, which is the total building area, all floors included. For the purpose of this study, our interest is in the 46
Application to separation distances
actual land area and therefore the measure required is the total land area, square metre TY. The BTA prices can be expressed as TY prices using the utilization coefficient γ: TY =
(5.7)
BTA
γ
In Malmö, representative values of γ range from 0.5 to 4 (the latter value corresponds to highrise buildings on small, central properties). A value of 1 should be interpreted as a one-storey building occupying all the land area of the real estate property. Table 5:11. Land prices from Nilsson (2000), adjusted for estimated utilization coefficients Land price Land use (SEK/m2 TY) Industry
400-725
Commerce
150-1500
Housing
550-1200
Since the costs range from SEK 150 to 1500 it is important to consider different values of the opportunity cost. In the cost-benefit calculation of a specific project it is possible to use the specific cost associated with the area of interest, but for the general case representative costs must be chosen. In this study, the costs of SEK 150, 400, 700 and 1000 (2000) were used. According to Nilsson, the cost of SEK 1500 is an extreme value for commerce, and SEK 1200 is applicable to a limited area only. A change in separation distance of dx at the distance x0 (m) yields a change in area of dA (m2) and a corresponding opportunity cost, which can be calculated as:
MC ( x0 ) = p( x0 ) ⋅ dA where
(5.8)
p(x0) = the land price for real estate property at a distance x0 (SEK/m2)
If a constant land price is assumed, p(x0) can be reduced to p. The total opportunity cost, due to the separation distance x0, can then be calculated as: x0
C ( x0 ) = ∫ MC ( x)dx
(5.9)
20
5.6.2 Planning, design and construction costs Whatever the land use, there is a cost associated with planning and designing the area. This cost includes negotiations, surveying and administrative costs, if required. This cost is, however, considered to be small and relatively constant irrespective of the intended land use. This cost is thus assumed to be negligible.
If it is planned to construct embankments, dikes or tree plantations there is an additional cost for construction. It is assumed that dikes and embankments are placed within 20 metres (the lower boundary) and that the costs and benefits thus are strongly coupled to this zone.
47
Cost-Benefit Analysis of Separation Distances
Construction cost is consequently neglected in this study. In the case of tree plantations, these are considered a possible, but not necessary, measure, and will also be neglected.
5.6.3 Management costs Depending on how the area within the separation distance is designed, it might require management on a regular basis. Embankments and dykes might need cutting (grass or bushes) or weeding, and a tree plantation might require pruning of trees as well as cutting of grass. The area might be exposed to littering, and waste collection or picking might be needed.
The management required is assumed to be small and, furthermore, not specific to the protective purpose. It is thus assumed that these costs are negligible.
5.6.4 Other costs The employment of separation distances on a large scale implies a “dispersion effect” on society, as the amount of unexploited areas increases, and urban areas grow. This, in turn, gives rise to longer travelling distances that will lead to higher emission as well as time losses for the travellers. The emission caused by traffic is considered to have regional effects and to contribute to global effects. Algers et al. (1995) have estimated values of travelling times, expressed in SEK per hour. The values (for journeys less than 50 km) were 34-54 for work journeys and 27-43 for other journeys. Applying a WTA approach, i.e. valuation of prolongation of travel times, the values ranged between 43-98 and 51-91. The dispersion effect on society is difficult to quantify, especially as a distance-related function. A related effect, encountered in road planning, is the barrier effect, which is the traffic’s separating effect on transfer habits and contact pattern among unprotected road users (Jansson, 1995). To evaluate this effect high demands are put on site-specific data. The safety zone formed by the separation distance might be regarded as inducing both a dispersion and a barrier effect, but neither was included in this study.
Two other items are worth commenting on. (a) Change in real estate values Depending on the land utilization, neighbours might experience an increase or a decrease in real estate values. These are not included, not because data are difficult to obtain or estimate. The reason is that the effect be taken into account twice, as these changes constitute capitalization of the benefits of the specific location and surroundings, which is included in the calculations. (b) Remaining value. After the economic lifetime has ended, it is assumed, by definition, that bt-ct50
Area (km2)
50-999
33
1415
1000-1999
22
161
2000-2999
11
48
3000-3999
7
21
4000-4999
9
20
>5000
17
22
Characteristics Village Town
City
Figure 6:3. Population densities in Skåne. The legend gives the number of inhabitants within each cell of 1 square kilometre (Dec. 31, 1999). From Region Skåne (Arvidsson, 2001), with permission.
55
Cost-Benefit Analysis of Separation Distances
The maximum value of ρ in Gothenburg is stated to be 17,100 and in Skåne 14,000. Based on the data above a general value of 4100 was chosen. This is the mean value of the areas in Skåne in which ρ exceeds 2000, which could be interpreted as a suburban area with apartments and houses. In the sensitivity analysis values ranging from 500 to 6000 were employed. Regarding the exposure index, ε, Svarvar et al. (1994) did not employ one. ACDS (1991) linked the exposure index to the weather conditions (yielding 0.10 for 80% of the time and 0.01 for 20% of the time). Jacobsson (1996) suggested a factor of 0.10. The Malmö Fire Brigade modified this value to 0.10 for daytime and 0.01 for night-time populations, regarding housing (Malmö Brandkår, 1999). For commercial areas, a value of 0.20 was assumed. In this study a value of 0.20 was employed. In the sensitivity analysis, values in the range from 0.05 to 0.35 were employed. Despite the differences in noise sources and levels, the noise level as a function of distance is required in order to calculate the benefits. The function must be decreasing (negative dNL/dx) but the rate of decrease slowing down. The following arbitrary function is suggested: NL =
90 x 0.08
(6.6)
20 ≤ x ≤ 500
The function is presented in Figure 6:4. The derived values were compared with the measured noise levels from Jonasson et al. (1995), presented in Table 5:8, and found to be a slight overestimate.
80 70 60
dB(A)
50 40 30 20 10 0 0
80
160
240
320
400
480
Distance (m) Figure 6:4. The noise level (in dB(A)) as a function of distance.
The benefit of noise reduction is expressed by SIKA (1999) as an annual value per exposed person, and is a function of the noise level. These values form the basis for this analysis,
56
Results
assuming it is also a fair approximation in 2000 prices. The function (Figure 5:6) can be expressed as a polynomial expression on the form n
u ( NL) = ∑ ai ⋅ NLi
(6.7)
i =0
Using the polyfit function in Matlab for n=4 gives a function that has a maximum deviation to the SIKA values of 7% in the interval 52 to 75 dB(A). The coefficients obtained: a0=735315 , a1=-53798.61 ,
a2=1466.079 ,
a3=-17.66871 ,
a4=0.07967578
By combining Eqs (6.6) and (6.7) an analytic expression for the monetary benefit, as a function of distance, was obtained, u(NL(x)).
6.1.2 CBA for all benefits The results of the calculations based on Eq. (6.3) and general parameters are presented in Figure 6:5. 1,2 1,0
G
0,8 0,6 0,4 0,2 0,0 0
40
80
120
160
200
240
280
320
360
400
440
480
Distance (m) 150
400
700
1000
Figure 6:5. The marginal benefit-cost ratios for different land prices (SEK/m2) as a function of the separation distance, using best estimates and general parameters.
The cost-benefit ratio falls rapidly for shorter separation distances and then declines slowly. For land prices of 700 or 1000 (SEK/m2) G never exceeds 1.0. For a land price of 400 G equals 1.0 within 40 metres, and for a land price of 150 G equals 1.0 at 120 metres. The results of the calculations are thus sensitive to the lower boundary (20 m). Most recommendations presented in Section 2.3 seem large.
57
Cost-Benefit Analysis of Separation Distances
A correlation between land price and population density (higher land prices in more densely populated areas) was considered as relevant but the effect was not quantified or treated specifically.
6.1.3 CBA for accident risk reduction only If the single objective is to reduce risk by separation distance it would be of interest to determine the benefit-cost ratio of a reduction in loss of lives, including injuries and material damage. The results are presented in Figure 6:6. This is of interest since (i) the general noise level function is based on road noise and for other activities the noise levels and valuation will be different, (ii) the cost-effectiveness of distance as a noise reduction measure is doubtful and (iii) because such noise reduction is of interest only for housing areas.
1,2 1,0
G
0,8 0,6 0,4 0,2 0,0 0
40
80
120
160
200
240
280
320
360
400
440
480
Distance (m) 150
400
700
1000
Figure 6:6. The marginal benefit-cost ratios for risk reduction only, at different land prices (SEK/m2) using best estimates and general parameters.
It can be seen that the benefit-cost ratio is considerably less than in the case where noise reduction is included. The contribution to the total benefits by the noise reduction varies roughly between 80 and 95%; the higher percentage at short and long distances and the lower at moderate distances. This means that the results are greatly dependent on the general noise level and the valuation of noise exposure. No benefit-cost ratio exceeds 1.0 at any land price, which suggests that separation distance, as a measure merely for risk reduction, is ineffective. The lower boundary of 20 metres becomes critical. Most recommended and discussed distances presented in Section 2.3 appear very large in comparison.
58
Results
6.2 Uncertainty The purpose of this section is to deal with questions of reliability of the results presented in Section 6.1 in terms of uncertainty. A common way of discussing uncertainties is in terms of epistemic vs aleatory uncertainties (Paté-Cornell, 1996), where aleatory uncertainty represents the randomness of variables (stochastic uncertainty) and epistemic uncertainty represents a lack of knowledge (knowledge uncertainty). Both can be treated in a probabilistic way if expressed as distributions or degrees of belief.
COWI et al. (1996) proposed a hierarchical structure of four classes (levels) of uncertainties in QRAs, linked to the process of preparing the analysis. i. Knowledge and resources This class of uncertainty refers to uncertainties in the scientific knowledge domain of the phenomenon studied, and to resources available for the analysis that will affect the competency and state-of-the-art tools that will be employed. ii. Assumptions In the introductory phase of the analysis the analysts will make definitions and assumptions. iii. Models Both conceptual and mathematical models will be employed in the analyses and they represent simplifications of reality, thus involving uncertainty. iv. Input All models of quantification involve parameters or variables, and the uncertainty in these will be propagated to the output, i.e. the results of the analysis. The hierarchical structure means that uncertainties in classes/levels (i), (ii) and (iii) in turn restrict the lower level(s). The uncertainties in knowledge, assumptions and models have, to a large extent, been presented throughout this dissertation, and will be further discussed in Chapter 7. This section focuses on input uncertainty and is divided into three parts. Firstly, input uncertainty is studied and, to some extent, quantified in a sensitivity analysis. Secondly, the influence of risk aversion is investigated. Thirdly, the conditions for a fully probabilistic uncertainty analysis are explored, and such un analysis is partially performed.
6.2.1 Sensitivity analysis In the sensitivity analysis, the benefit of noise reduction was ignored, even though this may seem to be the main benefit in the general calculations and consequently could be expected to contribute most in a sensitivity analysis. The reasons for this are that this benefit is restricted to housing, that separation distances can be recommended based on accident risk reduction only, and that the noise level function is rather arbitrary (derived from road noise measurements).
The five parameters and variables selected for the sensitivity analysis were the value of a statistical life, the discount coefficient, the individual risk level, the population density and the exposure index. They are presented in Table 6:4 with best estimates, uncertainty factors and assumed maximum and minimum values. The uncertainty factor, UF, is the factor the best estimate should be multiplied (or divided) with to get the maximum and minimum values. Uncertainty factors for maximum and minimum values are presented separately (UFmax and
59
Cost-Benefit Analysis of Separation Distances
UFmin). The total uncertainty factor, TUF, was calculated for all maximum and minimum values, respectively. Table 6:4. The parameters and variables included in the sensitivity analysis and their range of values with corresponding uncertainty factors (UFmin, UFmax, and the product ∏UFi) and total uncertainty factors (TUF; the products of UFmins and UFmaxs, respectively) Parameter
Min
UFmin
Best estimate
UFmax
Max
∏UFi
5
6.0
30
1.67
50
10.0
13.3
1.29
17.2
1.34
23.1
1.7
c k (r)
5.0
IR (x)
5.0
25
ρ
500
8.20
4100
1.46
6000
12
ε
0.05
4.0
0.2
1.75
0.35
7.0
TUF
1273
29
36474
From the total uncertainty factors of each variable or parameter (∏UFi) it can be seen that the variables or parameters most influencing the results are risk level, population density and the value of a statistical life. The exposure index and especially the discount rate have little influence on the results. One conclusion that can be drawn from the total uncertainty factors of all parameters (TUF) is that the best estimate is closer to the maximum value than the minimum value. The land cost is also regarded as an important parameter, which can vary significantly (an ∏UFi of ten; 150 to 1500), but rather than including the interval of the land cost in the calculations, a point estimate of 400 (SEK/m2) was employed. The resulting interval of benefit-cost ratios is presented in Figure 6:7.
10,0000 1,0000 0,1000
G
0,0100 0,0010 0,0001 0,0000 0,0000 0
40
80
120
160
200
240
280
320
360
400
440
480
Distance (m)
Figure 6:7. The interval of the marginal benefit-cost ratio (G) as a function of distance. Dotted lines represent maximum and minimum values, whereas the full line represents the best estimate for 400 (SEK/m2). Due to the large variability in G the y-axis is logarithmic.
60
Results
The results obtained suggest a large uncertainty, which is explained by the fact that the model is based on the multiplication of several variables.
6.2.2 Risk aversion To be risk neutral in individual decision-making is to act according to expected values, no matter the stakes, whereas to be risk avoidant is to demand overcompensation to consider selecting uncertain alternatives. Furthermore, to be risk seeking is to select uncertain alternatives even when expected values suggest not. The three categories can be explained in terms of certain equivalents (CE). Consider the option of (i) definitely receiving SEK 1,000 (CE) or (ii) SEK 1,000,000 at a 0.001 probability. The expected value is the same. Which would you choose? A risk neutral decision-maker, acting according to expected values, would be indifferent. A risk avoidant decision-maker would choose (i) rather than the uncertain alternative (ii); in fact he/she would choose the CE even when it is lower than the expected value (how much lower is a measure of risk avoidance). The opposite is true for a risk seeking decision-maker.
The term “risk aversion” has been introduced to describe why society seems to consider one accident causing many deaths as more serious than several accidents causing one death each, even if the total number of deaths is the same. A more strict term would be “high consequence aversion”, as the term “risk aversion” actually refers to individual utility differences and associated individual decision-making. The relevant question in this study is if and how high consequence aversion should be included. The main motive for taking aversion into account is that subjective values and public perception should matter. The public may perceive a risk to be greater than the objective representation of risk suggests, depending on value attributes. There is a problem, however, in separating misinformation from values, as Cross (1998) pointed out. Several studies have shown that the public overestimate the risks arising from low-probability risks and underestimate high-probability risks. These findings have been explained as depending on biases such as availability, anchoring and representativeness (Kahneman, Slovic & Tversky, 1982). These biases suggest that people in general draw conclusions from insufficient, or even irrelevant, data. Another motive is that when catastrophes occur, a whole nation can be paralysed, causing huge costs. The if-question is basically a matter of rationality. How much consideration should be taken to public’s, somewhat skewed, perception? Is it rational in governmental policy-making to take aversion into account? How much consideration should be taken of vague, possibly immeasurable, economic effects of paralysis? Rationality could furthermore be traced to the individual decision-maker. In the aftermath of an accident it is not unusual that a search is made for a scapegoat: someone has to bear the blame. No decision-maker likes to explain why certain measures were not taken that could have saved lives. The question of whether aversion should be taken into account could be supplemented with if aversion can be taken into account, since it has been noted that a catastrophe can still lead to a high number of fatalities, despite the fact that a separation distance was employed. Aversion merely puts a higher value on situations where the avoidance of risk exposure involves more people.
61
Cost-Benefit Analysis of Separation Distances
To take high consequence aversion into account, the calculations must be adjusted. ACDS (1991) and Allen et al. (1992) proposed similar ways of doing this. The principle is to employ an aversion factor, α, as the exponent of the number of people at risk, N0 (in the consequence assessment), to calculate a new (fictitious) number of fatalities, N1. N1 = N 0 ⋅ N 0α
(6.8)
The effect on the number of fatalities is calculated for some values of α in Table 6:5 (setting α=0 means no aversion). Table 6:5. Implied number of fatalities,N1, for different aversion factors, employing Eq. (6.8) N0
α=0.1
α=0.2
α=0.3
α=0.4
α=0.5
10
13
16
20
25
32
100
158
251
398
631
1000
1000
1995
3981
7943
15,849
31,623
It is possible to construct the aversion factor in such a way that aversion is increased even more, employing an exponential function such as: N1 = N 0 ⋅ e
(6.9)
( λ⋅ N 0 )
For λ=0.1 the implied number of fatalities, N1, are calculated to be 14, 272 and 23624 (for N0=10, 100 and 1000). However, in this study there are no scenarios in which the number of fatalities can be increased. It would still be possible, however, to increase the number of people exposed to risk. The principle would still be to recalculate the number of people affected by an increasing factor. Eqs (6.8) and (6.9) are, however, counteractive when N