Oyu Tolgoi, Mongolia
Copper supply and demand outlook Andrew Harding Chief executive, Copper
©2012, Rio Tinto, All rights reserved
Cautionary statement This presentation has been prepared by Rio Tinto plc and Rio Tinto Limited (“Rio Tinto”) and consisting of the slides for a presentation concerning Rio Tinto. By reviewing/attending this presentation you agree to be bound by the following conditions.
Forward-looking statements This presentation includes forward-looking statements. All statements other than statements of historical facts included in this presentation, including, without limitation, those regarding Rio Tinto’s financial position, business strategy, plans and objectives of management for future operations (including development plans and objectives relating to Rio Tinto’s products, production forecasts and reserve and resource positions), are forward-looking statements. Such forward-looking statements involve known and unknown risks, uncertainties and other factors which may cause the actual results, performance or achievements of Rio Tinto, or industry results, to be materially different from any future results, performance or achievements expressed or implied by such forward-looking statements. Such forward-looking statements are based on numerous assumptions regarding Rio Tinto’s present and future business strategies and the environment in which Rio Tinto will operate in the future. Among the important factors that could cause Rio Tinto’s actual results, performance or achievements to differ materially from those in the forward-looking statements include, among others, levels of actual production during any period, levels of demand and market prices, the ability to produce and transport products profitably, the impact of foreign currency exchange rates on market prices and operating costs, operational problems, political uncertainty and economic conditions in relevant areas of the world, the actions of competitors, activities by governmental authorities such as changes in taxation or regulation and such other risk factors identified in Rio Tinto's most recent Annual Report on Form 20-F filed with the United States Securities and Exchange Commission (the "SEC") or Form 6-Ks furnished to the SEC. Forward-looking statements should, therefore, be construed in light of such risk factors and undue reliance should not be placed on forward-looking statements. These forward-looking statements speak only as of the date of this presentation. Nothing in this presentation should be interpreted to mean that future earnings per share of Rio Tinto plc or Rio Tinto Limited will necessarily match or exceed its historical published earnings per share.
©2012, Rio Tinto, All rights reserved
2
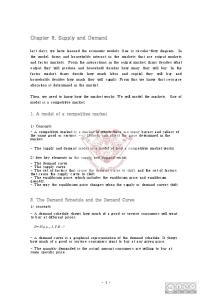
Market outlook: Mixed developments for the global economy Price performance, indexed to Jan 1st 2010
GDP Growth Forecast for 2012 (Y-o-Y % chg) Forecast in Oct 2011
180
Latest view
160
LME-Copper, Grade A Cash RBA Index of Base Metals Brent S&P 500
0.3 Eurozone -0.4
140
120 1.4 USA
100
2.1
80 8.1 60
China 8.2
40 -2.0
-
2.0
4.0
6.0
8.0
10.0
Y-o-Y% Change Source: Thomson Reuters, Global Insight ©2012, Rio Tinto, All rights reserved
3
Demand: China will continue to drive demand China’s GDP growth is slowing
China has plenty of growth potential
China’s GDP levels and growth forecast
Per capita refined copper consumption (kg)
US$bn 2005
kg pc
Y-o-Y%
12000
18 Germany
16
USA
14
China
12
GDP Level (RHS)
16
GDP (Y/Y%) (LHS)
14
10000
12 8000
10
Japan
10
8
6000
8
6
4000
6
4
4
2000
2 0 0
10,000
20,000
30,000
40,000
GDP pc 50,000
2
0
0 1990
1995
2000
2005
2010
2015
2020
2025
Urbanisation to continue
China and India will make up 50% of demand by 2020
U.N. World Urbanisation Prospects % 1950 to 2050
Forecast share of refined copper demand
100 80 60
60% 50%
China
India
40% 30%
40
20% 20
10% 0
1950 1960 1970 1980 1990 2000 2010 2020 2030 2040 2050 USA China India
0% 2000
2005
2010
2015
2020
Source: UN, Global Insight, Brook Hunt ©2012, Rio Tinto, All rights reserved
4
Supply: Growth will continue to be challenged Supply is evolving from traditional sources • An increasing proportion of potential new supply
Copper mine production (kt Cu) 100%
is located in riskier countries.
Mongolia Peru
75%
• More challenging environments subject to a lack
Chile 50%
of infrastructure imply an increase in the capital
China Nth America
intensity of new projects.
25%
Africa
• Recent supply has continued to underperform
Other
0% 2000
2010
with decreasing grades and disruptions
2020
impacting production. Decreasing grades • Major causes of supply disruption will continue
Copper Grade %1 Historical
1.8
−
Technical complexity
−
Project delays
−
Labour strike action
1.6
(% Copper)
1.4 1.2 1.0 0.8 0.6 0.4 0.2 0.0 1990
1995
2000
2005
2010
2015
2020
2025
Source: Brook Hunt - a Wood Mackenzie Company, Rio Tinto Analysis, National Institute of Statistics Chile and Peru ©2012, Rio Tinto, All rights reserved
5
Rio Tinto: Continued investment in our assets KUCC
•
Bingham Canyon mine extension
•
Molybdenum Autoclave Process (MAP)
•
Underground expansion study
©2012, Rio Tinto, All rights reserved
Escondida
• • •
Organic Growth 1 Project Oxide Leach Area Project Ore access, bioleach and debottlenecking projects
Grasberg
• • •
Grasberg Block Cave Deep Mill Level Zone (DMLZ) 40% of total production 2021
6
Oyu Tolgoi: A world class asset
• A top five copper producer and major gold producer1
Large
• Average annual production of 450 kt of copper and 330 koz of gold
Long Life
• 3.1bt resource and 1.4bt reserve • Potential for a > 50 year mine life • Highly prospective region with further exploration potential.
Low costs
• Significant by-product credits from gold • Expected to have first quartile net unit cash costs
Note: 1. Ranked using 2013 Brook Hunt mine production data and Oyu Tolgoi’s full capacity production. Source: Brook Hunt a Wood Mackenzie Company, Rio Tinto, Oyu Tolgoi LLC
©2012, Rio Tinto, All rights reserved
7
Oyu Tolgoi: On track for first commercial production by 2013
Phase 1: 1
Open Pit mine
2
100,000 tonne per day concentrator
3
Preliminary development of UG mine
Phase 2:
©2012, Rio Tinto, All rights reserved
1
Complete development of UG mine
2
Mill expansion
3
Power station
8
La Granja:
Potential 500ktpa Cu for 40+ years • Substantial additional mineral inventory identified Major new porphyry system has been discovered adjacent to the existing deposit • 41,500m of drilling completed , next phase of drilling (52,000m) commenced for completion by H1 2013 • Approval to complete pre-feasibility study for starter mine received in November • Starter mine conceptually planned to commence 2016 • Investment decision expected ~2014 for phase 1 development • First cathode product from heap leach 2017
©2012, Rio Tinto, All rights reserved
9
Resolution:
First production ~2021, potential 600ktpa • High quality resource – 1.47% copper with significant molybdenum Shaft 9
Shaft 10
• Top of resource about 1.5 km deep, with production level 2 km deep • Land exchange bill approved in US House of Representatives • Sinking shaft No. 10 to begin underground feasibility study • US $103 million approved to deepen shaft No. 9 to mine level
©2012, Rio Tinto, All rights reserved
10
Underground:
Leveraging our block caving expertise • North Rim Skarn pathway for underground development at KUCC
Projects
• Step-change project with potential to increase Northparkes to 150ktpa
• Block Caving Knowledge Centre • Partnership UNSW
Capability • Virtual training in underground • April first students commence
• Rapid Underground Development
Technology
• Shaft &Tunnel boring systems • Potential to develop underground mines 40% faster
©2012, Rio Tinto, All rights reserved
11
Technology:
Driving our competitive advantage
“Rio de Cobre” Technology Alliance
Copper NuWave™ recovery innovation
• Partnership entered into in 2009
• Pilot plant in construction at Kennecott
• Joint technology opportunities across
• Commissioning Q2 2012
surface and underground mining as well
• Upgrade marginal ore or waste material
as mineral recovery
• Reduction in energy consumption
©2012, Rio Tinto, All rights reserved
12