ERIK NORLAND, SENIOR ECONOMIST AND EXECUTIVE DIRECTOR, CME GROUP
27 JANUARY 2016
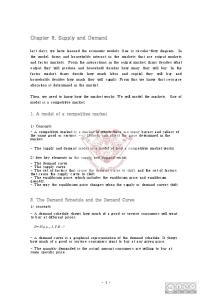
Copper: Supply and Demand Dynamics All examples in this report are hypothetical interpretations of situations and are used for explanation purposes only. The views in this report reflect solely those of the author and not necessarily those of CME Group or its affiliated institutions. This report and the information herein should not be considered investment advice or the results of actual market experience. COMEX copper futures made headlines in early January by falling below $2/lb for the first time since 2009. The metal recently traded as much as 57% off its peak levels from 2011. This paper explores why copper prices have collapsed, and what might be in store for the metal in 2016 and beyond. Generally, when people discuss copper, most of the focus is on the demand side. Indeed, the slowdown in China, a major consumer of the metal, is a key reason why copper is under pressure. But, one must not overlook the supply side. Copper-mining supply doubled between 1994 and 2014, and probably held steady or continued to grow in 2015. What’s even more notable is that copper supplies might keep growing despite the collapse in prices, as they did in 20082010 when production rose about 3% despite the price plunge during the financial crisis (Figure 1).
Supply Side Coppernomics: Increasing Supplies Cause Prices to Slide It’s no secret why mining supply has increased so dramatically since 1994: mining copper is, or at least was, highly profitable. From 2011 to 2014, the total cost of producing one pound of copper hovered around $2. By comparison, prices averaged above $4 per lb in 2011, and over $3 per lb from 2012 to 2014. Even in 2015, copper prices averaged close to $2.50 per lb, roughly 25% above the cost of production. Only now, at the beginning of 2016, have prices come down to what had been the all-in cost of production back in the 2011-2014 period (Figure 2).
Figure 2: Production costs and selling prices in USD (cents) / lb.
Figure 1: Mining supply has doubled since 1994.
Copper Production Costs and Selling Prices
Copper Mining Supply 450 20000
400
18000
Average Selling Price for 2011 - 2015, opening price for 2016 350
16000
300 USd Per Pound
Millions of Tons
14000 12000 10000 8000
250 Total Cost of Production
200
Net Cash Cost
150
6000
100 4000
50 2000
0
2012
2013
2014
2015
2016
19 99 20 00 20 01 20 02 20 03 20 04 20 05 20 06 20 07 20 08 20 09 20 10 20 11 20 12 20 13 20 14
97
2011
98
19
19
95
96
19
19
19
94
0
Source: U.S. Geological Survey
Source: GFMS Copper Survey 2013 and 2015, Bloomberg Professional (HG1), CME Group Economic Research Calculations
1
It’s tempting to say that with copper prices as low as they are currently, that mining companies will cut back on production. But, the jury’s still out. What complicates the analysis is the fact that we don’t have production-cost numbers for 2015 yet, but there are three reasons to think that they fell significantly:
Figure 3:
1) �The currencies of copper-producing nations have fallen dramatically: down 10.4% in 2014 from 2013, and down by 13.4% in 2015 from 2014 (see appendix for details). This should reduce the labor costs of producing copper across much of the copper mining world, not least of all in Chile, which supplies 31% of the world’s copper ore. 2) �Mining companies are cutting costs: from 2003 to 2014, the focus was mainly on adding production to keep pace with soaring demand, notably from China. With demand growth tapering off, or even declining, the new focus will be on reducing unit cost of production. 3) �Energy prices have collapsed, and mining/refining copper is highly energy intensive. As such, our guess is that while investment in future copper production is likely to decline, potentially depressing mining production in the 2020s, copper production over the next several years is most likely to either flatline or increase further.
Appendix:
These six variables account for about 42% of the movement in copper prices over the period from January 2006 to December 2015 (Figure 3). The strongest influence on copper, by far, is oil, as measured by West Texas Intermediate crude (WTI). A 10% rise (fall) in oil prices correlated with a 2.9% rise (fall) in copper prices, with a 0.8% standard deviation and given the other factors. Movements in the S&P 500® exerted the second strongest influence on copper: a 10% rise in the S&P tended to send copper prices about 3.9% higher, on average, with a 1.8% standard deviation, given the other factors. Chinese stocks, measured by the FTSE China A50, also had an influence but not as strongly. Copper also correlates with the U.S. dollar (USD). A weak USD tends to mean higher copper prices and vice versa. Finally, copper exhibits a fairly modest, and, by most measures, not a statistically significant negative response to Fed rate hikes. These factors go a long way toward explaining why copper has done so badly: oil prices have collapsed, USD has soared, equity prices have stagnated in the United States and fallen in China, and the Fed hiked rates for the first time in nearly a decade in December. But what’s the outlook going forward?
Which Financial and Commodity Market Forces Drive Copper Prices? In order to answer this question, we did a simple regression analysis using 10 years’ worth of monthly price-change data for copper and regressing six different market factors:
Oil prices: We see oil prices as being in the process of forming a bottom, which is not the same as saying that they have already hit bottom. U.S. production may have peaked in 2015 and might begin to decline in 2016. The decline in North Sea production that began around the year 2000 will likely accelerate. Middle Eastern and Russian production will probably continue at full tilt, but potential geopolitical instability, especially in the Middle East and Venezuela, poses increasingly significant upside risks.
2
China and the equity markets: While U.S. stocks exerted the strongest influence on copper prices during the period from 2006 to 2015 (on average), questions over the direction of Chinese stocks loom large in the copper market as we begin 2016. China has numerous challenges and its troubles boil down to a number of intermediate-to-long-term problems:
Figure 4: China’s Private Sector More Highly Leveraged Than its Emerging Market Peers. Private and Public Sector Debt
250
Government Private
200 Debt as a % of GDP
150
100
50
ex ic o
Ru ss ia
ne si a
M
In di a
Br az il
Tu rk ey
Po la nd
In do
Cz ec h
Th ai la nd Re pu bl ic Ar ge nt in So a ut h Af ric a
0 Ch in a H un ga ry
Just to reiterate, we see oil prices mainly as a supply-side issue for copper. Mining and refining are both energy-intensive businesses. While oil isn’t the only or even the main source of energy that these operations require, lower prices for crude and refined products will likely reduce the cost of operating mines and metals refining operations. This will marginally boost supply by reducing the breakeven point of copper businesses worldwide. Oil’s impact on the demand side is more mixed. It will hurt demand in countries that are net oil exporters, including the Persian Gulf nations, Russia and parts of Latin America, and Africa. On the other hand, lower oil prices are likely to boost economic activity and, therefore, copper demand in the non-oil exporting world, which accounts for roughly 86% of global GDP.
Source: "Deleveraging, What Deleveraging?" Buttiglione et al, International Center for Monetary and Banking Studies
1) �China is beginning a structural slowdown as its productivity-enhancing rural-to-urban transition passes the half-way mark, and as its population ages.
The S&P 500® is a more complex picture. On the negative side, U.S. corporate earnings appear to have stalled and might start to decline. Declining earnings won’t necessarily cause stocks prices to drop right away, but might eventually lead to a bear market or, at least, to greatly increased market volatility. Overall, the equity picture and its influence on copper might grow more negative as 2016 progresses.
2) �China has exceptionally high levels of private sector debt (Figure 4), which are weighing on economic growth and hurting Chinese stocks, which have a very high weighting to the financial services sector (69% of the FTSE China A50 Index market capitalization).
Currency: For the reasons outlined above, the Chinese currency might fall quite dramatically versus USD in the coming months and could put other currencies under downward pressure as well. If this does indeed occur, it will likely be bad news for copper.
3) �The Renminbi is overvalued and probably needs to fall further significantly.
On the other hand, those with an economic stake in being ‘long’ copper might be cheered by the performance of the euro and yen versus USD. Neither currency moved much after the Fed rate hike.
4) �China’s growth model depends heavily on private and public investment spending, as well as exports. Exports have stalled while investment spending is earning increasingly low returns. China needs to boost consumer spending to replace its dependence on investment spending and exports, but doesn’t appear to have a plan in place to help navigate the transition.
Interest rates: U.S. and China: Fed Funds Futures currently price an interest rate hike roughly every six months or so, with the next one most likely to come around June 2016. However, a number of Federal Open Market Committee (FOMC) members described the December 2015 hike as being a “close call.” In order for another interest rate hike to happen, we will need to see a sustained rise in the headline and core rates of inflation back up towards their 2% target. With oil prices still collapsing, this might not happen on the time schedule that the Fed would need to hike rates as quickly as priced by the market.
3
The more important rates for copper, though, might be Chinese rates. A complex trade developed for a while with copper whereby traders used copper as an asset to facilitate the carry trade between the Chinese Renminbi (RMB) and USD. Now that RMB controls are set to be loosened, and the Peoples Bank of China (PBOC) is in the process of cutting rates even as the Fed gradually tightens, warehousing copper to facilitate that trade is likely to become less and less necessary (Figure 5). This could add to downward pressure on copper prices in 2016.
Figure 5: PBOC likely to ease policy further, possibly putting copper under more downward pressure.
segments. China has been on a building boom and consumes roughly one-third of the copper used in construction or about 10% of total world demand (Figure 7). If the Chinese building boom grinds to a halt, it is not obvious what segment will pick up the slack. The U.S. housing market’s use of copper pales in comparison to China’s, and the U.S. construction sector appears to be growing unevenly, at best. We do expect a pickup in Europe and Japan but nothing that will compensate for reduced Chinese demand.
Figure 6: Building construction is the main downside risk for copper demand. Copper Demand by Source
PBOC monetary policy tools
Industrial Machinery and Equipment: 9.4%
25
Consumer and General Products: 9.8%
20
Building Construction: 30.7%
Reserve Requirement Ratio
15
Transportation Equipment: 11.4%
10
5
Lending Rate Deposit Rate
Electrical and Electronic Products: 38.7%
19 99 20 00 20 01 20 02 20 03 20 04 20 05 20 06 20 07 20 08 20 09 20 10 20 11 20 12 20 13 20 14 20 15
97
98
19
19
19
96
0
Source: GFMS Copper Survey 2015 Source: Bloomberg Professional: CNDR1Y, CHLR12M and CHRRDEP
As such, the interest rate picture, in our view, remains bearish for copper, especially on the Chinese side of the equation. Whether inflation perks up enough in the United States to convince the Fed to hike rates again remains to be seen.
Figure 7: China accounts for 1/3 of copper used in building construction = 10% of world total usage. Copper Demand Trends: Building Construction 7000
Demand Side Coppernomics
What is of greater concern is copper’s use in building construction, and industrial machinery and equipment
Rest of the World
5000 Tousands of Tonnes
Copper faces a fairly mixed demand picture going into 2016. Approximately 45% of the world’s copper ore transits China, where it is made into a variety of products. The single largest use of copper is electronic products (Figure 6). On the positive side from a copper demand perspective, global demand for electronic goods is likely to continue to grow. Whether the products are assembled in China or not doesn’t matter because most of the end users aren’t Chinese and are, therefore, unlikely to be negatively impacted by developments in China. Likewise, copper’s use in consumer and general products, as well as transportation equipment, is unlikely to be too negatively impacted by slowing demand growth in China.
6000
4000
USA Japan
3000
EU-28
2000 China 1000
0 2006
2007
2008
2009
2010
2011
2012
2013
2014
Source: GFMS Copper Survey 2015
Overall, we see copper demand as not growing very quickly, and potentially lagging the growth in supply. As such, it wouldn’t surprise us if copper prices retest their 2009 lows around $1.25 per lb at some point in 2016 or 2017. Crude oil,
4
which as we have seen correlates quite positively with copper, has already retested those yearly lows and might head even lower before hitting bottom (Figure 8).
Figure 8: Crude oil is back at (or through) its 2009 low but copper is still holding out. Crude Oil and Copper 500
COMEX High Grade Copper
450
400
400
350
350
300
300 250 250 200 200 150
150
100
100
50
50
West Texas Intermediate Crude
5
20 16
20 1
20 13
20 14
1
2
20 1
20 1
20 10
1 20 02 20 03 20 04 20 05 20 06 20 07 20 08 20 09
0
20 0
0
0
20 0
COMEX High Grade Copper in USd/Pound
West Texas Intermediate Crude Oil in USD/Barrel
450
Source: Bloomberg Professional (CL1 and HG1)
There are upside risks to copper prices, too. The greatest upside risks would be positive-growth surprises in China, as well as a sustained rise in oil or equity markets.
Copyright © 2016 CME Group. All rights reserved.
5