Consumer Rationality and Economic Efficiency:
.....
Balakrishnan,
Nataraajan and Desai
CONSUMER RATIONALITY AND ECONOMIC EFFICIENCY: IS THE ASSUMED LINK JUSTIFIED? P. V. (SUNDAR) BALAKRISHNAN, University o/Washington at Bothell RAJAN NA TARAAJAN, Auburn University ANAND DESAI, Ohio State Universi~ In this paper, the authors investigate a basic assumption underlying most models based on social or mathematical psychology that consumers are rational in the sense of choosing the most economically efficient brand. Using Data Envelopment Analysis (DEA) for measuring the efficiency of individual consumer choice, they report the results of two empirical studies, one involving the social psychology based theory of reasoned action and the other involving the mathematical psychology based traditional conjoint analysis, that were conducted to investigate the economic efficiency underlying the individual choice predictions of the particular model. Results indicate that, in either case, the predictions are not independent of economic efficiency. Further, either model has a significantly higher first choice hit rate for the homo economicus group than for the other group. Implications of these results for market segmentation as well as directions for future research are discussed.
.INTRODUCTION
It is common knowledge that the choice process has captured the attention of a diverse group of researchers spanning economics, social psychology, mathematical psychology, and of course, marketing. Although there are virtually countless contexts characterized by the choice process, choice behavior enacted within the consumer-marketplace domain is the most relevant for the practicing marketing manager. By and large, the choice process in general and consumer choice in particular have been well researched. Nevertheless,to our best knowledge, one cardinal assumption has remained untested in the literature, and it has to do with the role of economic efficiency in the consumer choice process. This paper focuses on this aspect. The theory of efficiency of consumer choice stems from an axiom within the larger assumption of rationality in decision making embedded in both The Marketing Management Journal Volume 10, Issue 1, pages 1-11 Copyright «:>2000, The Marketing Management All rights of reproduction in any form reserved.
1
Association
social psychology and mathematical psychology. This axiom states that consumers are rational in the sense of choosing the most economically efficient brand. The primary purpose of this research is to investigate this basic assumption underlying various models of consumer choice. Toward this end, two separate studies were conducted which are reported here. In both studies, we employed Data Envelopment Analysis (DEA) for measuring the efficiency (or inefficiency) of individual consumer choice. In view of this, before we describe these studies, it is imperative that we first elucidate the concept of efficiency of individual consumer choice and then furnish a brief description of DEA. EFFICIENCY OF CONSUMER CHOICE Lancaster (1966; 1971) modified the concept of a good, and consequently the analysis of consumer demand, by suggestingthat consumershave demand for attributes of a specific good rather than the good itself. Ladd and Zober (1977) and Hauser and Simmie (1981) have extended the Lancasterian model from characteristics space to consequence maps, thus providing a useful framework for thinking about consumer demand. In this paper, we
Marketing Management Journal, Spring/Summer 2000 f
Consumer Rationality and Economic Efficiency:
. .. ..
Balakrishnan,
Nataraajan and Desai
adopt a perspective quite similar to that advanced by being introduced or current products undergoing Fomell, Robinson and Wemerfelt (1985) wherein modifications, and so forth, customers may evoke they liken consumer consumption of products to a brands which do not lie on the efficient frontier. production process. This framework views the product purchased by the consumer as an input which From the supply side, consistent with the above gets converted to an output by means of this observation, Huber, Payne and Puto (1982) have consumption process. We advance this input-output stated that under certain conditions it may be orientation one step before the consumption of the actually to the benefit of the firm to introduce an product to the actual purchase of a product. inefficient brand (i.e., decoy). They argue that due Therefore, the product purchase itself, together with to the salience of an inefficient variant on consumer the consumption, can now be viewed as a process choice strategies, the decoy may actually prove involving both inputs and outputs. For example, the beneficial by boosting the sales of its more efficient price of a brand or a product could be an input. counterpart. So, even if standard economic theory Another input could be the time spent in searching calls for the elimination of inefficient products, for a specific brand. Only after the consumer has sophisticated marketing strategy might actually call expended these inputs into the purchase-consumption for their preservation. Therefore, a consumer will process can he/she enjoy the associated outputs or the quite likely encounter less than efficient brands in benefits obtained from the brand. the marketplace. The associated outputs or the product benefits can range from such easily quantifiable aspects as "horse power" and "miles per gallon" to intangibles as "gentle on hands" and "sparkling dishes". The outputs can be considered the dimensions usually used to represent products in traditional multidimensional maps. In such a framework involving inputs and outputs, the concept of efficiency or inefficiency of products is a natural consequence. An efficient brand then is one which is not dominated by another brand on all characteristics or dimensions on which the product category is evaluated by the consumer. This definition, of course, implies that an asymmetrically dominated brand (Huber, Payne and Puto 1982), for instance, is an example of an inefficient brand.
From the demand side perspective, however, a rational consumer would always like to ensure that he/she is making the "best" possible buy. After all, consumer rationality implies the notion of economic efficiency. In other words, of all the available or evoked brands, he/she will choose that which provides the highest utility per dollar (Hauser and Gaskin 1984). Needless to say, in order to be able to select the economically efficient brand, the rational consumer needs to be aware of the different product offerings (decoys and all) in the marketplace, their performance characteristics on salient attributes as well as their related expenses which may include, among others, the amount of effort required to adapt and assimilate the product to his/her individual needs. As stated earlier, this basic assumption of consumer rationality in the sense of choosing the most economically efficient brand no doubt underlies most consumer models. In this paper, we empirically investigate the validity of this cardinal assumption.
A typical assumption of most economic and strategic models is that all products in the market place are portrayed as efficient. However, the study by Hjorth-Anderson (1984) indicates that at least at the micro level there do exist inefficient variants of a commodity. That is to say, it does not seem reasonable to assume that all of the products evoked by an individual consumer would lie on the efficient frontier. While standard economic theory would dictate that all inefficient brands will be driven out of the market place, this may not happen in the short fUll. So at least in markets which are in a state of flux, perhaps due to factors such as new products
Data Envelopment Analysis (DEA) has become popular since 1978 and interest in its potential for applicability does not seem to have abated. This is evidenced by the spate of articles on DEA that have appeared in a variety of outlets even recently (e.g., Seiford and Zhu 1998; Soteriou and Zenios 1999).
Marketing Management Journal, Spring/Summer 2000
2
DATA ENVELOPMENT ANALYSIS
--
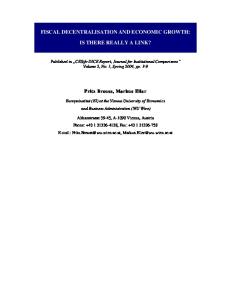
Consumer Rationality and Economic Efficiency: For the context of this research, DEA has been proposed as a technique for implementing the Lancaster model (Chames et al. 1985). However, most applications of DEA have been in contexts where the notion of a production technology is immediately applicable and the unit of analysis, or the Decision Making Unit (DMU), is generally a firm or some stylized form of production process (Seiford 1990). The analogous DMU in the marketing context would be an aggregation of attributes in the form of a brand or product. Such analyses which use a brand or a product as a DMU are useful in identifying superior products and economically efficient brands. We present here a simple graphical introduction to DEA. For a more formal mathematical treatment, we refer the reader to Banker et al. (1989). Consider an individual comparing a number of cars on the basis of two criteria, engine condition and exterior condition. Further suppose that these criteria are measured on a five point scale at half point intervals. Then the resulting data for these cars can be represented by the scatter plot in Figure 1. The vehicles rated the best are those which are farthest away from the origin. This set of undominated cars form what is termed to be the efficient frontier and all the cars on this frontier are given efficiency scores of unity. Cars which fall between the frontier and the origin are deemed inefficient and their efficiency rating is measured in terms of their distance from the efficient frontier. Hence, car models A,B,C and D are deemed efficient with an efficiency rating of 1.0. The efficiency of the cars not on the frontier are measured in distances along the ray from the origin through the point representing the car. For instance, the efficiency of the car at E is the ratio OE/OE'. Note that this ratio is always less than or equal to one. Extensions to multiple attribute maps follow naturally. One can also develop "per dollar" maps by taking the attribute rating and dividing that by the price the car to obtain a per dollar rating on a given attribute. The per dollar map and the resulting frontier is analogous to the production function from economic theory where the input resource is measured in terms of dollars and the outputs are the attributes of the car. Thus, Figure 1 would represent data shown in the output space. Efficiency scores for multiple attributes and multiple input resources (for
3
.. .. .
Balakrishnan,
Nataraajan and Desai
Figure 1 Hypothetical Data on Car Attributes 5 4 c 0
~c 3 0 ()
.
CD
.52 C) c W
1 0 1
2
3
4
5
Exterior Condition
instance, search effort, cost of other information), can be readily obtained by repeatedly solving, for each car, a mathematical program.
In order to present the linear programming model underlying the measurement of efficiency, we first introduce some notation. Let Yijdenote the benefit accruing along the ilbdimension (attribute) of the jib brand. Let xkj denote the input required to be expended along the klbdimension of the jibbrand in order to obtain the associated benefits. Assuming that there are M brands with N outputs and K input attributes which characterize the product evaluation process, we denote by Y the matrix of output attributes, of order N by M. Similarly, we let X be the matrix of input attributes, of order K by M. Assume that in attribute-space, these configurations can be represented by combinations of these x and y vectors, then the set of all feasible configurations, such that a proportionality is maintained between x and y is C={(x,y):y~Y.z,
X.z ~ x, ZER.M}
(1)
where, z = (Zl ,~ "",ZM) denotes the vector of parameters which determine the combination of the attributes of the brands. Let (XO,l) be a given observation of attributes of some brand. Then the relative efficiency (RE) of that brand is:
Marketing Management Journal, Spring/Summer 2000 r-
Consumer Rationality and Economic Efficiency: RE(xO ,l) = max{1I8: (XO,8yO) E C}
. ... .
(2)
which is the optimal solution of the following linear program: max
Balakrishnan,
Nataraajan and Desai
require the assumption that all alternative brands in the market place are efficient. This therefore enables us to determine the fraction of individual consumerswho make economically efficient choices from a given set of alternatives.
8
subject to: zY ~ 8yO zX ~ XO z~O
Thus, in this instance, the relative efficiency measure, 118,denotes the proportional expansion in the output attributes that can be achieved while maintaining the current level of inputs (costs). While a variety of modifications and variations of this basic efficiency measure are possible, we restrict ourselves to this simple measure to determine how it fares in investigating individual choice. It is vital to mention that our point of departure from the standard Lancasterian approach is that the mapping of products is not done in the characteristics space. Instead the products are mapped, as in Hauser and Gaskin (1984) and Hauser and Simmie (1981), in the perceptual space. The reasons are that consumers rarely have the objective information on the various characteristics of products and in many instances, such objective performance measures are hard to quantify. Instead, in keeping with the current marketing focus, we measure the consumers' utility in terms of the satisfaction accruing to them for the various attribute levels. This is more consistent and in line with the marketing concept of maximizing customer satisfaction. This approach also has the added desirability of allowing for heterogeneity in consumer perceptions. That is, different levels of an attribute would provide differing perceived levels of satisfaction to different customers. Consequently, employing the above linear program, we are now able to scale the product space in terms of utility of satisfaction with the various characteristics on a per input basis. Unlike traditional approaches (Hauser and Shugan 1983), however, we estimate a satisfaction per dollar map at the individual level as we do not assume homogeneity in perceptions. Nor does this approach
Marketing Management Journal, Spring/Summer 2000
STUDY 1: EFFICIENCY OF CONSUMER CHOICE IN SOCIAL PSYCHOLOGY To our best knowledge, no one has yet investigated the choice predictions of social psychology based formulations in terms of the efficiency of individual consumer choice. In this section, we report the results of an empirical investigation in the context of efficiency of individual consumer choice employing a widely used attitude formulation, the theory of reasoned action (Ajzen and Fishbein 1980). The theory of reasoned action (TRA) is possibly the most well known among the attitude formulations in social psychology, and hence it was chosen as the predictive model in this study. It has been well documented many times in the literature, and one may refer to the work of Ajzen and Fishbein (1980) for a comprehensive review of TRA. A brief description of TRA is provided here. The Theory of Reasoned Action TRA views intention as the immediate antecedent of behavior. Intention is determined by an attitudinal (personal) component and a normative (social) component. The model can be symbolically stated as B - BI = w(.(AB)+ wz.(SN) where, B is overt behavior, BI is behavioral intention (subjective probability of intending to perform behavior B), AB is attitude toward performing behavior B (e.g., attitude toward buying a brand), SN is subjective norm (normative influence; the collective perceived influence of "important others"), and WIand Wzare empirically determined weights denoting the relative influence of the two components. ABis determined as Lbiej(i=1...n) where, bi is the subjective probability that performing the behavior will result in outcome I, ei is the individual's evaluation of outcome I, andn is the
4
Consumer Rationality and Economic Efficiency: number of salient outcomes.
SN is determined as
LNBjMCj G=L.N) where, NBj is the belief that referent j thinks the individual should/should not perform the behavior, MCj is the individual's motivation to comply with referent j, and N is the number of salient referents.
It is pointed out that the extent of agreement between BI and B depends upon the degree of measurement correspondence on the elements of action (refers to the behavior of interest), target (the object/issue/person figuring in the behavior of interest), context (the context in which the behavior of interest is enacted), and time (i.e., the time at which the behavior of interest occurs). The hypothesis underlying the application of TRA to a consumer choice situation is that a consumer has a certain level of BI (the predictor of behavior) for each of the available alternatives, and would end up selecting that alternative for which he/she has the highest level ofB!. TRA is a person based, compensatory and compositional technique, and relies on direct input from the consumer. Further, it has a normative (influence of important others) construct through the subjective norm construct. Although it assumes human rationality to prevail in decision making, constraints are not endogenous to the model. However, it implicitly assumes that the individual takes contextual constraints into consideration while responding to measurement items. For more details on these characteristics, see Nataraajan and Warshaw (1991). The Study In this study, we investigate the economic rationality underlying the predictions of TRA. After all, TRA assumes rationality in behavior; the qualification "reasoned" substantiates this. It appears to us that if in fact TRA is based on rationality, it should then at least imply the notion of economic efficiency. Following from this, is the primary question, "Does TRA predict choices that are economically efficient"? Specific questions of interest are:
5
... ..
Balakrishnan,
Nataraajan and Desai
1. What is the proportion of economically efficient (the homo economicus group) consumers among those whose first choices are correctly predicted by TRA ?
2. What is the proportion of economically inefficient consumers among those whose first choices are correctly predicted by TRA? 3. What is the proportion of economically efficient consumers(the homo economicus group) among those whose first choices are not correctly predicted by TRA? 4. What is the proportion of economically inefficient consumers among those whose first choices are not correctly predicted by TRA? For the sake of completeness, the average number of efficient options available for the homo economicus and for the other group (comprising those that make inefficient choices) would also have to be determined to see if there was any unreasonable disparity.
Method The predictive ability of TRA was tested in a hypothetical setting involving forced choice among a set of ten real apartments in a southern university town. Exhibit 1 depicts the attributes and levels on which these ten apartments differed from each other. Undergraduatebusiness students enrolled in several marketing courses at a large southeastern university were recruited as subjects for the study. Although participation was voluntary, the subjects received points as part of their grade for "class participation." In fairness to the non-participants, those who did not wish to be subjects were given another assignment for the same number of points as part of their "class participation." In all, 117 subjects comprised the test sample. The Prediction Phase
Subjects were provided with profile descriptions of the ten apartments along with a questionnaire. A cover letter informed the subjects that they were to assume that they needed an apartment for their own
Marketing Management Journal, Spring/Summer 2000 ,.#
-
Consumer Rationality and Economic Efficiency:
.....
Balakrishnan,
Nataraajan and Desai
Exhibit I Apartment Attributes and Levels in Study I A. Monthly Rent 1. $150 2. $250 3. $350 4. $450 5. $550 6. $650
B. Distance from Campus 1. Less than one mile 2. Between 1 and 2 miles 3. Between 2 and 3 miles 4. Between 3 and 4 miles
C. Size 1. One room plus kitchen 2. Two bedrooms plus kitchen 3. Two bedrooms, living room plus kitchen 4. Three bedrooms, living room plus kitchen
D. Renovation 1. Throughout 2. Only kitchen and bathroom 3. Only bathroom 4. None
E. Recreational Facilities 1. Tennis courts, sauna, club house & pool 2. Tennis courts, sauna & pool 3. Tennis courts & pool 4. Only pool 5. None
F.
Washer & Dryer 1. No washer & dryer 2. On-location (not free) 3. On-location (free) 4. In-house
Used Car Attributes and Levels in Stud.YlI A. Year of Make 1. 1986 2. 1987 3. 1988 4. 1989
B. Price 1. $7,000-$7,999 2. $8,000-$8,999 3. $9,000-$9,999 4. $10,000-$10,999 5. $11,000-$11,999 6. $12,000-$12,999 7. $15,000-$15,999
C. Odometer Mileage 1. Less than 30,000 miles 2. More than 30,000 but less than 50,000 miles 3. More than 50,000 but less than 80,000 miles
D. Exterior Condition 1. Slight rust and few dents 2. Slight rust, but no dents 3. Virtually no rust or dents
E. Interior Condition 1. A few stains and tears 2. A few stains but no tears 3. Virtually no stains or tears
use, and were to choose to rent one of the ten apartments. It also stated that while the apartments were all livable, unfurnished, located in generally clean complexes and allowed pets, they all varied on other important attributes as shown in Exhibit 1. The questionnaire consisted of two parts, one part for TRA items and the other for DEA items. To avoid
For TRA, the items were ABy (attitude toward behavior -- purchasing a particular apartment -- for
Marketing Management Journal, Spring/Summer 2000
6
order effects/position bias, there were two versions of this questionnaire. In one version, the TRA part appeared first, and in the other version the DEA part appeared first.
-
Consumer Rationality and Economic Efficiency: each subject and for each apartment; y=apartment) and SNy(subjective norm -- influencing the purchase of a particular apartment -- for each subject and for each apartment). These were patterned after the standard formats furnished by Ajzen and Fishbein (1980) and measured directly. Since prediction and not explanation was the main interest, the belief and evaluation stage of TRA (the Ebjej and ENBjMCj terms) was deemed quite unnecessary, and measurement took place only in the subsequent stages. This is in line with what Ajzen and Fishbein (1980) have suggested, and others (e.g., Warshaw 1980) have followed. ABywas computed as a summated score of four semantic differential scales (coded from +3 to -3 or reversed depending on the polarity) with the following bipolar adjectives: 1. Pleasurable-Painful 2. Wise-Foolish 3. Unpleasant- Pleasant 4. Punishing-Rewarding. Similarly, SNywas measured using a scale ranging from extremely likely to extremely unlikely (coded from +3 to -3). For efficiency, evaluations through DEA, satisfaction scores were obtained. The subjects were asked to indicate their satisfaction on a nine point scale ranging from unsatisfactory to satisfactory with each of the levels of the various attributes as shown in Exhibit 1. The Actual Choice Phase
After the subjects had completed the above questionnaire, they were given another questionnaire that required them to rate each of the ten apartments on a 0 to 100 likelihood of renting scale and also indicate their most preferred apartment if they had to pick one. Analysis The satisfaction data enabled the computation of efficiency scores for the subjects. The efficiency scores for each of the ten apartments used in the holdout were estimated at the individual level. For this, the satisfaction with the different levels of apartment characteristics was scaled per dollar rent (input) of an apartment to obtain the efficiency scores. Then, for each individual, we examined
7
.....
Balakrishnan,
--
Nataraajan and Desai
whether his/her choice was from the set of apartments on his/her computed Pareto-frontier. This led to the determination of the fraction of subjects who chose from those apartments estimated to be on their efficiency frontiers. Next, first choice hit rates for TRA were determined. For this, the dependent variable, BIy, was computed as B~ = Wly.Aay+ w2y.SNy,where W1y and W2ywere the apartment specific beta weights. As suggested by Ajzen and Fishbein (1980), these weights were estimated from a separate and smaller sample of subjects. Thus, for each subject, 10 BIy scores were computed. In each case, the apartment with the highest score was deemed the first choice of a subject as predicted by TRA. The predicted first choices were compared to the actual first choices, and hit rates were computed. Whether or not TRA predictions were independent of economic efficiency was tested using the Chi square test. The significance of the difference in the hit rates for the homo economicus group and the group that made relatively inefficient choices was conducted using a Z test for proportions.
Results Table la gives the break down on efficiency and hit rates. A significant Chi square (5.56, Idf, p