Patrycja Zwiech Department of Microeconomics University of Szczecin 64, Mickiewicza Street, 71-101 Szczecin, Poland Phone +4891/4442080, fax +4891/4442137 E-mail:
[email protected], http://mikro.univ.szczecin.pl/zwiech
COMPETITIVENESS OF WOMEN ON POLISH LABOUR MARKET Abstract Women on labour market are considered to be less competitive than men. This paragraph will focus on not perceived but actual competitiveness of women on labour market in Poland. Competitiveness of employees on labour market is strictly related to their social and demographic features, especially the level of education and flexibility. Flexibility, on the other hand, strongly depends on the load of family and household responsibilities. The aim of this article is to present the level of professional activity of women in context of education and the load of family and household duties. Key words: competitiveness of women, labour market Introduction Women on labour market are considered to be less competitive than men. The reason of such consideration is the stereotype approach to the role of women in the society, according to which women are more saddled with parental and household duties than man. Such approach also suggests that women, on contrary to men, are less interested in “work” and more interested in “home”. This paragraph will focus on not perceived but actual competitiveness of women on labour market in Poland. Competitiveness of employees on labour market is strictly related to their social and demographic features, especially the level of education and flexibility. Flexibility, on the other hand, strongly depends on the load of family and household responsibilities. It is mainly woman who has to compromise household and professional duties. Women are more saddled with household responsibilities, what may have negative influence on playing specific professional parts and also worsen the situation of women on the labour market. This problem mostly affects women with relatively high level of education, for whom work is not only the possibility to earn and provide for family, but also is a chance for selfrealization. [Balcerzak - Paradowska B., 2003, s. 136]. The necessity of choosing between professional and domestic work is the reason for restrictions of women’s flexibility in the place of work. That is what makes the employment of women and its continuation more difficult than men. It also results in worse working conditions, especially financial. This fact is substantiated by numerous studies presenting the inferior position of women on the labour market1. 1
Ref.: Raport Komisji Unii Europejskiej: Ocena stanu przygotowań Polski do akcesji z UE, 2004; Raport Komisji Unii Europejskiej: Ocena stanu przygotowań Polski do akcesji z UE, 2003; Raport Open Society Institute (OSI): Raport o sytuacji kobiet w nowych państwach UE oraz krajach kandydujących, 2005; Raport Banku Światowego nr 29205: Płeć a możliwości ekonomiczne w Polsce: czy kobiety straciły na transformacji?,
69
Competitiveness of Women on Polish Labour Market
The differences in professional activities between women and men in Poland. In Poland women are less professionally active than men. Table 1. shows professionally active and inactive population and the share of women among professionally active. Table 1. Population aged 15 years and more professionally active and inactive in thousands and the share of women among the professionally active. Particulars 1997 1998 1999 2000 2001 2002 2003 2004 2005 ECONOMICALLY ACTIVE POPULATION 17052 17161 17214 17300 17229 17097 16991 17139 17161 Men 9264 9283 9307 9397 9340 9283 9215 9323 9403 Women 7788 7878 7907 7903 7889 7814 7776 7816 7880 PERSONS ECONOMICALLY INACTIVE 12675 12900 13174 13371 13664 14012 14016 14057 14097 Men 4878 5023 5171 5222 5381 5544 5558 5547 5536 Women 7797 7877 8003 8149 8283 8468 8458 8510 8515 share of women among professionally active in %
45,60 45,92 45,67 45,91 45,93 45,68 45,79 45,67 45,77
Remarks: Data cc. 1997 – 1998, November; 1999-2005 4th quarter Source: own compilation based on: GUS 1999, 2001, 2002a, 2002b, 2003a, 2004a, 2005a, 2006a. As it can be seen in the table above in the period from 1997 to 2005 women in Poland were less professionally active than men. However, there were more women aged 15 or more than men of the same age (in 1997 – 1443 thousands more and in 2005 – 1456 thousands more) there was a majority of professionally active men (in 1997 – 1476 thousands more and in 2005 – 1523 thousands more). The share of professionally active women in the period of concern was established at the level of 45% - 46%. So, the men formed the majority on the labour market. The fact the women were minority among professionally active was also substantiated by lower both professional activity and employment rates for women than for men. In the years of 1997-2005 the professional activity rate was below 50% for women and above 60% for men. In the period of concern activity rate decreased from 50% to 48,1% for women and form 65,5% to 62,9% for men. Similarly, though in greater degree, the employment rate was Biuro Banku Światowego w Polsce, Warszawa 2004; Raport Karat: Wpływ przystąpienia do Unii Europejskiej na sytuację kobiet na rynku pracy w krajach Europy Środkowej i Wschodniej. Analiza sytuacji w Polsce, red. K. Lohrman, A. Seibert, Warszawa 2003; Raport Państwowej Inspekcji Pracy: Równe traktowanie kobiet i mężczyzn w stosunkach pracy. Mobbing w środowisku pracy, Warszawa 2005; Raport Światowego Forum Gospodarczego: Ranking równouprawnienia płci, 2005; Raport Eurostatu: How Europeans spend their time – everyday life of women and men (Data 1998 – 2002) z dnia 27.07.2004, Informacja rządu o sytuacji kobiet w Polsce z 05.03.2004 r.
70
Patrycja Zwiech
decreased: from 44% to 39,2% for women and from 59,8% to 53,2% for men. The above can be seen in the table 2 Table 2. Economical activity rate and employment rate of population of 15 and more years old, between 1997 and 2005 Particulars Activity rate (%) Men Women Men in the working age Women in the working age Employment rate (%) Men Women Men in the working age Women in the working age
1997
1998
1999
2000
2001
2002
2003
2004
2005
57,4 65,5 50,0
57,1 64,9 50,0
56,6 64,3 49,7
56,4 64,3 49,2
55,8 63,4 48,8
55,0 62,6 48,0
54,8 62,4 47,9
54,9 62,7 47,9
55,2 62,9 48,1
77,9
77,6
77,0
76,9
76,0
75,1
74,9
74,9
75,3
67,5
67,7
68,0
67,2
62,6
65,0
64,9
65,0
65,4
51,5 59,8 44,0
51,0 58,9 43,9
48,0 55,9 40,7
47,4 55,2 40,3
45,5 52,5 39,0
44,1 50,7 38,1
44,2 50,9 38,2
45,1 52,2 38,5
45,9 53,2 39,2
Bd
Bd
66,9
65,8
66,6
60,5
60,8
62,1
63,5
Bd
Bd
55,4
54,7
53,0
51,4
51,3
51,9
53,1
Remarks: Data cc. 1997 – 1998, November; 1999-2005 4th quarter Source: own compilation based on: GUS 1999, 2001, 2002a, 2002b, 2003a, 2004a, 2005a, 2006a. The above data reveals that the professional activity level of women is much lower than men. It can be explained by the greater number of professionally inactive women than men. In addition to that, the reason for diversity between women’s and men’s situation concerning professional activity lays in the field with no reference to economics, in unequal distribution of family and household duties [A. Karwińska, 2003 – 2004, pp. 133–147]. The symptoms of women discrimination in the sphere of economy can be noticed while studying the causes of professional inactivity. These causes are presented in table 3. Table 3. Persons economically inactive by reasons for inactivity in Poland in the period of 1997-2005 Particulars Persons economically inactive (thousands.) Men, including: discouragement caused by inefficiency of job
1997
1998
1999
2000
2001
2002
2003
12675 12899 13174 13371 13664 14012 14016 4878 5023 5171 5222 5381 5544 5558 120
168
136
147
153
174
129
2004
14057 5547
2005 14051 5536
71
Competitiveness of Women on Polish Labour Market
seeking 1611
1579
1644
1661
1697
1730
181
159
1766
1766
education traning family and hausehold responsibilities
1523 45
47
47
52
23
16
36
Retirement illness, disability Unwillingness to start working persons seeking job but not ready to take it on Women, including: discouragement caused by inefficiency of job seeking
1285 1557
1356 1525
1423 1543
1560 1434
1748 1405
1885 1333
1881 1336
1896 1326
1988 1259
235
224
350
204
135
145
150
Bd
Bd
78 7797
92 7877
93 8003
77 8149
72 8283
84 8468
49 8458
42 8415
44 8515
126
132
163
150
209
230
220
239
218
education traning family and hausehold responsibilities
1585
1364
1631
1723
1736
1810
1799
1827
1817
1403
1403
1262
1294
1208
1147
1141
1244
1207
Retirement illness, disability Unwillingness to start working persons seeking job but not ready to take it on
2402 1884
2455 1875
2641 1798
2897 1653
2601 1849
2754 1783
2874 1696
3036 1466
3236 1524
218
180
341
161
259
300
300
Bd
Bd
136
165
167
161
124
134
98
83
85
41
36
Remarks: Data cc. 1997 – 1998, November; 1999-2005 4th quarter Source: own compilation based on: GUS 1999, 2001, 2002a, 2002b, 2003a, 2004a, 2005a, 2006a. The table above shows that in the period of concern the situation did not change to a large extend. At the beginning of the considered period the difference between professionally inactive females and males was 2919 thousand, 38% of which was caused by greater number of women in retirement age (1117 thousand more females in retirement age than males), further 327 thousands – by illness or disability. However, the biggest difference emerged from unequal load of family and household duties and responsibilities – 1358 thousand more women than men were professionally inactive because of the family and custodial reasons. In the final period the difference between professionally inactive females and males was 2979 thousand, 41,9% of which was caused by greater number of women in retirement age (1248 thousand more females in retirement age than males), further 265 thousands – by illness or disability Similarly to 1997, the biggest difference emerged from unequal load of family and household duties and responsibilities – 1358 thousand more women than men
72
Patrycja Zwiech
were professionally inactive because of these reasons. Non economical reasons, such as the family and household responsibilities caused, that in the analysed period 1403 thousand to 1207 thousand of women, the most of whom were in the age bracket of 25 – 34 (for example: 431 thousand in 2005), did not take up any professional activities. Above reasons for not seeking job were barely discernible for men, since only 45 thousand to 36 thousand of them were professionally inactive because of these reasons. Household responsibilities load – time of house works for females and males in Poland The results of Polish National Statistics Office surveys from 1996 show that females in Poland spent the average of 5 hours 18 minutes a day for house works. Males, however spent only 2 hours 19 minutes (the surveys took into account both professionally active and inactive females and males). Therefore, women spared 3 hours a day more than men for house works [GUS 1998, pp.135-136]. The studies of the Women Rights Centre from the year 2000 show that professionally active Polish women spend 4 hours and 18 minutes for household works during weekdays. During holidays professionally active women spared 5,7 hours for household works. Unfortunately, these studies did not cover men [Chiniewska, 2000]. The research conducted by the author2 in 2004, among the persons employed in management, showed, that the household duties took up the average of 1 hour 30 minutes for male managers and 2 hours 15 minutes for female managers. Moreover, the research showed that persons employed in management spent relatively more time for professional work than the others. However, they spent less time for domestic works. The cause for that may be the outsourcing some of the domestic duties to specialised companies and housekeepers reasoning from the higher household income. The Eurostat3 figures, however show that approximately the same amount of time is spent on both non-profit and professional work. In other words, this research proves that the amounts of domestic work and professional work are more or less the same. The studies on time consumption also illustrate, that the commitment to both types of tasks is highly dependent on the gender of worker: women spend significantly more time on carrying out of their non-profit duties, particularly if there are small children in the family [Zwiech, 2006a]. In Poland, the daily average time spent on domestic work was 4 hours 45 minutes for females and 2 hours 22 minutes for males4[Eurostat, 2006]. It clearly emerges from the presented data, that women dedicate more time 2
Survey carried out by the Author on the group of 602 persons employed in management, including 304 males and 298 females from sub regions of Szczecin, Koszalin and Poznań in June and July 2004. 3 In March 2006 Eurostat presented results of research cc. time spend on household activities in chosen European countries. The research took place in 1998-2004 and covered persons of age 20-74, living in Belgium, Denmark, Germany, Estonia, Spain, France, Italy, Latvia, Lithuania, Hungary, the Netherlands, Poland, Slovenia, Finland, Sweden and the United Kingdom. 4 Among responded women the residents of Italy spent most of their time on household duties (05:20h), further of Estonia (05:02h), Hungary and Slovenia (04:58h) and Spain (04:55h), the least time is devoted to household duties by woman in Sweden (3:42h), Finland and Latvia (03:56h). Men spent most of their time on household activities in Estonia (02:48h), Hungary and Slovenia (02:40h). Men in Italy and Spain spent the least time on those works: respectively 01:35h and 01:37h. The biggest difference in time spent on household activities preformed by females and males can be noticed in Italy (03:45h) and in Spain (03:18h). In new member countries the average difference in time spent on household activities preformed by female and male equals 02:20h, in Poland – 02:23h, Lithuania – 02:20h, Italy an Slovenia – 02:18h. The least time is spent in Sweden (01:13h), Finland (01:40h), Germany (01:50h) and Belgium (01:54). The males spared less time on household activities than females, however the most devoted man spent less time on household works (in Estonia 2 hours and 48 minutes) than the less interested in household activities woman of Sweden (03:42)
73
Competitiveness of Women on Polish Labour Market
than men for domestic work. It results in greater fatigue, less flexibility and less abilities for commitment to professional work. This in turn, transfers to decreasing women’s position on the labour market. What is more, the above mentioned relations influence not only professional work, but also leisure time (including: helping other households, socialising and entertainment, sports and outdoor activities, hobbies and games, reading, watching TV, resting and doing nothing). The amount of the time off for women in Poland was 4 hours 36 minutes and for men 5 hours and 25 minutes. Doubtlessly, the bigger load of domestic responsibilities influences on minor professional activity of women. Education of professional active female and male in Poland Level of education is the feature that strongly expresses competitiveness at the labour market. Table 4 shows distribution of persons professionally active by the level of education and gender in Poland Table 4. People professionally active in age of 15 and more and the distribution of people by level of education and gender in Poland Particulars ECONOMICA LLY ACTIVE POPULATION (in thousands) Men (in thousands.) (in %) Tertiary (in thousands) In % Post-secondary In % Vocational secondary In % General secondary In % Basic vocational In % Lower secondary, primary and incomplete primary In %
1997
1998
1999
2000
2001
2002
2003
2004
2005
17052 17161 17214 17300 17229 17097 16991 17139 17283 9403 9264 9283 9307 9397 9340 9283 9215 9323 100 100 100 100 100 100 100 100 100 933 974 963 997 1097 1140 1281 1430 1475 10,1 10,5 10,3 10,6 11,7 12,3 13,9 15,3 15,7 128 157 165 149 162 187 2254 2344 2489 1,4 1,7 1,8 1,6 1,7 2,0 24,3
25,3
259 2,8
26,7
278 3
2336 2250 2302 2233 2272 2355 24,9 24,1 24,8 24,2 24,4 25,0
362 3,9
380 4
371 4
398 4,3
446 4,8
492 5,3
536 5,7
4039 4049 3985 4042 4050 3906 3883 3776 3724 43,6 43,6 42,8 43 43,4 42,1 42,1 40,5 39,6
1779 1637 1508 1515 1415 1372 1224 1191 1126 19,2 17,6 16,2 16,1 15,1 14,8 13,3 12,8 12,0
74 Women (in thousands) In % Tertiary (in thousands.) In % Post-secondary In % Vocational secondary In % General secondary In % Basic vocational In % Lower secondary, primary and incomplete primary In %
Patrycja Zwiech
7788 7878 7907 7903 7889 7814 7776 7816 7880 100 100 100 100 100 100 100 100 100 941 1078 1088 1160 1250 1396 1555 1672 1910 12,1 13,7 13,8 14,7 15,8 17,9 20 21,4 24,2 453 481 490 459 468 481 2590 2615 2744 5,7 6,1 6,3 5,9 6,0 6,1 33,3
33,2
34,7
2218 2106 2005 1957 1964 1975 28,1 26,7 25,7 25,2 25,1 25,1
824 796 909 878 864 892 914 908 900 10,6 10,1 11,5 11,1 11 11,4 11,8 11,6 11,4 1970 2009 1960 2007 2080 1972 1915 1896 1837 25,3 25,5 24,8 25,4 26,4 25,2 24,6 24,3 23,3
1464 1383 1206 1187 1107 1058 976 908 777 18,8 17,6 15,3 15 14 13,5 12,6 11,6 9,9
Remarks: Data cc. 1997 – 1998, November; 1999-2005 4th quarter Source: own compilation based on GUS 1997, 1998b, 2001, 2002a, 2002b, 2003a, 2004a, 2005a, 2006a. As expressed in the table above professionally active female were better educated than professionally active male in whole surveyed period. In 1997 – 2005 the share of professionally active women having higher education increased from 12,1% to 24,2%, and the share of women having secondary education insignificantly dropped from 43,9% to 42,6%. In the same time the share of men with higher education rose from 10,1% to 15,7% and the share of men with post-secondary education rose from 27,1% to 32,7%. It means that in whole concerned period the female with at least post-secondary education covered 56% up to 66,8% of professionally active women, and male – from 37,2% to 48,4% of professionally active men. The chart 1 illustrates the distribution of professionally active female and male in 1997 and 2005 Taking the level of education into account, in 1997-2005 persons with general secondary education formed the most “feminized” professionally active group. However the majority of men formed the group of vocational secondary education. The chart 2. illustrates the degree of feminization of several levels of education among professionally active
75
Competitiveness of Women on Polish Labour Market
Chart 1. Distribution of professionally active by education and gender in Poland in November 1997 and 4th quarter of 2005 Women 2005
Women 1997
Men2005
Men 1997
0%
24,2
42,6
12,1
23,3
43,9
15,7
25,3
32,7
10,1
20%
18,8
39,6
27,1
10%
12,0
43,6
30%
9,9
40%
50%
19,2
60%
70%
80%
90%
100%
% Tertiary
Post secondary, vocational and general secondary
Basic vocational
Low er secondary, primary and incomplete primary
Source: own compilation based on: GUS 1999, 2006a. Chart 2. Share of professionally active female in several levels of education in Poland in November 1997 and 4th quarter of 2005
Lower secondary, primary and incomplete primary
40,8 45,1 33 32,8
Basic vocational
62,7
General secondary
76,1
Post secondary and vocational secondary
49,1 53,5 56,4
Tertiary
50,2 0
10
20
30
40
50
60
70
80
% Women 1997
Women 2005
Source: own compilation based on: GUS 1999, 2006a. Above presented data reveals that in the concerned period the proportion of
76
Patrycja Zwiech
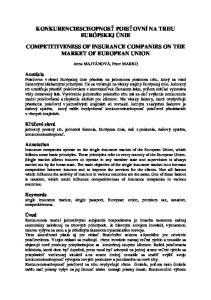
professionally active women in those having general, vocational and post secondary education decreased. On contrary it increased within the group of professionally active having higher education. It is presumed that such regularity will be held in next years, because the analysis shows that women are majority among students. For example in academic year 2005/2006 in the total of 1 953 832 students there were 1 103 890 women, which is 56,6%. The proportion of female attending daily studies was 55,3%, the part time studies 57,2%, the evening studies 60,2% and the extramural studies 67,9%. There were in total 135 930 student on postgraduate studies, including 92 943 women (68,4%). In 2005/2006 the total of 32 725 persons attended the doctorates studies, including 16 131 women (49,3%) [GUS 2006b] The level of education and professional activity of female and male The level of education influences the level of professional activity. In general it might be stated that the higher level of education, the higher professional activity rate, what is presented in chart 3. Chart 3. The professional activity rates of persons aged 15 and more by education and gender in November 1997 and 4th quarter of 2005.
24,1 39,1
Lower secondary, primary and incomplete primary
64,3
51,0 46,4
Post secondary and vocational secondary
79,9 82,9
57,4 74,9 43,4 52,3
General secondary
General secondary
70,8 77,6
16,1 30,6
Basic vocational
Basic vocational
80,7
61,5 73,3
Vocational secondary
Post secondary
68,8 79,9
Tertiary
79,9 81
Tertiary
50,0
Average
65,5 100
Lower secondary, primary and incomplete primary
80
60
40
20
0
Activity Rate
Men
48,1 62,9
Average
0
Women
1997
20 40 60 80 100
Rate Men Activity Women
2005
Source: own compilation based on: GUS 1997, 2006a. Women with higher education are characterized by higher professional activity rate
Competitiveness of Women on Polish Labour Market
77
(about 80%) in comparison to the women with lower levels of education. The presented rate of professional activity was registered among women with lower secondary, primary and incomplete primary education. The professional activity rates beneath the average was also registered for women with general secondary education. Conclusion Professionally active females are better educated than males. In the period of concern the ratio of women with at least secondary education was 56% to 66,8% of all professionally active women, and men – 37,2% to 48,4% of all professionally active men. Women however, are more saddled with household duties. They spend more time for domestic works than men. It automatically transfers to minor professional activity of women. It results in greater fatigue, less flexibility and less abilities for commitment to professional work. This in turn, transfers to decreasing women position on the labour market. What is more, above mentioned relations influence not only professional work, but also leisure time In addition, it should be noticed, that despite their minor average professional activity, women with higher education level are characterised by high professional activity rates (approximately 80%).So it can be stated, that the higher level of education the higher professional activity and employment rates. Therefore, the level of education should be increased for both women and men. REFERENCES: a) Books: 1. Balcerzak - Paradowska B., (ed., 2003.), Praca kobiet w sektorze prywatnym. Szanse i bariery, IPISS, Warszawa. 2. Chiniewska K., (2000), Czas pracy kobiet. Sprawozdanie z badania ankietowego – June 2000 r., Women Rights Center, Warszawa. 3. Domański H., (1992), Zadowolony niewolnik? Studium o nierównościach między mężczyznami i kobietami w Polsce, IFIS PAN, Warszawa. 4. Karwińska A., (2003-2004), Sprawiedliwa nierówność? Sytuacja kobiet w społeczeństwie i gospodarce w Polsce w początkach XXI wieku, in: Nierówności społeczne a wzrost gospodarczy, ed. M. Woźniak, Rzeszów, s. 133–147. 5. Kryńska E. (ed., 2000), Mobilność zasobów pracy. Analiza i metody stymulacji, Studia i Monografie IPISS, Warszawa. 6. Kryńska E., (2001), Dylematy polskiego rynku pracy, IPISS, Warszawa. 7. Zwiech P., (2006a), Czas pracy kobiet i mężczyzn – czy kobiety krócej pracują niż mężczyźni, in: Wybory podmiotów decyzyjnych w gospodarce polskiej, ed. D. Kopycińska, Zeszyty Naukowe Uniwersytetu Szczecińskiego nr 408, Szczecin. 8. Zwiech P., (2006b), Aktywność ekonomiczna kobiet i mężczyzn w Polsce na tle krajów Unii Europejskiej, in: Regulacyjna rola państwa we współczesnej gospodarce, ed. D. Kopycińska, Katedra Mikroekonomii Uniwersytetu Szczecińskiego, Szczecin. 9. Zwiech P., Korpysa J., (2006c), Time spend on housework as a determinant of women’s economic activity in the Member States, in: Determinants of attitudes and behaviour of the decision-making entities, ed. D.Kopycińska, Katedra Mikroekonomii Uniwersytetu Szczecińskiego, Szczecin. 10. Zwiech P., (2006d), Dochodowe nierówności płci w Polsce – relacje wynagrodzeń w ujęciu grup zawodowych, in: Nierówności społeczne a wzrost gospodarczy, ed. M. Woźniak, Rzeszów. 11. Zwiech P., (2006e), Dyskryminacja kobiet w dostępie do szkoleń – wyniki badań
78
Patrycja Zwiech
ankietowych, in: Wybrane problemy gospodarki opartej na wiedzy, ed. Katarzyna Włodarczyk – Śpiewak, Katedra Mikroekonomii Uniwersytetu Szczecińskiego, Szczecin. 12. Zwiech P., (2006f), Cele i wartości menedżerek i menedżerów w świetle badań ankietowych, in: Kapitał ludzki jako czynnik rozwoju społeczno – gospodarczego, ed. D. Kopycińska, Katedra Mikroekonomii Uniwersytetu Szczecińskiego, Szczecin. b) Sources: 1. Eurostat 2004, How Europeans spend their time – everyday life of women and men (Data 1998 – 2002), 27.07.2004. 2. Eurostat 2006, Statistics in focus - Population and Social Conditions no 4/2006. 3. GUS 1997, Rocznik Statystyczny Pracy 1997, Warszawa 4. GUS 1998, Budżet czasu ludności 1996, Warszawa. 5. GUS 1999, Rocznik Statystyczny Pracy 1999, Warszawa. 6. GUS 2000a, Aktywność ekonomiczna ludności Polski IV kwartał 1999, Warszawa. 7. GUS 2000b, Rocznik Statystyczny Rzeczpospolitej Polskiej 2000, Warszawa. 8. GUS 2000c, Rocznik Statystyczny Pracy 2000, Warszawa. 9. GUS 2001, Aktywność ekonomiczna ludności Polski IV kwartał 2000, Warszawa. 10. GUS 2002a, Aktywność ekonomiczna ludności Polski IV kwartał 2001, Warszawa. 11. GUS 2002b, Aktywność ekonomiczna ludności Polski w latach 1992 - 2001, Warszawa. 12. GUS 2003a, Aktywność ekonomiczna ludności Polski IV kwartał 2002, Warszawa. 13. GUS 2003b, Rocznik Statystyczny Rzeczpospolitej Polskiej 2003, Warszawa. 14. GUS 2003c, Rocznik Statystyczny Pracy 2003, Warszawa. 15. GUS 2004a, Aktywność ekonomiczna ludności Polski IV kwartał 2003, Warszawa. 16. GUS 2004b, Kobiety i mężczyźni na rynku pracy, Warszawa. 17. GUS 2005a, Aktywność ekonomiczna ludności Polski IV kwartał 2004, Warszawa. 18. GUS 2005b, Rocznik Statystyczny Rzeczpospolitej Polskiej 2004, Warszawa. 19. GUS 2006a, Aktywność ekonomiczna ludności Polski IV kwartał 2005, Warszawa. 20. GUS 2006b, Rocznik Statystyczny Rzeczpospolitej Polskiej 2006, Warszawa.