WP/05/17
Competition and Efficiency in Banking: Behavioral Evidence from Ghana Thierry Buchs and Johan Mathisen
© 2005 International Monetary Fund
WP/05/17
IMF Working Paper African Department Competition and Efficiency in Banking: Behavioral Evidence from Ghana Prepared by Thierry Buchs and Johan Mathisen1 Authorized for distribution by Samuel Itam January 2005 Abstract This Working Paper should not be reported as representing the views of the IMF. The views expressed in this Working Paper are those of the author(s) and do not necessarily represent those of the IMF or IMF policy. Working Papers describe research in progress by the author(s) and are published to elicit comments and to further debate.
This paper assesses the degree of bank competition and discusses efficiency with regard to banks’ financial intermediation in Ghana. By applying panel data to variables derived from a theoretical model, we find evidence for a noncompetitive market structure in the Ghanaian banking system, which may be hampering financial intermediation. We argue that the structure, as well as the other market characteristics, constitutes an indirect barrier to entry thereby shielding the large profits in the Ghanaian banking system. JEL Classification Numbers: G21, D43 Keywords: Ghana, banking competition Author(s) E-Mail Address:
[email protected];
[email protected]
1
We would like thank Bank of Ghana staff, Hugh Bredenkamp, Jack Glen, participants at the Ghana at the Half Century conference in July 2004, Luca Ricci and Tom Walter for helpful comments and suggestions. At the time this paper was prepared, Johan Mathisen was an economist in the IMF’s African Department and Thierry Buchs was a Senior Economist at the International Finance Corporation (IFC). Any remaining errors and omissions are our own.
-2-
Contents
Page
I. Introduction ........................................................................................................................... 3 II. Overview of the Ghanaian Banking System ........................................................................ 4 A. Structure of Ghana’s Banking Sector............................................................................... 4 B. Financial Performance of the Banking Sector.................................................................. 6 C. Possible Factors Explaining Bank Profitability and the Efficiency of Intermediation .. 10 III. Analytical Framework and Econometric Estimation........................................................ 12 A. The Panzar and Rosse Analytical Framework ............................................................... 13 B. Description of the Data and Definitions of Variables .................................................... 16 C. Estimation Results.......................................................................................................... 17 D. Interpretation of the Coefficients ................................................................................... 19 IV. Conclusions....................................................................................................................... 21 References............................................................................................................................... 23 Appendix................................................................................................................................. 25 Figures 1. Nominal Interest Rates, Government Debt, Real Growth of Private Sector Credit, Private Sector Credit, 1998-2003 ...................................................................................... 5 2. Investment and (Gross) Lending of the Banking Sector (1996-2003).................................. 6 3. Savings, Investment and Loans Ratios Across Sub-Saharan Africa................................... 12 Tables 1. Structure of the Banking Sector............................................................................................ 4 2. International Comparison of Selected Banking and Institutional Indicators ........................ 8 3. Financial Soundness Indicators for the Banking Sector, 1997–2003 ................................... 9 4. Profitability Indicators ........................................................................................................ 10 5. Panzar and Rosse’s H-Statistics.......................................................................................... 14 6. H-Statistics Values for the Banking System in Ghana ...................................................... 17 7. Banking Sector Market Structure in Selected Countries .................................................... 17 8. Regression Results .............................................................................................................. 18 Appendix Table A1. Market Equilibrium Test Results...................................................................................... 26
-3I. INTRODUCTION Financial systems tend to evolve around a banking sector seeking to achieve economies of scale in order to offset the costs of collecting and processing information designed to reduce uncertainty, thereby facilitating a more efficient allocation of financial resources. In wellfunctioning economies, banks tend to act as quality controllers for capital seeking successful projects, ensuring higher returns and accelerating output growth. However, a competitive banking system is required to ensure that banks are effective forces for financial intermediation channeling savings into investment fostering higher economic growth. This paper assesses the level of competition in the Ghanaian banking sector. At first sight, the very high profit ratios and high cost structure of Ghanaian banks could indicate a monopolistic banking structure. This is partly corroborated by the findings of this paper. By deriving variables from a theoretical model and using a 1998-2003 panel data set, we find evidence for a noncompetitive market structure in the Ghanaian banking system, possibly hampering financial intermediation. This paper argues that the structure, as well as the other market characteristics, constitutes an indirect barrier to entry thereby shielding the large profits in the Ghanaian banking system. Besides the banking sector, the Ghanaian financial system also includes insurance companies, discount houses, finance houses, leasing companies, savings and loan associations, credit unions, and a stock exchange.2 Thus, by narrowing the focus to the banking sector only, other potentially important participants of the Ghanaian financial system might have been overlooked. However, the banking system is by far the largest component of the financial system, and, according to the recent Financial Sector Stability Assessment (FSSA) update,3 many of these other financial institutions remain underdeveloped, even by sub-Saharan African standards. Moreover, this paper defines the banking sector to include only deposit-taking financial institutions; it excludes rural banks4 and the Bank of Ghana. The remainder of the paper is organized as follows. Section II describes the main characteristics of the structure and features of the banking sector in Ghana, highlighting the main differences between Ghana and other sub-Saharan African countries. The banks’ financial performance is then discussed, and certain possible explanatory factors for the performance are outlined. After a very brief literature survey, Section III presents the theoretical model, operationalizes it by deriving empirical variables, and describes the dataset. Then the overall results are presented and discussed, followed by an attempt to investigate the relationships between the factors of production, macroeconomic variables and revenue and profitability in the banking sector. Section IV summarizes the results and concludes.
2
For a full description of the Ghanaian financial system, see “Ghana: Selected Issues,” Section II in Bredenkamp and others (2003).
3 4
“Ghana: Financial Sector Stability Assessment Update,” IMF Staff Country Report (396/03). The rural banks account for only about 5 percent of banking system assets.
-4-
II. OVERVIEW OF THE GHANAIAN BANKING SYSTEM A. Structure of Ghana’s Banking Sector The Ghanaian banking system is rather diverse. Of the 17 banks operating in Ghana, there were 9 commercial banks, 5 merchant banks, and 3 development banks (Table 1).5 The three largest commercial banks account for 55 percent of total assets of the banking sector, which is relatively moderate compared with other countries in the region. However, about 25 percent of total assets and 20 percent of deposits are held by a single state owned commercial bank (“bank 1”). The development banks and merchant banks, which focus on medium- and long-term financing and corporate banking, respectively, together share about 30 percent. The five small commercial banks operate on a much smaller scale. Foreign investors hold about 53 percent of the shares in eight commercial banks, which is below the sub-Saharan Africa average, and three banks are state-owned (Table 2). The banking penetration ratio, at one bank branch per 54,000 inhabitants, is relatively high, but formal banking reaches only 5 percent of the population and the coverage varies widely. This reflects the fact that 35 percent of bank branches are in the greater Accra region even though this region represents less than 13 percent of the country’s population. About half of all bank branches in the interior belong to the dominant state owned bank. Table 1. Structure of the Banking Sector* Ownership (Percent) Ghanaian Foreign
Total Assets (Bns of cedis)
Banking system Commercial banks Bank 1 Bank 2 Bank 3 Bank 4 Bank 5 Bank 6 Bank 7 Bank 8 Bank 9 Merchant banks Bank 10 Bank 11 Bank 12 Bank 13 Bank 14 Development banks Bank 15 Bank 16 Bank 17
97 10 24 46 39 53 0 9 100
3 90 76 54 61 47 100 91 0
100 6 34 71 100
0 94 66 29 0
100 100 100
0 0 0
As Percent of GDP
Number of Branches
Share of Total (Percent) Total Net Deposits assets lending
18,668
38.2
309
100.0
100.0
100.0
13,055 4,624 2,710 3,011 1,713 470 128 120 230 49
26.7 9.46 5.55 6.16 3.50 0.96 0.26 0.25 0.47 0.10
229 134 24 23 38 6 4 3 1 1
69.3 24.8 14.5 16.1 9.2 2.5 0.7 0.6 1.2 0.3
16.9 18.1 16.3 10.2 2.1 0.6 0.3 0.5 0.3
20.8 16.9 18.8 8.8 2.6 1.0 0.8 1.2 0.3
2,875 751 1,325 409 286 104 2,738 1,847 538 352
5.9 1.54 2.71 0.84 0.59 0.21 5.6 3.78 1.10 0.72
18 5 4 3 2 1 62 42 14 6
4.0 7.1 2.5 1.5 0.6
4.8 8.2 2.1 1.5 0.4
5.4 6.2 2.6 2.0 0.7
0.0 0.0 0.0
11.2 3.8 1.9
8.4 2.0 2.0
Sources: Bredenkamp and others (2003) and IMF Staff Country Report no. 396/03.
* As of December 2002. The housing bank established in 2003 has been excluded from this study.
5
Commercial banks engage in traditional banking business, with a focus on universal retail services. Merchant banks are fee-based banking institutions and mostly engage in corporate banking services. Development banks specialize in the provision of medium- and long-term finance.
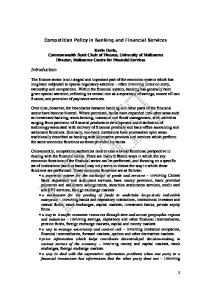
-5As measured by the aggregated total-assets-to-GDP ratio, the banking sector grew rapidly between 1996 and 2000, reflecting partly financial deepening, as well as loose monetary conditions. After reaching 44 percent in 2000, the ratio dropped to 38 percent in 2001 and further to 31 percent at end-2003, reflecting tightened monetary conditions. The same trend characterized the share of commercial banks’ foreign operations: the share of bank assets denominated in foreign currency reached 35 percent on 2000 and then declined to 30 percent in 2001, probably reflecting the increased stability of the cedi exchange rate. Following the tightening of monetary policy in 2001, domestic credit to the private sector has remained at around 10 percent of GDP, which is low even by African standards (Table 2). This essentially reflects a typical crowding-out effect, as most of the banks’ resources are absorbed by the public sector, either in the form of loans to state-owned enterprises or holdings of government securities. As shown in Figure 1, increasing government financing requirements led to very high real treasury bill yields, especially in periods of tight monetary policy, and by extension, to high lending rates. During 1998-2003, net loans averaged 34 percent of total assets (peaking at 43 percent in 2001), as banks preferred to invest their resources in liquid, low-risk assets, such as government securities, the latter constituting about 25 percent of total assets during the period.6
Figure 1. Nominal Interest Rates, Government Debt, Real Growth of Private Sector Credit, Private Sector Credit, 1998-2003 60 50 40 (%) 30 20 10 0 Jan-98
Jan-99
Jan-00
Jan-01
Jan-02
Public Debt to GDP Ratio Nominal Lending Rate Nominal T-Bill Rate
Jan-03
40 35 30 25 (%)20 15 10 5 0 -5 Jan-98
Jan-99
Jan-00
Jan-01
Jan-02
Jan-03
Private Sector Credit to GDP Ratio Real Growth of Private Sector Credit
Source: Bank of Ghana
6
Apart from the financing constraints imposed by Ghana’s large fiscal deficits, the banks’ holdings of government securities is also sustained by high secondary reserve requirements that require banks to hold 35 percent of their deposit liabilities in such securities.
-6In addition, state-owned enterprises have attracted sizable amounts of lending from commercial banks recently, thereby exacerbating the crowding-out effect (Figure 2). As a result, during the last few years, bank lending to the public sector has typically absorbed more than half of total available resources. The residual resources available for lending to the private sector (about 35 percent of total assets in 2003) have been mainly channeled to the manufacturing sector (25 percent of credit to the private sector), commerce and finance (9 percent) and services (8.5 percent). The agriculture, forestry, and fishing sectors have received less than one-tenth of total bank credit although agriculture accounts for 36 percent of GDP. With the exception of the national oil refinery plant—which is the sector’s largest exposure7—no single borrower amounts to 10 percent of the financial sector’s total equity.
Figure 2. Investment and (Gross) Lending of the Banking Sector (1996-2003) A. Share of Total Assets (in percent) 50% 45% 40% 35% 30% 25% 20% 15% 10% 5% 0%
B. Share of Total Lending (in percent)
*
60% 50% 40% 30% 20% 10%
1996 1997 1998 1999 2000 2001 2002 2003
0%
Investment in Bills & Securities Public Sector Loans Private Sector Loans Consumer Loans
1996 1997 1998 1999 2000 2001 2002 2003 Total Lending to the Public Sector Total Lending to the Private Sector
Source: Section II in Bredenkamp and others (2003), Bank of Ghana * Total lending includes loans, overdrafts and investments.
B. Financial Performance of the Banking Sector Financial performance indicators portray a mixed picture. On the one hand, the average capital adequacy ratio (CAR) was about 13.4 percent in 2002 and 9.3 percent at-end 2003, well above the minimum 6 percent required by law. There was, however, significant dispersion among banks, and two small commercial banks even failed to meet the minimum capital standard requirement,8 prompting intervention by bank supervisors. 7
Even though a large portion of TOR’s short-term debt was restructured into medium-term government bonds in 2001 and 2002, TOR exposure still exceeded 75 percent of GCB’s equity capital as of June 2003. 8
IMF Staff Country Report no. 396/03.
-7In addition, as a result of the negative macroeconomic developments in 1999-2000, the asset quality of the banks’ loan portfolio appears to have deteriorated. Past-due/nonperforming loans soared from 16.2 percent in 2000 to an eight-year high of 28.6 percent of total loans in 2001 and 2002 before declining slightly to 24.4 percent in 2003 (Table 3). The overall impact of this sizable increase on the banking system has been partially softened by the relatively prudent lending of the two largest foreign-owned banks, however. The system is also characterized by high overhead costs. The five largest banks incur on average overhead costs of 7 percent to average assets, which is similar to the sector as a whole but substantially higher than the sub-Saharan African average of 5.7 percent. Note, however, that these costs are below those reported in Nigeria and Zambia (Table 2). The high costs could partly reflect substantial investments in banking infrastructure, notably in information and communication technologies, as telecommunication in particular suffers from interconnectivity problems.9 It could also reflect some marketing practices, such as the refusal to network the automated teller machines, which appears to have led to unduly high investments in such systems. However, one key element in the total overhead costs is the staff expenditure component (about 3.7 percent to average assets), which constitutes roughly half of total overhead costs. For example, the dominant state owned bank (“bank 1”) has one of the highest staff costs (4.3 percent to average assets), while the other large commercial banks’ average is 3 percent. This high ratio suggests both a low level of assets per employee and a relatively high average staff cost per employee. On the other hand, profitability indicators indicate that, despite high overhead costs and sizable provisioning, Ghanaian banks’ pretax returns on assets and equity are among the highest in sub-Saharan Africa (Table 2)—a situation that reflects very wide interest margins. On an adjusted basis, the return on assets (RoAA) was 6.1 percent in 2002, which is remarkable even by African standards, and the same applies to both net interest revenue and noninterest revenue which are, respectively, 10 percent and 6.4 percent of average assets. The decline in interest rates in 2002 reduced the banks’ income from government securities and led to a slight narrowing of interest rate spreads, but the latter remain between 20 and 30 percent. The combination of wide interest margins, sizable overhead costs, and an ample supply of relatively low-risk, high-return, government paper, has resulted in high costs of intermediation. Since the large interest margins also reflect the nonperforming loan problem, the poor quality of banks’ loan portfolios is a major source of concern for the stability of the system. Most banks would indeed be vulnerable in the event of a major credit risk shock.10
9
For example, one of the larger, foreign owned banks has set up a direct satellite network to bypass the national telecommunications network altogether. 10
IMF Staff Country Report No. 396/03.
-8-
Table 2. International Comparison of Selected Banking and Institutional Indicators (In percent, unless otherwise indicated) Ghana
Size of financial intermediaries Private credit to GDP M2 to GDP Currency to GDP Banking industry Number of banks Net interest margin Overhead costs Foreign bank share (assets) Bank concentration (3 banks) Nonperforming loans (share of total loans) Capital markets Stock market capitalization (percent of GDP) Contract enforcement Number of procedures Duration (number of days) Bankruptcy Time in years Credit market Credit rights index (0 is weakest)1 Entry regulations Number of procedures Duration (number of days) Cost (percent of GNI per capita)
Kenya
Mozambique Nigeria
South Africa
Tanzania Uganda
Zambia
SSA Average
11.8 19.0 10.5
26.8 43.8 13.2
16.7 5.1 15.6
14.4 25.8 10.8
147.2 87.2 28.4
4.9 18.3 8.5
4.0 13.0 8.8
7.5 16.9 6.4
15.2 24.8 13.9
17 11.5 7.3 53 55.0 28.8
53 5.0 3.7 4.8 61.6 41.0
10 5.9 4.5 98 76.6 ..
51 3.8 7.4 11.0 86.5 17.3
60 5.0 3.7 0.6 77 3.9
29 6.5 6.7 58.7 45.8 12.2
15 11.6 4.6 89.0 70.0 6.5
16 11.4 11.2 66.6 81.9 21.8
.. 8.3 5.7 .. 81.0 ..
10.1
9.2
..
10.9
77.4
4.3
0.6
6.0
21.3
21 90
25 255
18 540
23 730
16 99
26 207
14 127
1 188
29 334
..
4.6
..
1.6
2.0
3.0
2.0
3.7
3.5
1
1
3
1
2
3
1
2
2
10 84 111
11 61 54
16 153 100
9 44 92
9 38 135
13 35 9
17 36 199
6 40 24
11 72 255
Sources: IMF, International Finance Statistics; BankScope; World Bank, World Development Indicators; Doing Business Indicators Database; and Table 2, “Tanzania: Financial System Stability Assessment,” IMF Staff Country Report No 03/241. Washington DC: IMF (2003). Banking statistics and capital market indicators are for 2001. All institutional indicators are for 2003. 1/ The index is based on four powers of secured lenders in liquidation and reorganization. A minimum score of 0 represents weak creditor rights and the maximum score of four represents strong creditor rights. For a description of the methodology, see http://rru.worldbank.org/DoingBusiness/Methodology/CreditMarkets.aspx
-9Table 3. Financial Soundness Indicators for the Banking Sector, 1997–2003 (In percent, at year’s end, unless otherwise indicated) 1997
1998
1999
2000
2001
2002
2003
Capital Adequacy Regulatory capital to risk-weighted assets 1/ Percentage of banks greater or equal to 10 percent Percentage of banks below 10 and above 6 percent minimum Percentage of banks below 6 percent minimum Capital (net worth) to assets
15.2 87.5 6.3 6.3 13.4
11.1 75.0 12.5 12.5 12.2
11.5 60.0 40.0 0.0 12.2
11.6 62.5 37.5 0.0 11.9
14.7 64.7 35.3 0.0 13.1
13.4 52.9 35.3 11.8 12.6
9.3 66.7 27.8 5.6 12.5
Asset quality Foreign exchange loans to total loans 5/ Past-due loans to gross loans Nonperforming loans Watch-listed loans Provision as percent of past-due loans
25.6 24.6 21.6 3.0 78.0
28.5 18.9 17.2 1.7 89.4
33.4 20.1 12.8 7.3 67.2
35.3 16.2 11.9 4.3 58.6
34.1 28.0 19.6 8.4 46.4
33.8 28.6 22.7 5.9 63.6
... 24.4 18.3 6.0 64.4
51.5 8.0 39.9
39.2 8.6 48.9
61.2 8.5 48.8
52.4 9.7 65.7
45.9 8.7 49.7
43.4 6.8 36.9
39.2 6.4 54.0
44.0
42.2
44.3
38.2
40.2
47.3
36.0
37.0 16.3
33.8 22.0
32.5 23.5
30.5 29.3
30.5 29.5
30.5 25.5
23.3 23.0
Liquidity Actual reserve ratio (as percent of total deposits) Excess reserve ratio 4/ Loan/deposit Foreign exchange liabilities/total liabilities 5/
60.1 17.1 42.2 24.9
64.8 21.8 48.7 21.1
61.8 18.8 59.0 29.7
49.9 5.9 64.0 36.2
62.4 18.4 63.9 27.0
66.0 22.0 50.1 27.4
66.1 22.1 56.1 ...
Sensitivity to market risk Net foreign exchange assets (liabilities) to shareholders' funds 5/
62.9
48.1
(7.6)
(9.4)
22.9
24.3
...
Earnings and profitability Net profit (before tax)/net income Return on assets 2/ Return on equity 3/ Expense/income Interest rate spread (deposit money banks) Lending rates minus demand deposit rates Lending rates minus saving deposit rates
Source: IMF Staff Country Report No. 396/03 and Bank of Ghana. 1. The method for calculating CAR is different from that of Basel CAR and is likely to be more conservative than the Basel method. 2. The ratio of net profit before tax to two-year annual average assets. 3. The ratio of net profit after tax to two-year annual average shareholders' funds. 4. The actual reserve ratio in excess of the minimum requirement ratio. 5. No comparable estimate available for 2003 as commercial banks’ foreign assets and liabilities were reclassified.
- 10 -
Table 4. Profitability Indicators (In percent of average assets)
Ghana 1/ Bank 1 1/ Bank 2 1/ Bank 3 1/ Median CFA franc zone 2/ Large SSA economies 2/ Small SSA economies 2/ SSA 2/
Net interest
Noninterest income
Overhead
Provisions
RoAA
RoAE
RoAA
Deflated RoAE
10.0 12.2 10.8 10.7
6.4 4.4 6.7 6.1
7.0 6.4 6.2 7.4
2.2 3.2 0.5 0.2
6.1 6.0 9.7 7.3
36.9 46.1 64.3 53.8
5.3 5.3 8.4 6.3
22.3 31.5 49.6 39.1
4.6 5.9 5.9 5.7
0.6 2.5 1.2 1.2
4.8 5.4 4.6 4.8
1.0 1.2 0.6 0.8
1.8 1.4 2.8 1.9
17.7 16.3 30.1 27.9
1.8 1.3 2.6 1.9
15.0 10.5 20.2 15.0
Sources: IMF, International Financial Statistics; banks’ financial statements, and authors’ estimates. 1/ 2002. 2/ 1998-2001 averages.
C. Possible Factors Explaining Bank Profitability and the Efficiency of Intermediation At least three factors may have prevented further financial deepening in Ghana so far, and which may be relevant for the interpretation of both profitability and efficiency indicators of the banking system. The first factor is macroeconomic policies, as macroeconomic stability is essential to the development of the financial sector. This is relevant because Ghana’s macroeconomic policies over the last decade have been characterized by periodic slippages in financial discipline, leading to volatile and generally high inflation, large exchange rate swings, and negative real interest rates for extended periods. The most recent example of macroeconomic imbalances includes the severe terms of trade shock of 1999-2000, which, combined with fiscal slippages, resulted in inflationary pressures, a 15 percent exchange rate depreciation, and the buildup of a sizable domestic government debt. It is intuitive to assume that the high degree of uncertainty associated with Ghana’s unstable macroeconomic environment has negatively affected both the size and the quality of financial intermediation. This assumption is supported by the low level of overall savings and investment. As shown in Figures 3 and 4, Ghana compared rather poorly to other African countries11 on average in recent years; however, low bank intermediation seems to coexist with a wide range of savings ratios, thereby suggesting that other elements may also be at play. Another piece of evidence is the short time horizon in the overall financial sector. Long-term savings are virtually inexistent, as one-third of all bank deposits are demand deposits and terms for bank 11
In Ghana, the savings-to-GDP ratio was 15.9 percent on average between 1996 and 2002, while the (private) investment ratio was 10.6 percent between 1996 and 2001.
- 11 loans hardly extend beyond one year. In addition, Treasury bills—which were until recently also used for open market operations—carry almost exclusively short-term maturities (three to six months).12 Together with the high returns offered, this situation has exacerbated the crowding-out effect on private sector lending. A second possible factor is the risky lending environment prevailing in Ghana, as reflected in the high level of past-due/nonperforming loans. This is largely due to the significant losses of some state-owned companies, but also reflects the lack of any central credit information system and the lack of cooperation among banks in sharing customer information. Some institutional factors may also affect the environment in which financial institutions operate. For instance, as shown in Table 2, the enforcement of creditors’ rights is weak compared with the sub-Saharan African average. It is important to note that, although nonperforming loans have some substantial provisioning implications, provisioning standards are lower in Ghana than in most African countries.13 Depending on loan classification practices (and potential rollover of debt), this may suggest that the asset quality of banks’ loan portfolio is somewhat overestimated, which may act as a further disincentive to engage in financial intermediation. A third factor that may account for low and inefficient financial intermediation in Ghana is the presence of an uncompetitive market structure. Interestingly, there is no one-to-one relationship between concentration and competition. On the one hand, monopolistic or oligopolistic behavior tends to result in higher intermediation costs and diseconomies of management than under a competitive structure; thus, noncompetitive behavior is consistent with the presence of wide interest rate margins and spreads, which tend to deter potential depositors, as well as potential borrowers, and result in low lending ratios. On the other hand, market size may offer the possibility of exploiting economies of scale (from overhead in administrative operations and information gathering), as well as economies of scope (in combining different product lines for instance).14 What really matters for the net effect on competition is the level of contestability in the market: the threat of potential competition— or lack thereof—can substantially affect competitiveness conditions, regardless of market concentration.
12
However, three-year inflation-indexed bonds were introduced in late 2001 along with secondary reserve requirements that require banks to hold 20 percent of their deposits base in such bonds.
13
In Ghana, nonperforming loans are defined based on a minimum of 180 days in arrears; loans are classified as “substandard” when they are in arrears for 90 to 180 days, as “doubtful” when they are in arrears for 180 to 540 days, and as “loss-making” when arrears exceed 540 days. Full provisioning is required for loss making, whereas substandard loans required a 50 percent provisioning. 14
See Vives (2001).
- 12 -
70
35
60
30
Loans to GDP Ratio (%)
Loans to GDP Ratio (%)
Figure 3. Savings, Investment and Loans Ratios Across Sub-Saharan Africa (1996-2002, average)*
50 40 30 20 10
Ghana
0
25 20 15
Ghana
10 5 0
0
5
10 15 20 25 30 Savings to GDP Ratio (%)
35
40
0
5 10 15 20 Private Investment to GDP Ratio (%)
25
Sources: World Development Indicators database; and IFC Private Investment Trends database. * Savings refer to gross national savings. Loans are to the private sector only. The definition of “private investment” is not uniform across sub-Saharan Africa, and public enterprise investment is often reported as “private investment.”
In the case of Ghana, there are several reasons to question the extent to which banks actually compete. Although bank concentration appears to be moderate by regional standards, the dominant state owned bank (“bank 1”) enjoys a substantial market power, with 20 percent of total deposits and 44 percent of total branches—a situation that may influence price setting among banks and distort competition. Another potential piece of evidence is the fact that the dominant state owned bank invariably records the widest interest margin among commercial banks (12.2 percent in 2002; see Table 4). However, beyond anecdotal evidence, more analysis is needed to draw some firm conclusions about the nature of the market structure in Ghana and the extent to which it offers a plausible explanation of the sector’s profitability. Therefore, the next section introduces a basic analytical framework to assess the nature of competitive conditions. III. ANALYTICAL FRAMEWORK AND ECONOMETRIC ESTIMATION The concept of market contestability has spanned a large theoretical and empirical literature covering many industries. The basic idea of market contestability is that, on the one hand, there are several sets of conditions that can yield competitive outcomes, with a competitive outcome possible even in concentrated systems. On the other hand, collusive actions can be sustained even in the presence of many firms. The most commonly used models for testing for the degree of competition are Bresnahan (1989) and Panzar and Rosse (1987). The Bresnahan model uses the condition of general market equilibrium and rests on the idea that profit-maximizing firms in equilibrium will choose prices and quantities such that marginal costs equal their (perceived) marginal revenue, which coincides with the demand price under perfect competition, or with the industry’s marginal revenue under collusion. The model generally uses industry aggregates (although firm-specific data is possible) and permits
- 13 estimation of a measure of the degree of competition. The Panzar and Rosse model takes a slightly different route and investigates the extent to which a change in factor input prices is reflected in (equilibrium) revenues earned by a specific bank in the context of a Chamberlinian equilibrium model. Like the previous model, the Panzar and Rosse approach leads to an estimate of the degree of competition. The advantage of the latter is that it uses bank-level data, allows for bank-specific differences in the production function, and permits an analysis of the differences between types of banks in terms of size and ownership. A. The Panzar and Rosse Analytical Framework Consider the following structural demand and cost relationship facing a particular firm i: Ri = Ri ( y i , n, z i )
C i = C i ( y i , pi , xi ) , where
(1) (2)
R = total revenue C = total costs y = output n = number of firms z = exogenous variable affecting revenue p = input prices and x = other exogenous variables, with all variables are expressed in logarithms,
Profits are defined as π i = Ri ( y i , n, z i ) − C i ( y i , pi , xi ) , implying that the firm maximizes its profits where marginal revenue equals marginal costs (equation 3). This means that in equilibrium, the zero profit constraint holds at the market level as well: ∂Ri ∂C i (3) − = 0. ∂Ri ( y i , n, z i ) ) ∂C i ( y i , pi , xi ) Profit-maximizing output is defined as equation (4), with an asterisk (*) representing equilibrium values. Substituting (4) into (1), and assuming that n is endogenously determined in the model, yields equation (5), which is the reduced-form of the revenue function. y *i = y *i ( z i , p i , x i ) R *i = R *i ( y *i ( z i , pi , xi ), n*, z i ) ≡ R * ( z i , pi ) .
(4) (5)
Note that market power is measured by the extent to which a change in factor input prices (∂pi) is reflected in the equilibrium revenue (∂R*i) earned by firm i. Panzar and Rosse then define a measure of competition H as the sum of the elasticities of equation (5) with respect to input prices, with i denoting a particular firm. H =∑ i
∂Ri* pi . ∂p i Ri*
(6)
- 14 According to Panzar and Rosse, it is not just the sign of the H-statistic that matters, but its magnitude as well. Under a monopolistic structure, an increase in input prices P will increase marginal cost, thus reducing equilibrium output y* and revenue, thereby implying than the H-statistic value be less or equal to zero. In contrast, in a perfectly competitive setting in the long-run, an increase in input prices P will increase marginal cost as well as average costs by the same proportion, without—under certain assumptions—changing the equilibrium output of banks. As inefficient banks are forced to exit the market, the increased demand faced by the remaining firms leads to an increase in output prices and revenues in the same proportion as costs, thereby implying a value of the H-statistic equal to unity. In the case of monopolistic competition, described as the most plausible characterization of banks’ interactions by Bikker and Haff (2002b) p.6, under certain assumptions an increase in input prices P will lead to a less than proportional increase in revenues, as the demand for banking facing individual banks is inelastic. In this case, the H-Statistic will lie between 0 and 1. The main discriminatory powers of the H-statistics, as discussed in the literature, are summarized in Table 5. Table 5. Panzar and Rosse’s H-Statistics Values of H H≤0 0