Comparisons and contrasts of the impact of the crisis on euro area labour markets Report prepared by ad hoc ESCB Team Robert Anderton, Team Chairman Deputy Head of Surveillance Division (SUR)
Report coordinators/editors: V. Jarvis, B. Szörfi (OAD) Presentation prepared by V. Jarvis, M. Périnet and B. Szörfi (OAD), on behalf of the ESCB Team.
Presentation to OECD 18 March 2015
Overview of Rubric
the presentation
1
Labour market dynamics and unemployment over the crisis
2
Labour market slack and structural unemployment
3
Wage adjustment
4
Concluding remarks: summary of main findings and policy implications
2
www.ecb.europa.eu ©
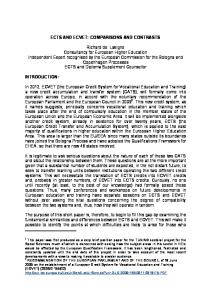
A Rubric larger, longer-lasting impact on employment of the crisis compared to the past. Both recession phases of crisis had strong impacts on euro area labour market, despite a much milder downturn second time around… Euro area employment across recessions
Euro area employment, GDP and unemployment since 1999
(index T=100 at cyclical peak in GDP; intervals are quarters)
(year-on-year growth rates; % of labour force) GDP
1980 Q1
1992 Q1
2008 Q1
employment (lhs)
unemployment rate (rhs) 6
102
13
4 100
12
2 11 0 10
98 -2
9 -4 96 8
-6
-8 1999
94 T-8
T-4
T
T+4
T+8
T+12
T+16
T+20
T+24
Source: Eurostat and ESCB calculations.
7 2001
2003
2005
2007
2009
2011
2013
Source: Eurostat and ESCB calculations. 3
www.ecb.europa.eu ©
Differential impacts of Rubric
the two recessions on euro area labour markets
… with stronger impacts across the stressed euro area countries. Evolution of unemployment rates across euro area countries 2008
2011
2013
30 25 20 15 10 5 0 euro area
CY
SI
IE
IT
GR
PT
ES
NL
stressed countries
AT
LU
EE
MT
FI
BE
FR
DE
LV
SK
other euro area economies
Sources: Eurostat and ESCB calculations. Note: within groups, countries are ordered according to their unemployment rate level in 2008. 4
www.ecb.europa.eu ©
Labour Rubricmarket flows: Job separation rates rose, but job-finding rates declined much more…
Flows from unemployment to employment over the crisis
Flows out of employment into unemployment over the crisis
(job finding probabilities)
(job separation probabilities) 8
35 2005Q1-2008Q1
7
2005Q1-2008Q1
2008Q2-2011Q2
30 2011Q3-2013Q1
2008Q2-2011Q2 2011Q3-2013Q1
6 25 5 20 4 15 3 10
2
5
1
0
0 EA11
EE
IE
GR
ES
FR
IT
NL
AT
PT
SI
SK
FI
EA11
EE
IE
GR
ES
FR
IT
NL
AT
PT
SI
SK
FI
Source: Eurostat (EU Labour Force Survey microdata) and ESCB calculations. Notes: EA11 excludes Portugal for which data are not available before 2008. Separation probabilities computed as percentage of the labour force each quarter. Separations include voluntary quits. Job finding rates are computed as a share of those unemployed in the previous quarter. 5
www.ecb.europa.eu ©
Job losses heavily concentrated by country, sector, skills and age Rubric Employment losses by sectors and worker groups (percentage change in employment between 2008 and 2013)
by sectors
by educational attainment
by age
Source: Eurostat and ESCB calculations. 6
www.ecb.europa.eu ©
Were young people “pushed out” of Rubric
employment by older workers?
Increased employment of older workers also reflects rising participation of this group following pension reforms in many countries…
But micro analysis shows no negative impact on young persons from higher employment propensities of older workers …perhaps even complementary?
Euro area participation rates by age groups
Estimation of the potential displacement effect of young workers by older workers.
(annual change in the participation rate, in percentage points) total
15-24
25-54
55-64
3
Dependent Variable Probability of being employed for a young person
Dependent Variable Probability of being unemployed for a young person
0.017
-0.0751*
Probability of young persons entering employment
Probability of young persons exiting employment
0.0393
0.0258
2 Employment rate (55-64)
1
0
-1 Change in employment rate (55-64) -2 2007
2008
2009
2010
2011
2012
2013
2014
Sources: Eurostat and ESCB calculations. 7
Notes: Eurostat and ESCB calculations. Besides the aggregate employment rate of senior workers, the other regressors are gender, age, education, aggregate employment rate for the 40-49 age group (expressed in changes for entry/exit), constant, fixed effects: region, year, country, year*country. Sample period: 2006-2012. www.ecb.europa.eu © * Indicates statistically significant at 10% level.
Nevertheless, the crisis resulted in a strong rise in youth unemployment. Rubric … as a consequence in part of “last in, first out” practices, lower human capital, and a higher propensity of temporary contracts among the young…particularly in the stressed countries…. …….but unemployment ratios give less dramatic picture… Unemployment rate (total and youth) in euro area, stressed countries and other euro area economies
Unemployment rate and unemployment ratio (as % of youth labour force and youth population), 2013
euro area - total
euro area - youth
stressed countries - youth
other countries- youth
unemployment rate
unemployment ratio
70
50 45
60
40
50
35 30
40
25
30
20 15
20
10
10
5 0
0 07Q1
08Q1
09Q1
10Q1
11Q1
12Q1
13Q1
14Q1
EA
Source: Eurostat and ESCB calculations. Note: Youth refer to the 15-24 age group.
GR ES IT CY PT SK IE FR BE LV SI FI EE LU MT NL AT DE
Sources: Eurostat and ESCB calculations. Note: the unemployment ratio is defined as the share of youth unemployed over the youth population. 8
www.ecb.europa.eu ©
Overview of Rubric
the presentation
1
Labour market dynamics and unemployment over the crisis
2
Labour market slack and structural unemployment
3
Wage adjustment
4
Concluding remarks: summary of main findings and policy implications
9
www.ecb.europa.eu ©
Discouragement and underemployment have increased considerably... Rubric Significant rise in: (1) discouraged workers and (2) underemployment (involuntary part-time workers who would like to work more hours). Implies labour market slack is considerably greater than suggested by headline unemployment rate… Broader measures of economic slack for the euro area (annual averages) PTER as % active labour force
(headline) unemployment rate
Discouraged as % active labour force
unemployment rate + part time for economic reasons unemployment rate + part time for economic reasons + discouraged
12 25
10
20
8
15
6
10
4
5
2
0
0 2008
2009
2010
2011
2012
2008
2013
2009
2010
2011
2012
2013
Source: Eurostat, EU Labour force survey and ECB calculations Notes: PTER refers to those working "part time for economic reasons". Active labour force includes discouraged workers, where appropriate.
10
www.ecb.europa.eu ©
Long-term unemployment has also risen and the Beveridge curve shows an outward shift Rubric Long term unemployment (>12m) has grown substantially and the euro area Beveridge curve shows a marked outward shift (statistically significant in econometric analysis)..… Movements in the euro area Beveridge curve
Long term unemployment in stressed and other euro area countries
(as % of labour force; limits to production from shortage of labour)
(as a percentage of total unemployment) 60
1
euro area
01Q1
stressed economies 55
12
0.9
other euro area countries
10 0.8
08Q1
50
45
Labour shortages
0.7 0.6 0.5
40
8 12Q1
02Q1
6
07Q1
14Q1 11Q1
0.4
35
13Q1
4
03Q1 04Q1
0.3 30 0.2
09Q1
2
10Q1
25
0.1 0
20 07 Q1
0 08Q1
09Q1
10Q1
11Q1
12Q1
13Q1
7
14 Q1
Source: Eurostat and ESCB calculations Notes: Long-term unemployment is defined as those without jobs for 12 months or more.
11
8
9
10
11 12 Unemployment rate
13
Source: Eurostat and ESCB calculations. Notes: vacancy developments approximated by DG-ECFIN series of labour shortages as reported by manufacturing employers. www.ecb.europa.eu ©
… due to increasing skill mismatch Rubric Skill Mismatch Index (SMI) suggests notable increase in skill mismatch over the course of the crisis, particularly in stressed economies Skill mismatch across stressed and other euro area countries
Skill mismatch in the euro area labour market (difference between skill distributions between employed workers vs. all labour force participants) euro area
country
(difference between skill distributions between employed workers vs. all labour force participants)
region
stressed countries
other euro area economies
0.16%
0.10%
0.14% 0.08%
0.12% 0.10%
0.06%
0.08% 0.04%
0.06% 0.04%
0.02%
0.02% 0.00% 2001
2003
2005
2007
2009
0.00%
2011
1998
2000
2002
2004
2006
2008
2010
2012
Source: Eurostat and ESCB calculations. . 12
www.ecb.europa.eu ©
Migration trends over the crisis helped to reduce labour market pressures…. Rubric Migration trends helped to alleviate occupational bottlenecks and demographic pressures (eg, declining national populations). Population growth and contributions, other euro area countries
Population growth and contributions, stressed countries (annual percentage growth)
(annual percentage growth) immigration growth nationals growth population growth
immigration growth nationals growth population growth
2.0%
0.6%
1.5%
0.4%
1.0% 0.2% 0.5% 0.0% 0.0% -0.2% -0.5% -0.4%
-1.0%
-0.6%
-1.5% 2006
2007
2008
2009
2010
2011
2012
2006
2013
2007
2008
2009
2010
2011
2012
2013
Source: Eurostat and ESCB calculations.
Source: Eurostat and ESCB calculations. 13
www.ecb.europa.eu ©
Strong increase in structural unemployment Rubric Structural unemployment estimates have risen substantially …..consistent with rising long-term unemployment and higher mismatch. Structural unemployment rate in the euro area
EC
IMF
OECD
25
actual unemployment rate
11
10
9
8
7 2000
the
crisis…
Evolution of the structural unemployment rate between 2008 and 2013
structural unemployment rate in 2013
12
since
ES
GR
20
PT
CY
15
IE
LV IT EEFR
SI
10
FI BE NL
5
LU AT
SK
euro area
DE MT
0 2002
2004
2006
2008
2010
0
2012
Source: EC, Eurostat, IMF, OECD and ESCB calculations.
5 10 structural unemployment rate in 2008
15
Source: European Commission Notes: the dark line is a trend line 14
www.ecb.europa.eu ©
Overview of Rubric
the presentation
1
Labour market dynamics and unemployment over the crisis
2
Labour market slack and structural unemployment
3
Wage adjustment
4
Concluding remarks: summary of main findings and policy implications
15
www.ecb.europa.eu ©
Response Rubric of wages to unemployment increased… While wage response was low over the first phase of the crisis, there has been some increase over the second phase, implying a ‘steeper’ Phillips curve compared to first phase... (annual percentage point changes; annual percentage changes) pre-crisis (2005-07)
Great recession phase
second recession phase
pre-crisis (2005-2007)
Great recession phase
second recession phase
change in compensation per employee
12
8
4
0 change in unemployment rate
-4
-8 -5
0
5
Source: Eurostat and ESCB calculations. 16
www.ecb.europa.eu ©
Downward Rubric wage rigidities declined over the crisis Rolling regression of the downward rigidity parameter (D*U)
Panel estimates of euro area wage equation (elasticities)
D*U
(1)
(2)
U
-0.465***
-0.411***
Δprod
0.782***
0.754***
ΔCPI
0.779***
0.777***
D*U
0.105***
0.194***
95% confidence interval
0.3
0.25
0.2
0.15
D*U*Trend
-0.008**
Constant
4.089
3.677
0.1
Observations R2
874 0.75
874 0.751
0.05
14
14
1.428 0.74
1.424 0.741
Nb of euro area countries SER Adj-R2
Sources: Eurostat and ESCB calculations. Notes: Dependent variable - nominal compensation per hour; sample period maximum data range 1991Q4-2013Q4.; unbalanced panel, fixed effects; Long-run parameters ; D*U*Trend begins in 2008Q1.
0 08Q1
09Q1
10Q1
11Q1
12Q1
13Q1
Sources: Eurostat and ESCB calculations.
D*U: lower wage response to unemployment during downturns (confirms downward wage rigidities). D*U*Trend: wages become more responsive to unemployment as crisis becomes more protracted (downward wage rigidities become weaker: reforms,17public sector pay constraint, threshold effects?). www.ecb.europa.eu ©
Overview of Rubric
the presentation
1
Labour market dynamics and unemployment over the crisis
2
Labour market slack and structural unemployment
3
Wage adjustment
4
Concluding remarks: summary of main findings and policy implications
18
www.ecb.europa.eu ©
Rubric Concluding remarks – summary of findings and policy implications • The crisis had uneven impacts on EA labour markets –
lower GDP fall in second EA recession, but almost as many job losses, mostly in stressed economies
• Labour market flows suggest sharp rise in unemployment in 2nd recession due to marked decline in job-finding probabilities
• Young and less-skilled most heavily employment continued to increase…
affected,
while
older
workers’
... but older workers did not displace younger workers More emphasis on reducing labour market dualism – focusing on reducing average adjustment costs - and enhanced ALMPs would help increase transitions to employment
• In wider labour market, discouragement and underemployment have risen implying considerably more slack than suggested by headline unemployment figures.
• Long-term unemployment and structural mismatch have increased, leading to strong rises in structural unemployment, particularly in stressed economies – –
more emphasis on increasing mobility will help alleviate high local unemployment. ALMPs are needed to help the displaced retrain for changing sectoral composition of employment.
• Downward wage rigidities reduced as crisis persisted –
but more wage and employment flexibility – and greater wage differentiation - required to accelerate adjustment/reallocation and reduce structural unemployment.
19
www.ecb.europa.eu ©
One final reminder from the US unemployment rate of Rubric
the need for reforms
Upward shocks to euro area unemployment tend to persist (rigidities), while reversed in the US (flexibility) Unemployment rate in the euro area and the United States 13 euro area
United States
trend (euro area)
trend (United States)
11
9
7
5
3 1980
1985
1990
1995
2000
2005
2010
Source: OECD, Area Wide Model Database (AWM, ECB Working Paper Series No 42) 20
www.ecb.europa.eu ©