This report was prepared by the Mizuho Research Institute Ltd. by the commission of the Economic and Social Research Institute in fiscal 2005.
Comparative Analysis of the BRICs (abstract) March 2006 Mizuho Research Institute
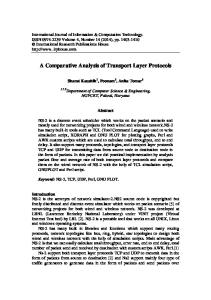
I. BRICs – reasons for the focus of attention BRICs economies are growing strongly and possess huge potential The "BRICs” refers to the four countries including Brazil, Russia, India and China High economic growth; the BRICs economies are continuing to grow strongly in contrast to the Asian and NIEs economies which have slowed down to half the speed [Chart 1-1] Huge potential growth; Goldman Sachs Report (October 2003, updated December 2005) Outlook on BRICs’ economic growth up to 2050, based upon the rate of economic growth and forex rate The size of the BRICs economy will be comparable to the G7 nations in 2040 [Chart 1-2]. The ranking in terms of the size of the economy in 2050 will be (1) China, (2) US, (3) India, (4) Japan, (5) Brazil, (6) Mexico, and (7) Russia.
Chart 1-1 Comparison of GDP growth: NIEs vs. BRICs Chart 1-2 Long-term outlook on BRICs real GDP (Trillion US$)
(% ) BRICs
8
7.9 Asia NIEs
Russia
800
6.9 6.0
India
600
6 4.2 4
G7
400
China
200 2
Brazil
0 0
05 1987-96
1997-2006
Note: Real GDP growth (yearly average). Source: IMF, "World Economic Outlook," September 2005.
10
15
20
25
30
35
40
45
50
Note: US$ value in 2005. "G7" = Canada, France, Germany, Italy, Japan, UK, US. Source: Goldman Sachs, "How Solid are the BRICs?" December 2005.
1
II. The rising presence and influence of the BRICs (1) BRICs’ position in the global economy BRICs – a 10% player in the global economy [Chart 2-1] Total land area: 29%. Population: 43% of the world. Nominal GDP: 9%. Exports 10% share. Foreign direct investment 6%. Foreign reserves: 24% of the world. In terms of per-capita GDP, the BRICs economies are equivalent to the average developing nation [Chart 2-2]. In terms of income levels, Brazil and Russia stand on par with Japan in the second half of the 1960s, China is on par with Japan around 1960 and India is on part with Japan in the first half of the 1950s.
Chart 2-1 BRICs' share of the global economy
Population
Nominal GDP
Nominal GDP (PPP) 24.3 2.6 2.6 5.9 13.2
Exports
(% ) Foreign FDI currency outstanding reserves 6.0 23.7 1.7 1.4 1.1 3.1 0.4 3.3 2.8 15.9
BRICs 42.6 8.6 10.4 Brazil 2.8 1.5 1.1 Russia 2.3 1.4 2.0 India 17.0 1.6 0.8 China 20.5 4.0 6.5 Developed 12.7 70.1 46.9 52.8 60.3 nations US 4.6 28.7 20.9 8.9 16.5 Japan 2.0 11.4 6.9 6.2 1.1 EU15 6.1 30.0 19.2 37.7 42.6 Asia NIES 1.3 3.1 3.5 9.6 8.0 ASEAN10 8.6 1.9 4.3 6.0 3.6 Global total 100.0 100.0 100.0 100.0 100.0 Notes: 1. Data as of 2004 (except for population (2003)). 2. Dollar-based, except for population. 3. Brunei is not included in data on foreign currency reserves. Sources: IMF, UNCTAD, World Bank, WTO.
31.8 2.0 21.6 8.2 21.0 7.4 100.0
Chart 2-2 Per-capita real GDP 1 2 3 4 5 6 7 8 9 10 11 12 13 14 15
Luxembourg Ireland Norway US Denmark Iceland Canada Switzerland Austria Australia Netherlands Belgium Japan Germany France
58,852.4 35,650.5 35,586.5 35,484.4 29,724.7 29,515.4 28,980.7 28,862.2 28,429.2 27,993.2 27,746.7 26,767.5 26,419.9 26,220.8 26,146.0
49 50 51
Malaysia Russia Mexico
8,986.3 8,719.7 8,661.2
54 55 56
Grenada Brazil Bulgaria
7,518.3 7,359.5 7,303.8
83 84 85
Lebanon China Venezuela
4,793.0 4,726.4 4,646.5
104 105 106
Vanuatu India Honduras
2,781.5 2,731.9 2,517.7
Note: 2003, US$ value gauged by purchasing power parity. Source: World Bank, "World Development Indicators."
2
(2) Trade and FDI BRICs: growing presence in global trade and foreign direct investment The percentage share of the BRICs in global export grew from 4.2% in 1992 to 10.1% in 2004, while the share of global trade among developed countries shrank from 52.6% to 42.1%. Approximately 10% of global exports is comprised of exports by the BRICs. However, among the BRICs countries, there is a large gap between China and the remaining three countries. China’s exports are growing to 6.4% of global exports (2004), which contrasts with Russia (1.8%), Brazil (1.3%) and India (0.8%). [Chart 2-3] The gap between China and the remaining three countries is also prevalent with respect to foreign direct investment (FDI). In comparison to 9.4% of global FDI inflows to China (2004, flow-basis), there is a gap of approximately 3.4~11.8 times with Brazil (2.8%), Russia (1.8%) and India (0.8%). The value of FDI inflows to China is approximately 30% of FDI to developing countries. [Chart 2-4]
Chart 2-3 Share of BRICs in global trade (based upon exports) (%)
Chart 2-4 Share of BRICs in FDI to developing countries (flow-basis) (%)
China
6
40 30 China
4
20 Russia
2
Brazil India
0 1980
85
90
95
2000
Source: IMF, "Direction of Trade Statistics Yearbook, 2005."
Brazil
10
Russia India
0 1992
94
96
98
2000
02
04
Source: UNCTAD, "World Investment Report 2005."
3
(3) Energy supply and demand Energy demand among the BRICs is rising due to economic growth Energy demand among the four BRICs countries is rising amid solid economic growth in recent years. Unit energy consumption (energy consumption per unit of GDP output) among the BRICs is very high. [Chart 2-5] Primary energy consumption among the BRICs rose 61.7% from 1985 to 2004, while global primary energy consumption increased 42.1% (contribution by BRICs: 33.2%). As a result, the percentage share of BRICs’ primary energy consumption in the world rose from 22.7% in 1985 to 25.8% in 2004. [Chart 2-6] On the supply side, Russia gained importance as an exporter of crude oil and natural gas. The three B(R)ICs countries other than Russia are all net importers of crude oil [Chart 2-7]. Chart 2-5 Unit energy consumption of the BRICs
Chart 2-7 Crude oil supply and demand of the BRICs
(TOE/GDP US$ million)
Brazil
Russia (Million ton)
(Million ton) 1,000
100
600
Amount of consumption
Amount of production
80
500
400
60 0 Russia
China
India
Brazil
US
Japan
40
200
20
Note: 2004. TOE = ton of oil equivalent. Sources: IMF, BP (British Petroleum).
Amount of production
0 1985
90
Chart 2-6 Primary energy demand of the BRICs
2000
India
China
(Million ton)
(Million TOE)
120 10000
China
100
9000
India
8000
80
Russia
60
Brazil
40
7000 6000 0 1985
95
The rest of the w orld 90
95
2000
Amount of consumption 0 1985 90 95 2000
(Million ton)
Amount of consumption
Amount of consumption
200 Amount of production
100
20 0 1985
300
Amount of production 90
95
2000
0 1985
90
95
2000
Source: BP (British Petroleum).
Source: BP.
4
(4) Environmental issues Exacerbating environmental pollution issues due to rapid industrialization and population concentration in large cities Issues regarding air & water pollution, waste disposal and the decline of woodlands are worsening. The increase of CO2 emissions among the BRICs may escalate into a global environment issue. [Chart 2-8]
Environment technology transfers from developed countries to the BRICs are indispensable for sustainable economic development For example, given the high potential of greenhouse gas reduction in the BRICs [Chart 2-9], the Kyoto Mechanism is the key to effective measures to counter global warming.
Chart 2-8 Outlook on global CO2 emissions
Chart 2-9 Shares of greenhouse gas reduction operations, by region & country
Other developing countries Brazil
Developing countries
India China
Annex I countries (exc US)
Developed countries
US
Source: Compiled by the Ministry of Economy, Trade and Industry (Japan), basedupon data released by the US Department of Energy.
5
(5) International finance Rising impact of the BRICs in global financial markets The BRICs share part of the global imbalance. The US current account deficit (capital imports) and the current account surplus (capital exports) of emerging and oil producing countries including the BRICs. Capital movements run counter to the "common assumption” that capital flows from developed countries to developing countries. Recent capital exports by emerging countries stem mainly from rising foreign exchange reserves. [Chart 2-10] In the background to the rise of foreign exchange reserves, there are "self-insurance" motives against financial crises. However, the reserves are surpassing targets and may be reaching excessive levels. [Chart 2-11] Ratio to imports: reserves for a "current-account crisis" – approximately 3-months Ratio to short-term external debt: reserves for a "capital-account crisis" – 1-times Chart 2-10 Net capital inflows to emerging countries (Billion US$)
Chart 2-11 BRICs foreign exchange reserves
Net capital inflow (ex foreign reserves) Portfolio investment
Foreign reserves (Million US$)
Ratio to imports (months)
200 Direct investment 0
1996
2004
1996
2004
1996
2004
Brazil
58,323
52,740
10.60
7.90
1.11
1.33
Russia
11,276
120,809
1.56
11.14
0.42
3.72
India
20,170
126,593
4.40
16.17
2.65
4.97
China
107,039
614,500
8.33
12.16
3.80
14.38
Other investment
-200 -400
Ratio to short-term external debt (times)
Net capital inflow
Change in foreign reserves
-600 1994 95 96 97 98 99 2000 01 02 03 04 Source: IMF, "Global Financial Stability Report," September 2005.
Notes: 1. India’s ratio of imports (2004) is the ratio of FX reserves to imports in 2003. 2. Short-term external debt refers to the total of bank loans with less than a year until maturity and bonds (the two may overlap). Source: "Joint BIS-IMF-OECD-World Bank Statistics on External Debt."
6
III. BRICs - characteristics of economic development patterns (1) Macroeconomic performance BRICs are currently recording strong economic growth [Charts 3-1, 3-2,3-3] However, there are disparities in sustainability and stability. Even though Brazil experienced a period of hyperinflation in the early 1990s, it regained stability by adopting the "Real Plan." Brazil’s economic growth reached approximately 5% in 2004. Russia also suffered from negative economic growth and high inflation from its start in 1992 up to 1998. However, Russia has maintained high economic growth from then onward. China and India have been maintaining high stable growth since the 1990s. Although China’s rate of economic growth is higher, India prevails in terms of stability. Chart 3-1 Real GDP growth
Chart 3-2 The CPI
Chart 3-3 Real effective exchange rate (Jan 1990= 100)
(%) 15
Russia
China 140
10
120
India
5
Brazil
100
0
Brazil
-5
Russia
92
94
96
98
2000
02
40 1990 92
04
Brazil Russia India China
Real GDP Yearly average 2.5 -0.9 5.7 9.0
96
98 2000 02
04
Real effective exchange rate
CPI Instability 0.02 0.15 0.02 0.04
94
Notes: 1. Monthly data. 2. For Russia, Jan 1993 = 100. Source: Datastream.
Sources: IMF, "World Economic Outlook Database," Sept. 2005, National Bureau of Statistics of China.
Country
India
60
-10 -15 1990
China
80
Yearly average 69.0 46.7 7.3 5.4
Instability 2.39 0.97 0.06 0.15
Instability 11.7 20.0 6.4 10.2
Note: "Instability” represented as standard error of the mean (the real effective exchange rate is the standard deviation) . The lower the value, the more stable. Source: IMF "World Economic Outlook Database," Sept. 2005 Datastream
7
(2) The drivers of growth – industrial and demand structures Differences from changes in industrial structure [Chart 3-4] Brazil: Shift toward the service sector from the mid-1980s. However, agriculture, forestry & fisheries and the mining & manufacturing sectors are growing faster given the rising price of food and mineral resources. Russia: Sectors related to natural resources such as petroleum and natural gas are fueling the strong growth. India: Services (mainly IT-related) are the drivers of growth. China: Despite a gradual shift toward services, the share of mining & manufacturing is the largest among the BRICs.
Differences from changes in demand structure [Chart 3-5] Brazil: While consumer spending accounts for 60% and gross fixed capital formation accounts for 20% of demand, shares of both components are declining. The percentage of exports is expanding rapidly. Russia: Gross fixed capital formation is shrinking as a percentage of demand. High dependence upon exports, reflecting its booming natural resource exports. India: Consumer spending Is the largest component of demand. Gross fixed capital formation is stable at around 20%. Exports are a relatively small component of demand. China: Sharp expansion of gross fixed capital formation and exports, as a percentage of demand. Chart 3-4 Shifts in industrial structure (based upon GDP) Brazil
Russia
India
Chart 3-5 Shifts in demand structure (based upon GDP)
China
Brazil
(%)
Russia
India
China
(%)
70 a 3 Services
60
60
3
a
a Personal consumption
50 2 40
2 Mining & manufacturing, public services
40 1
30
b
3
b Gross fixed capital formation b
20 2
1 Agriculture, forestry & fisheries
10
20
1
c
c Exports
c
0 90
93
96
99
02
90
93
96
99
02
90
93
96
99
02
90
Note: " 3 Services" = 100% minus 1 2and the construction sector's share. Nominal basis. Source: United Nations Statistics Division, and others.
93
96
99
02
0 90
93
96
99
02
90
93
96
99
02
90
93
96
99
02
90
93
96
99
02
Source: United Nations Statistics Division, and others.
8
(3) The drivers of growth – production factors Growth accounting analysis of the BRICs Growth accounting analysis with 4 components: labor, physical & human capital and total factor productivity (TFP). Note: this may not necessarily be compatible with Russia’s case, since Russia’s growth is generated mainly by extracting natural resources rather than the creation of added value from production factors. Growth accounting analysis of the BRICs [Chart 3-6]: In China and India, TFP and physical capital are the drivers of growth. Brazil’s growth is driven by the well-balanced input of production factors. Russia’s strong growth since 1999 reflects the rise of crude oil prices (resulting in the rise of TFP as a residual).
Chart 3-6 Growth accounting analysis of the BRICs (%) Rate of economic growth (real)
Per capita economic growth rate Working age population
Physical capital
Human capital
Total factor productivity (TFP)
0.6
0.5
Brazil 1991 - 2000
2.7
0.9
0.7
(2001 - 03 )
( 1.0 )
( 0.7 )
( 0.7 )
1994 - 2000
-1.1
0.1
0.0
(2001 - 03 )
( 5.7 )
( 0.0 )
( 0.2 )
( -0.4 )
0.4 ( -0.7 )
Russia 0.0
-1.2 ( 5.5 )
-1.5 ( 5.7 )
India 1991 - 2000
5.5
0.9
1.5
( 2001 - 03 )
( 6.0 )
( 0.8 )
( 1.0 )
10.1
0.5
2.5
0.6
2.5 ( 4.1 )
3.3 ( 3.8 )
China 1991 - 2000
0.3
6.9
8.9
Notes: 1. Physical capital stock for Russia and China are estimates by MHRI. Estimates on Russia are based upon data since 1994 due to its reliability. 2. Human capital is based upon the average years of schooling of the populati on aged 15 and older. As regards 2001 -2003 on which data on human capital are unavailable, the rate of real economic growth is calculated as follows upon the assumption that the contribution by human capital is included in the rate of TFP growth: real economic growth rate = 0.4 x rage of growth of labor force population + 0.3 x rate of growth of material capital+ rate of TFP growth. Sources: World Bank, "World Development Indicators," United Nations, "World Population Prospects 2004," Barro and Lee Data .
9
Assessing the BRICs in terms of production factors Working age population: In contrast to ongoing strong growth in Brazil and India, Russia’s population has started to decline [Chart 3-7] Human capital:
Russia is the leader in terms of the average length of school attendance (however, Russia’s per capita income level is low), in sharp contrast to wide disparities in India. [Chart 3-8]
Physical capital:
In terms of investment/GDP ratio since the 1990s, China ranks topmost (almost 40% concerns regarding "excessive investment”) in contrast to the stagnation in Brazil and Russia.
Savings rate:
The breadth of savings surplus (savings - investment) has been expanding (rise of the current account surplus) in recent years. This stems from factors such as the improvement of the fiscal balance (Brazil, Russia, China) and the increase of internal reserves among corporate enterprises (China).
Chart 3-7 Average rate of change of the population (15-64)
Chart 3-8 Educational attainment among the BRICs
(%)
No school
4
Secondary
Higher
Brazil
(Percentage in population aged 15 and above)
3 India
2 China
1 0
-2 60-70
70-80
80-90
90 -2000
00-10
Note: Medium variant. Source: United Nations, "World Population Prospects 2004."
Average years of school (Years)
Brazil
16.0
62.2
14.4
7.5
4.88
Russia
1.2
32.1
50.2
16.6
10.03
India
43.9
28.2
23.8
4.1
5.06
China
18.0
33.9
45.3
2.8
6.35
Japan
0.2
27.5
50.1
22.2
9.47
US
0.8
8.2
42.9
48.1
12.05
Germany
3.9
18.6
61.4
16.1
10.20
Korea
6.5
11.9
55.2
26.3
10.84
(Reference)
Russia
-1
1950 -60
Primary
10-20
20-30
Source: Barro and Lee Data.
10
(4) The role of economic deregulation measures Deregulation of the economy and the shift toward a market economy Public corporation reforms, deregulation of trade & investment, easing/improvement of regulations related to labor, finance and business. [Chart 3-9]
Economic deregulation is contributing to BRICs’ economic development, albeit differences in degree of impact Brazil:
Progress of privatization since the 1990s. Expansion of trade, leveraged by the introduction of foreign capital and opening of markets.
Russia: Shift of production and investment structure from one comprised mainly of state-owned enterprises to one based upon local private enterprises and foreign enterprises. [Chart 3-10] India:
The private sector’s share in gross fixed capital formation is expanding, triggered by deregulation in 1991. [Chart 3-11]
China:
The share of non-public enterprises such as foreign enterprises and private-owned enterprises is rising in the mining & manufacturing and export sectors. [Chart 3-12]
However, economic deregulation is only part of the institutional foundation to underpin sustainable growth. More broadbased institutional measures are necessary for sustainable growth.
11
Chart 3-9 Changes in "Economic Freedom"
Chart 3-10 Russia’s gross fixed capital formation (%) 100
India
6
Foreign -owned 80
5
China
4
Private sector
60
Russia
Brazil
40
Local mixed ownership
20
Municipal
3
State-owned
1985
90
95
2000
03
Source: Gw artney and Law son, "Economic Freedom of the World: 2005 Annual Report," Fraser Institute, 2005.
Chart 3-11 India’s gross fixed capital formation
0 1993 95
100
60
80
50
30
Public sector
99 2000 01
02
03
State-owned enterprises, state-owned holdings companies
40
60
20
98
Chart 3-12 China’s industrial value-added output (by ownership) (%)
40
97
Source: Russian Statistics Agency, "Statistical Yearbook of Russia."
(%)
Private sector
96
Collectively-owned enterprises
Foreign enterprises
20
Stock companies
10
Private enterprises
0
0 1990 91 92 93 94 95 96 97 98 99 2000 01 02 03 (FY) Source: Ministry of Statistics & Programme Implementation.
1994
95
96
97
98
99
2000
01
02
03
Source: National Bureau of Statistics of China, "China Statistical Yearbook."
12
IV. BRICs long-term growth projections (1) Potential growth rate [Chart 4-1] Long-term growth projections in previous research [Chart 4-1] Goldman Sachs, "Dreaming with BRICs,” 2003/10; "How Solid are the BRICs?” 2005/12 Economic growth projection (1): growth accounting analysis based upon the Solow Model in which the production factors are labor, capital and total factor productivity (TFP). Assumes that the lower the per capita income level of a country, the faster the pace of TFP growth (the convergence hypothesis). Currency projection (2): assumes that the real effective exchange rate (to the US$) is equivalent to the difference in labor productivity growth compared with the US. Projection on the size of the BRICs economies on the basis of 1+2: TFP growth due to the convergence hypothesis is the main reason that the BRICs are getting richer and larger. However, there are counter arguments toward the validity of this hypothesis (do all poor countries enjoy high economic growth?)
Deutsche Bank Research, "Global Growth Centers 2020,” 2005/3 Forecasts GDP growth up to 2020 by an econometric model in which the working age population, investment, human capital and openness of trade are the explanatory variables. Does not adopt the convergence hypothesis.
Chart 4-1 BRICs economic growth forecast (2006-2020) (%) Brazil
Russia
India
China
Goldman Sachs
3.9
3.6
5.8
6.2
Deutsche Bank Research
2.8
(Less than 4%)
5.5
5.2
Note: Forecasts by Goldman Sachs are as of December 2005. capital (number of years of school attendance).
Deutsche Bank Research’s paper does not provide a forecast on Russia due to the lack of data on human
13
BRICs potential GDP growth (2006 - 2030): the High (India and China) and the Low (Brazil and Russia) Projections on potential GDP growth: the working age population is based upon UN World Population Prospects and other production factors are based upon averages from the 1990s onward (however, China’s investment ratio and TFP growth rate are assumed to be lower than the 1990s). Average economic growth rate: Brazil 2.7%, Russia 1.2%, India 5.4%, China 6.6% [Chart 4-2] China’s growth will slow down, India will enjoy high stable growth, Brazil will keep growing at a stable pace and prospects for Russia are uncertain (depends upon natural resource prices and whether Russia can raise its productivity growth by taking advantage of its high level of education). TFP and investment ratio are the key to further growth. Presuming that the convergence hypothesis holds, the rate of TFP growth would be high in all countries: Brazil 3.7%, Russia 3.4%, India 5.1% and China 4.3%. Furthermore, if the investment ratio of BRIs rises to the same level as China, the rate of GDP growth would rise 0.5-0.7% point. Even though China’s per capital income will rise to levels comparable to the developed countries, income levels in the remaining countries will remain at levels among developed countries.
Chart 4-2 BRICs real GDP growth rate (2006 - 2030 average) (%) Rate of economic growth (real)
Brazil Russia India China
2.7 1.2 5.4 6.6
Working age population
Physical capital
Human capital
Total factor productivity (TFP)
0.4 ( 1.0 ) -0.3 ( -0.8 ) 0.6 ( 1.4 ) 0.1 ( 0.1 )
0.8 ( 2.5 ) 0.6 ( 2.1 ) 1.6 ( 5.5 ) 2.3 ( 7.5 )
0.6 ( 2.0 ) 0.2 ( 0.5 ) 0.6 ( 2.1 ) 0.3 ( 0.8 )
1.0 ( 1.0 ) 0.8 ( 0.8 ) 2.5 ( 2.5 ) 4.0 ( 4.0 )
Note: The average rate of economic growth and contribution by each of the production factors (figures in parentheses indicate the rate of growth) during 2006 to 2030. Sources: World Bank, "World Development Indicators," United Nations, "World Population Prospects 2004," Barro and Lee Data, and others.
14
(2) Identifying the institutional foundations necessary for sustainable growth What are "good institutions" necessary for sustainable growth? There are common characteristics in the development process of developed countries (Angus Maddison). Productivity growth through technological progress [Chart 4-3] Accumulation of capital stock [Chart 4-4] Qualitative improvement of human capital [Chart 4-5] Chart 4-3 Labor productivity growth
Chart 4-4 Capital stock per employee (Thousand US$)
(%) 8
(%)
40
7
30
5
25
4
Japan
20
Germany
15
35
Japan
6
UK
20
3
US
US
UK
1
Germany 1870 -1913
1913 -1950
10
US
1950 -1973
Note: Average GDP per labor hour during each of the time periods. Source: Angus Maddison, "Monitoring the World Economy 1820-1992."
Germany
10 UK
15
2 0 1820 -1870
Chart 4-5 Schooling - average no. of years
5
Japan
5 1973 -1992
0 1820 1870 1890 1913 1950 1973 1992 Note: Based on US$ as of 1990. Source: Angus Maddison, "Monitoring the World Economy 1820-1992."
0 1820
1870
1913
1950
1973
1992
Note: Average of those in the 15-64 age bracket. Source: Angus Maddison, "Monitoring the World Economy 1820-1992."
"Good institutions” are necessary for the accumulation of physical and human capital accompanying technological innovation and, in the long run, to achieve long-term economic growth. 1. Institutions to nurture “technological innovation”
Quality of research institutions, R&D strategies of corporations and universities, protection of intellectual property rights and others
2. Institutions to nurture “human capital”
Educational and healthcare measures to raise the rate of adult literacy and average life expectancy
3. Institutions for construction of “physical infrastructure” State of infrastructure development and the efficiency of infrastructure management 4. Institutions to protect “private property rights”
Improvement of laws regarding private property rights, its appropriate application, judicial independence
5. Institutions to build “social cohesiveness”
“Narrowness” of income gap, political and social stability, freedom of speech, accountability and others.
6. Institutions to upgrade “governance”
Efficiency of government sector, existence/nonexistence of corruption and others
Source: Naoko Ishii, "Choki Keizai Hatten no Jissho Kenkyu (Empirical research on long-term economic development) 2003."
15
Institutional development among the BRICs: human capital, infrastructure, protection of private property and economic freedom There is a strong correlation between institutional development and income levels. Furthermore, countries where institutions are relatively developed in comparison to income levels tend to achieve high growth (IADB). Notable features of the BRICs’ institutional development are as follows [Chart 4-6]: Human capital: Brazil faces serious problems regarding education. Even though Russia’s educational standards are high on an absolute basis, it is not fully utilized. Infrastructure: Brazil and Russia are lagging in infrastructure development, relative to their income levels. Although India’s infrastructure development is relatively favorable in relation to its level of income, the absolute level of infrastructure development is still low, and frequently cited as an impediment to business. Protection of property rights:the level of protection is low in Russia and China. Economic freedom: with the exception of India, the levels of freedom are still low even in relative terms to income.
Chart 4-6 Institutional development among the BRICs 7 6
Russia
5 China
China
10 8 6
Brazil 4
5
Brazil Property rights
12
5
6
India
4 Russia 3
4
India
3 2 China Russia
Brazil India
2
0
5
10
15 20 25 30 Per capita GDP (2003)
35
40
3 Brazil 2
India China
0
5
10
15
20
25
30
35
40
(Thousand US$)
Russia
1
0
1 Per capita GDP (2003)
(Thousand US$)
4
1
2
0
Index of economic freedom
14
Infrastructure
Average years of schooling (2000)
(Yrs)
0
5
10
15
20
25
30
35
40
Per capita GDP (2003) (Thousand US$)
0
5
10
15
20
25
30
35
40
Per capita GDP (2003) (Thousand US$)
Sources: Barro and Lee, World Economic Forum(2005), Global Competitiveness Report 2005-2006, Miles, Feulner and O'Grady(2005), 2005 Index of Economic Freedom, The Heritage Foundation, 2005, IMF(2005), World Economic Outlook Database, Sept. 2005
16
Institutional development among the BRICs: technological innovation With the exception of Russia, the BRICs possess high potential regarding technological innovation relative to their income levels [Chart 4-7]. However, there is still a considerable gap in absolute terms with developed countries. Technological readiness: India is commended for its technological capability. However, judging from the spread of IT, there is still a large gap in technological readiness among corporate enterprises and workers. Business sophistication: Relative to their income levels, India and Brazil receive high appraisal for the quantity, quality and marketing capabilities of local parts industries. However, the competitiveness of the BRICs stems mainly from price competitiveness at the moment. Innovation: In relation to their income levels, all the BRICs countries receive more or less high appraisal for their quality of research institutions, enthusiasm for R & D investment and business-academia collaboration. Even so, the number of patents acquisitions is still low, revealing a gap with the developed countries [Chart 4-8].
Chart 4-7 Institutional development among the BRICs (2)
(Acquisitions/1 million persons)
6
7
6 Brazil
Brazil
6
India China
4
3 Russia 2
India
Brazil
5
4
4
3
Russia
Russia 1
2 0
5
10
15
20
25
30
35
40
Per capita GDP (2003) (Thousand US$)
2 0
5
10
15
20
25
30
35
40
Country /Region
No. of patent acquisitions
China
5 China
3
Ranking
India
Innovation
Business sophistication
5 Technological readiness
Chart 4-8 US patent acquisitions
0
Per capita GDP (2003) (Thousand US$)
Sources: World Economic Forum(2005), Global Competitiveness Report 2005-2006, World Economic Outlook Database, Sept. 2005
5
10
15
20
25
30
35
40
Per capita GDP (2003) (Thousand US$)
1
US
283.7
2
Japan
276.6
3
Taiwan
263.9
4
Switzerland
177.4
5
Finland
176.5
39
Russia
1.2
50
Brazil
0.6
56
India
0.3
58
China
0.3
Note: 2004. Source: World Economic Forum (2005), "Global Competitiveness Report 2005-2006."
17
Institutional development among the BRICs: quality of "governance" In absolute terms, the quality of "governance" among the BRICs is not high [Charts 4-9, 10]. Relative to its level of income, Russia faces considerable challenges. Brazil: the quality of "governance" is commensurate to its income level. In absolute terms, it is equivalent to the global average. Russia: the quality of "governance" is low both in relative terms to income and in absolute terms. India: albeit low in absolute terms, it guarantees the freedom of speech despite being a low-income country. China: ranks considerably lower than other countries having the same level of income.
Chart 4-9 Comprehensive assessment of the quality of "governance" Aggregate governance indicator
2
1
Brazil India
0 Russia
-1 China -2 0
5
10
15
20
25
Per capita GDP (2003)
30
35
40
(Thousand US$)
Sources: Kaufmann et. al. (2005), "Governance Matters IV," World Economic Outlook Database, Sept. 2005
Chart 4-10 Constituent factors of the quality of "governance" and its assessment Brazil
Russia
India
China
Global average
Indicators
Absolute level
Government effectiveness
0.02
0.33
- 0.21
- 0.36
- 0.04
0.99
0.11
0.92
0.03
- 0.13
0.24
- 0.85
- 1.15
- 0.81
- 0.40
- 0.07
0.62
- 0.14
Rule of law
- 0.21
0.06
- 0.70
- 1.17
- 0.09
1.10
- 0.47
- 0.03
- 0.06
Control of corruption
- 0.15
0.12
- 0.72
- 1.20
- 0.31
0.60
- 0.51
-0.13
- 0.03
Regulatory quality
0.19
0.52
- 0.51
- 0.76
- 0.59
- 0.17
- 0.45
- 0.20
0.01
Voice and accountability
0.34
0.71
- 0.81
- 0.91
0.27
1.00
- 1.54
- 1.53
- 0.08
Political stability
Gap with theoretical level Evaluation
Absolute level
Gap with theoretical level Evaluation
Absolute level
Gap with theoretical level Evaluation
Absolute level
Gap with theoretical level Evaluation
Note: The "gap with theoretical level”= gap between theoretical figure (derived by regression of the absolute value and per capita GDP in 2003 (based upon PPP) and the absolute level, divided by the standard error. Gaps larger than and including 0.5 are evaluated as " ”, gaps less than 0.5 are evaluated as "x”. The "global average” is the average of the absolute levels of 141 countries and regions of the world. Sources: Kaufmann et. al. (2005), "Governance Matters IV," World Economic Outlook Database, Sept. 2005.
18
(3) Conditions for sustainable development Further institutional improvement is the key to sustainable development According to the IMF, countries achieving success in the following tasks tend to succeed in institutional reform: (1) the elimination of vested interests by opening markets and guaranteeing freedom of the press, and (2) the creation of human resources capable of institutional reform by raising the level of education. India ranks relatively low in terms of how open its markets are. Russia and China face serious problems regarding the freedom of press [Chart 4-11]. In terms of education, Brazil ranks low both in absolute and relative terms to its income level. The absolute level of education is low in both China and India. Chart 4-11 BRICs trade barriers (2004) (%)
Country
Brazil
Russia
India
China
100.0
-
73.8
100.0
Tariff concession rate
31.4
-
46.1
10.0
Priority rate of duty
13.2
10.4
28.3
9.8
8.0
8.7
28.0
6.0
38.0
8.4
92.4
16.0
3.2
1.5
Concession rate
Simple average tariff rate
Weighted average tariff rate Share of items with tariff rates above or equivalent to 15% Effect of non-tariff barriers (converted to tariff rates)
2.4
-
Note: Figures on Russia are as of 2002. "Effect of non-tariff barriers” are estimates as of 2000. Source: The World Bank (2005), "World Development Indicators."
19
Closing the income gap and resolving poverty Gaping Income disparities require rectification in Brazil and China [Chart 4-12]. Although India does not have such a large income gap, it has a high poverty ratio in terms of global standards [Chart 413]. The need to improve and raise the efficiency of social security systems. In China, there is a significant lag in social security system development in rural areas. The rate of social security coverage is low even in urban areas. Although social security expenditures are so large in Brazil that they are a cause of budget rigidity, large regional and occupational disparities are serving as impediments to concrete measures (such as medical care). Chart 4-12 The Gini coefficient
Chart 4-13 Poverty ratio Brazil
Gini Coefficient
Percentage of population with incomes or expenditures less than or equivalent to US$1 per day
Russia
Brazil
0.6
8.2 34.7
India China
16.6
China
0.4
India
0.2
7.5
Russia Russia
Percentage of population with incomes or expenditures less than or equivalent to US$2 per day
22.4
Brazil
79.9
India 46.7
China 0.0 1
10
100
1,000
10,000
100,000
Per capita GDP (real, US$-denominated, 2000 basis) Source: The World Bank, "World Development Indicators 2005."
0
10 20 30 40 50 60 70 80 90 100 (%)
Note: Brazil (income as of 2001), China (expenditures as of 2001), India (expenditures as of 1999) and Russia (expenditures as of 2002). Sources: The World Bank (2005), "World Development Indicators."
20