Community Sentiment on Environmental Topics in Social Networks Borut Sluban∗§ , Jasmina Smailovi´c∗† , Matjaˇz Jurˇsiˇc∗ , Igor Mozetiˇc∗ and Stefano Battiston‡ ∗
Department of Knowledge Technologies, Joˇzef Stefan Institute, Ljubljana, Slovenia † Joˇzef Stefan International Postgraduate School, Ljubljana, Slovenia ‡ Department of Banking and Finance, University of Zurich, Zurich, Switzerland § E-mail:
[email protected]
Abstract—We monitor social media, Twitter in particular, on a broad range of environmental issues such as climate change, green energy, sustainable development, climate policy targets. We analyze the social network of retweets about specific issues and we identify the influential users. We then characterize influential communities based on the prevalence of discussion topics in the tweet texts. As a novel and important aspect of our research, we also classify communities based on the prevalent sentiment with respect to the various discussion topics. We find differences among the major communities in their sentiment leanings towards various environmental issues.
I. I NTRODUCTION Environmental and sustainability issues are among the major societal concerns today. The formulation of environmental policies is often the result of the interaction among antagonistic interest groups including policy makers (governments and international organizations), advocacy groups representing the interest of specific industry sectors, and civic activists groups. The motivation for this research is to contribute to a better understanding of the dynamics of advocacy and activism around policy issues. We expect that the results will help policy makers in monitoring the response of various interest groups to the proposed regulations and policy targets. The explosive growth of social media and user generated contents on the Web provides a potentially relevant and rich source of data. This work is based on data from Twitter1 , a social networking and micro blogging service with over 270 million monthly active users, generating over 500 million “tweets” per day. We collect a broad range of tweets related to the environmental issues and address the following research questions: • Can one identify influential communities and environmental topics of interest? • Are there differences in their leanings towards various environmental topics? Preliminary results indicate that there are observable differences in sentiment leanings towards various environmental issues between major communities. There are several aspects of Twitter data analysis that are relevant for this research. On the one hand, Twitter is a social network, and several types of networks can be constructed 1 http://www.twitter.com/
from the data, e.g., followers, mention, or retweet networks. Network analysis algorithms then yield interesting network properties, such as communities, modularity, various centralities, etc. On the other hand, Twitter data can also be analyzed for its contents, by applying text mining and sentiment analysis algorithms. A novelty of our research is that we combine both types of analysis. We detect influential communities, identify discussion topics and assign sentiment of the communities towards selected topics. There are three different ways that users on Twitter interact: 1) a user follows posts of other users, 2) a user can respond to other user’s tweets by mentioning them, and 3) a user can forward interesting tweets by retweeting them. Based on these three interaction types, Cha et al. [1] define three measures of influence of the user on Twitter: indegree influence (the number of followers, indicating the size of his audience), mention influence (the number of mentions of the user, indicating his ability to engage others in conversation), and retweet influence (the number of retweets, indicating the ability of the user to write content of interest to be forwarded to others). They find that mention and retweet influence are correlated, but that indegree alone reveals little about the user’s actual influence. This is also known as the million follower fallacy [2]. Instead of the number of followers, they show that it is more influential to have an active audience who mentions or retweets the user. Suh et al. [3] analyze factors which have a positive impact on the number of retweets: URLs, hashtags, the number of followers and followees, the age of the account, but not the number of past tweets. Bakshy et al. [4] quantify the influence on Twitter by tracking the diffusion of URLs through retweet cascades. They find that the longest retweet cascades tend to be generated by the most influential users in the past. Closely related to our research is the work by Conover et al. [5], albeit applied to the problem of political polarization. They construct both, retweet and mention networks from political tweets and apply community detection. It turns out that the retweet network exhibits clear community segregation (to the left- and right-leaning users), while the mention network is dominated by a single community. In [6] they compare the predictive accuracy of the community-based model to two contents-based (full text tweets and hashtags-only) models. The community-based model constructed from the retweet
II. M ETHODOLOGY: D ISCOVERING COMMUNITY INTERESTS AND THEIR SENTIMENT
The process of identifying community interests and their leanings consists of three steps. First, the network of users retweeting each other is constructed and the densely connected communities are detected. Second, the content published by these communities is analyzed to reveal the communities’ interests, and finally, sentiment analysis is performed to asses the sentiment leaning of the communities with respect to different topics of interest.
a retweet network, connecting users who are in a retweet relation, i.e., an undirected edge between two users indicates either one user retweeted the other or vice versa. The network is constructed on the basis of 15,255,193 tweets about environmental topics, acquired between January 1, 2014 and June 30, 2014. We observe 2,160,358 users who are engaged in 4,629,104 retweet relations. The degrees of the users in the network is presented in Figure 1. 10,000,000 1215
1 1 1 1 100,000 1 1 10,000 1 14475 1,000 1 14247 1 13341 100 1 13329 1 13230 10 1 13091 1 13066 1 1 12682 1,000 10,000 100,000 11 10 100 10173 1 Degree 10008 1 9881 1 Fig. 1. Degree distribution of Twitter users in the retweet network 9551 1 9128 1 8881 largest 1 part of the network consists of one large The 8762 1 connected component of more than 1.9 million users, the 8476 1 rest8342 are components of size smaller than 250 users. In the 1 8035 component 1 largest we want to find groups of users that share 1 the7852 same views on environmental topics. Since retweeting 7498 1 can7471 be considered as expressing agreement on the published 1 content, network provides the connections between 7303 the retweet 1 7219 who agree 1 users on a certain topic. We apply a standard 7143 1 community detection algorithm, the Louvain method [13], 7136 1 to 7009 our retweet network in order to obtain groups of users 1 6952 1 share each other’s content, inferred from the who commonly 6931 1 network structure. The method partitions the network nodes in 6707 1 a way that maximizes the network’s modularity. Modularity is 6596 1 a measure of 1community density in networks. It measures the 6474 6380 1 fraction of edges falling within groups of a given network 6367 1 partitioning as compared to the expected fraction of edges 6240 1 in 6011 these groups, given a random distribution of links in the 1 5974 network [14].1 5952 1 Furthermore, 5909 1 we propose an approach to identify the most 5806 1 influential users in the network, i.e., users whose content is 1,000,000
Number of nodes
network clearly outperforms the contents-based models (with the accuracy of 95% vs. 91%). The above research indicates that the retweet influence seems the most appropriate measure of influence on Twitter, and that community detection in the retweet network will likely yield the most influential communities. However, in the environmental domain, the community segregation is not as clear as in the political domain. We therefore characterize communities not only by their influential members, but also by their prevalent discussion topics and sentiment. Sentiment analysis has been applied to Twitter in several domains [7], most notably for stock market predictions [8], and in political elections. There has been some controversy whether Twitter analysis can be used to predict the outcome of elections — Gayo-Avello gives a survey of various studies [9]. We have successfully applied Twitter sentiment analysis to monitor Slovenian presidential election in 2012, and Bulgarian parliamentary elections in 2013 [10]. Most of the other approaches are based on tweet volume or simple sentiment analysis by counting positive and negative sentiment words in tweets. In contrast, we employ supervised machine learning, the SVM classification in particular [11]. The training data comes either from manually annotated tweets (which are problem-specific and of high quality, but expensive in terms of resources needed), or from generic, smiley-based tweets [12] (which are of lower quality, but very extensive). In this study, the later data was used for training, but we plan to proceed with manual, environment-specific sentiment annotation in the future. The paper is organized as follows. In Section II we describe the Twitter data acquired, and construction of the retweet network. We apply a community detection algorithm and define the Twitter user and community influence measures. We proceed with standard text mining approach to identify topics discussed by the major communities. Next we perform a sentiment analysis, by applying a SVM classifier to tweets of different communities. Section III describes the results. We identify categories of influential communities (e.g., environmental activists, sceptics, celebrities, media) and their sentiment leaning towards different topics. We conclude with plans for future work.
apparently approved and shared the most. Let the retweet network be represented as a directed graph G, with edges E(G). A directed edge eu,v from the user u to the user v indicates that contents of the user u have been retweeted by the user v. Let w(eu,v ) be the weight of the edge eu,v indicating the number of times that the user v retweeted the contents of the user u. Then user influence I(u) is defined as
A. Network construction and structure We explore which Twitter users share similar content on environmental topics. To model this phenomenon we construct
I(u) =
X eu,v ∈E(G)
w(eu,v )
(1)
B. Content identification The retweet relation can be considered as the agreement between users on the published content. Hence the retweet network reveals which users support similar interests, without looking into the actual content. On the other hand, to identify the content and to see what are different groups of users talking about we adopted a standard text mining approach as follows. 1) For each group of users gi , i ∈ {1, . . . , N }, create a document di that aggregates all the content which the users of the group gi have published. 2) The vocabulary (i.e. the set of terms) used by groups {g1 , . . . , gN } is obtained from the documents {d1 , . . . , dN }. Term frequency T Fi (t) denotes the number of appearances of a term t in a document di . 3) For each term t from the vocabulary, document frequency DF (t) is the number of documents in which t appears. 4) For each of the documents {d1 , . . . , dN } construct a bag of words (BoW) vector where each term value in the vector is the TFiDF value of the term t from the vocabulary: T F iDFi (t) = T Fi (t) · log
N DF (t)
(2)
Term frequency-inverse document frequency (TFiDF) is a standard and widely used measure of importance of a term t to a document in a collection of documents [15]. We use this adopted text mining approach to identify the terms that are the most distinctive and therefore the most characteristic for the content tweeted by different groups of users. More specifically, we use the detected retweet communities as the groups of users. Next, we employ the above procedure to summarize and represent the most characteristic topics in the content of each community. Such content identification and representation is done by displaying only the selected number of the highest T F iDF ranked terms from a BoW vector constructed for a selected community. In this way, we are able to get a readable and reliable overview of the specific interests and topics discussed in the observed communities. C. Sentiment analysis In order to measure the collective attitude of a Twitter community towards a certain topic, the first step is to measure the sentiment of each individual tweet posted by the community. To perform Twitter sentiment analysis, we construct a sentiment classifier by employing the Support Vector Machine (SVM) algorithm [11], and in particular its SVMperf [16]–[18] implementation. The training dataset consists of 1.6 million positively and negatively labeled tweets obtained and prepared by Stanford University [12]2 . The labeling of the dataset was performed based on the presence of positive (“:)”, “:-)”, “: )”, “:D” or “=)”) or negative (“:(”, “:-(” and “: (”) emoticons in tweets, which were then removed from the dataset. A binary 2 The
dataset was obtained from “For Academics” section, at http://help. sentiment140.com/for-students.
SVM classifier is then trained from the other tweet features. Although such approach does not provide the highest labeling quality, it is a reasonable and inexpensive substitute for manual tweet labeling [19]. The training of the sentiment classifier is based only on the positive and negative tweets. However, the classification allows for three categories: positive, negative, and neutral as well. A tweet is classified as positive (negative) if its distance from the SVM hyperplane is higher than the average distance of positive (negative, respectively) training examples from the hyperplane. Otherwise, i.e., if it is too close to the hyperplane, it is considered neutral. Similar approaches to adapting the binary SVM classifier to the 3-class setting were already applied in our previous studies [19], [20]. Twitter contents data has to be adequately preprocessed. Standard preprocessing [21] includes tokenization, stemming, unigram and bigram construction, removing terms which do not appear at least twice in the corpus, and eventually construction of term frequency (TF) feature vectors.3 In addition, Twitter-specific preprocessing [7], [12], [19] transforms usernames, hashtags, and collapses repetitive letters. The sentiment of different communities regarding a specific topic is calculated as follows. First, for each community the tweets posted by its users are selected. Second, the sentiment of each tweet is determined and weighted by its retweet count. Third, the weighted negative and positive sentiment of tweets is aggregated for each user and summed over all users in the community. Finally, the leaning of a community towards a specific topic is computed as the polarity of the aggregated weighted sentiment multiplied by the ratio of sentiment carrying tweets (subjectivity) of the respective community. The polarity and subjectivity measures are adapted from [22]. The pseudo-code for community sentiment computation is presented in Algorithm 1. III. R ESULTS In the retweet network of 2.1 million users we detect 103,538 communities. Their size distribution is presented in Figure 2. We focus on the 31 largest communities with more than 10,000 users each. We find that these communities could roughly be classified into seven categories based on their most important users and contents of their tweets. We measure the user importance by their influence I on the other users in terms of their cumulative retweet count, as described in Section II-A by Equation 1. Table I presents the community categories and examples of the most influential users in these categories. The community categorization reveals that for our further investigations we can ignore certain categories of communities. First, in the ‘Humor’ communities the presence of an actual leaning or sentiment towards a certain topic is for one questionable (every topic can be made fun of using positive or negative words), and for two, it is hard to automatically identify the correct polarity due to frequent use of irony and 3 The approach to feature vector construction was implemented using the LATINO (Link Analysis and Text Mining Toolbox) software library, available at http://source.ijs.si/mgrcar/latino.
Algorithm 1 Computing community sentiment Require: C : community, TS : sentiment annotated tweets, ¯ P : avg. distance of positive training examples, D ¯ N : avg. distance of negative training examples D function C OMMUNITY S ENTIMENT (C, TS ): pos = 0 neg = 0 all = 0 for user in C.users do userT weets = TS .byUser(user) for tw in userT weets do ¯ P then if tw.sentiment > D pos += tw.sentiment × tw.retweetCount ¯ N then else if tw.sentiment < D neg += tw.sentiment × tw.retweetCount end if end for all += |userT weets| end for polarity = pos−neg pos+neg subjectivity = pos+neg all return polarity × subjectivity end function 100,000 10,000
Communities
1,000 100 10 1 0.1 0.01 0.001 0.0001 0.00001 0.000001 1
10
100
1,000
10,000
100,000
1,000,000
Size Fig. 2. Distribution of community sizes using logarithmic binning, as described in [23].
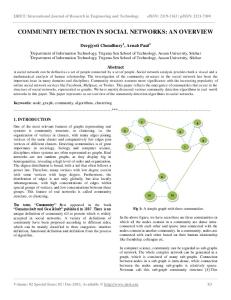
sarcasm. Second, the ‘Facts’ communities usually objectively convey their content without any sentiment carrying vocabulary. We also ignore two smaller communities in the category ‘Other’ that we are unable to strictly categorize. Among the remaining communities we select seven communities that contain the largest number of unique tweets, for meaningful content identification and sentiment analysis. The selection includes three communities from the ‘Environmental’ category (labeled as ‘Env 1’, ‘Env 2’, ‘Env 3’), two from ‘News’ (‘News 1’, ‘News 2’), one ‘Celebrities’ community (‘Celebrity’) and the ‘Sceptics’ community (‘Sceptic’). The network of these seven communities is presented in Figure 3.
Category
Count
Includes
Influential users
Environmental
6
activists, organizations, green/eco news
ClimateReality, Climateprogress, Jackthelad1947, Greenpeace
Sceptics
1
republicans, lobbyists
realDonaldThrump, JunkScience, SteveSGoddard
Government
1
US government, president, ministers
BarackObama, WhiteHouse, algore
Celebrities
3
actors, musicians, athletes
iansomerhalder, LeoDiCaprio, MarkRuffalo
Facts
6
popular science, science news, pics
Factsionary, UberFacts, NASA
News
6
news agencies, media
guardian, CBCNews, BBCWorld, nytimes
Humor
6
joke websites, commentators, comedians
TheTweetOfGod, 9GAG, damnitstrue
Other
2
miscellaneous
-
TABLE I C OMMUNITY CATEGORIES AND THEIR MOST INFLUENTIAL USERS .
Each community is represented with its own color and the size of the nodes is proportional to the user’s influence. The presented network layout shows a relatively clear segregation of most of the communities. We analyze the content tweeted by a community in terms of (i) hashtags and (ii) plain text. Hashtags can represent entities in the tweet and/or user-inserted labels of a tweet, indicating the topic or broader context of the tweet. Content analysis in terms of hashtags, using the approach presented in Section II-B, is therefore expected to show the characteristic entities and topics of interest in a selected community. On the other hand, plain text analysis is more appropriate for identification of actions, attitude and phrases that are most distinctive for a particular community. The results of content analysis are presented in Table II. The most characteristic content of each community, as shown by the results in Table II, reasonably distinguishes the communities of different categories. The hashtag content analysis supports the membership of the communities with the most influential users ‘ClimateReality’ and ‘climateprogress’ in the ‘Environmental’ category, therefore from now on labeled by ‘Env 1’ and ‘Env 2’, respectively. It reveals that the users retweeting ‘realDonaldTrump’ belong to the ‘Sceptic’ community, and those retweeting ‘iansomerhalder’ to the ‘Celebrity’ community. For the ‘News 1’ community (the ‘CBCNews’ user) the hashtags analysis shows interest in Canadian political and environmental issues. For the ‘Env 3’ community (the ‘Jackthelad1947’ user), Australian political and environmental topics are important. For the ‘News 2’ community (the ‘guardian’ user) a subsequent content investigation of the tags reveals news coverage on Jamaican plans to “lead the
Fig. 3. Subgraph of the retweet network induced on seven selected communities. Only users with influence larger than 100 retweets are displayed. The size of the nodes is proportional to the user influence and individual communities are distinguished by color.
Community Env 1 (ClimateReality)
Env 2 (climateprogess)
News 1 (guardian)
Sceptic (realDonaldTrump)
News 2 (CBCNews)
Env 3 (Jackthelad1947)
Celebrity (iansomerhalder)
Users
Tweets
Content
246,667 389,275
#solar (0.24) #biomass (0.24) #energy (0.22) #renewableenergy (0.21) #renewable (0.17) #csr (0.16) #annemain (0.15) biomass heaters: (0.20) heaters: renewable (0.18) albans mp st... (0.09) criticised st albans (0.06) biomass plant (0.06)
172,619 320,832
#fracking (0.26) #environment (0.23) #uniteblue (0.19) #bartonmoss (0.17) #frackoff (0.15) #ohio (0.14) #climate (0.14) frick fracking (0.20) barton moss (0.07) stop denying science (0.07) ed 97% scientists (0.07) real manmade. ipcc (0.07)
166,679
17,162
#jamaica (0.57) #caribbeantech (0.48) #phcblog (0.27) #caribbeanpolitics (0.17) #idb (0.14) #washington (0.13) generation electric power(0.12) let champion(0.12) blogs energy can(0.11) can improve ’s(0.11) ’s economic future(0.11)
100,462
94,021
#tcot (0.45) #teaparty (0.33) #pjnet (0.30) #shale (0.25) #rednationrising (0.22) #ccot (0.20) #tlot (0.19) #agenda21 (0.18) conducts dangerous human (0.09) global warming fraud (0.08) la dr. mengele (0.08) human experiments:a la (0.08)
48,401
25,722
#cdnpoli (0.35) #powerstorage (0.33) #bcpoli (0.30) #greentech (0.22) #energystorage (0.19) #vancouver (0.17) great big (0.23) top thought (0.23) energy efficiency job (0.14) edmonton ab (0.17) sustainability daily stories (0.10)
45,041
75,573
#auspol (0.71) #csg (0.38) #nswpol (0.26) #wapol (0.19) #qanda (0.18) #springst (0.12) #bentleyblockade (0.11) lnp (0.172) ret (0.12) aust (0.12) coal seam (0.10) palmer (0.10) abbott’s (0.08) qld (0.08) abbott climate (0.07)
43,455
10,720
#coalsucks (0.69) #isf (0.46) #beyondcoal (0.43) #yearsproject (0.24) #nofrackla (0.20) #isfcommcrew (0.08) warm idea solar(0.30) sun gives power(0.18) solar powered energy(0.17) power coal heated(0.17) fan wind power(0.14)
TABLE II S EVEN INFLUENTIAL COMMUNITIES ( WITH THE MOST INFLUENTIAL USERS IN PARENTHESIS ) SELECTED ON THE BASIS OF THE LARGEST NUMBER OF UNIQUE TWEETS . C OMMUNITY CONTENTS IS CHARACTERIZED IN TERMS OF HASHTAGS AND PLAIN TEXT ( WITH THE RESPECTIVE T F iDF VALUES IN PARENTHESIS ).
Celebrity
Env 3
News 2
Sceptic
News 1
Env 2
Env 1
Number of tweets
100,000 80,000 60,000 40,000 20,000 0
Topic Fig. 4. The number of tweets for each selected topic and for each of the observed communities. 4 http://news.investors.com/ibd-editorials/040414-696061-epa-conductspollution-experiments-on-humans.htm
The sentiment of a community towards a selected topic is computed from the tweets on that topic, tweeted by that particular community, as proposed in Section II-C, Algorithm 1. The results of the community sentiment analysis on different environmental topics are presented in Figure 5. Community leaning towards a specific topic is computed as the difference between the community sentiment on this topic and the community’s average sentiment in our dataset. In Figure 5 the topics of interest are in descending order from left to right by their average sentiment over all the communities.
Sentiment leaning
0.3
Env 1 News 2
Env 2 Env 3
News 1 Celebrity
Sceptic
0.2 0.1 0 -0.1 -0.2 -0.3 -0.4
Topic Fig. 5. Sentiment leaning of the seven communities towards different Env 3 News 2 Sceptic News 1 Env 2 Env 1 Celebrity environmental topics. 100,000
Number of tweets
Sentiment leaning
Caribbean in renewable energy”, which is detected by the T F iDF method as the most distinctive content. On the other hand, the results of the plain text analysis mostly show more specific topics that are shared in the observed communities. The top terms or phrases (n-grams) in the ‘Env 1’, ‘Env 2’, ‘News 1’ and ‘Celebrity’ communities, reflect their interest in the promotion of alternative, renewable and environmentally friendly energy sources, in contrast to the controversial energy supply solution provided by fracking. The two most distinctive topics that surface from the content of the ‘Sceptic’ community are “global warming fraud” and “conducts dangerous human experiments”. The former is related to the community’s skepticism regarding global warming, and the latter is about an article published by the “Investor’s Business Daily” newspaper4 that criticizes an allegedly harmful experiment by the Environmental protection agency (EPA). The plain text content results for the communities ‘News 2’ and ‘Env 3’ show less specific topics, with the main focus on Canadian and Australian environmental and energy policies. Finally, we investigate the sentiment leaning of the most content rich communities. In our dataset of 15 million environmental tweets, there are 1.6 million unique tweets. We label them by the SVM sentiment model, described in Section II-C, Env neutral 1 1 Only aSceptic as positive (1), (0),Envor2 negative News (−1). quarter News 2 Env 3 Celebrity of the 0.3unique tweets is labeled as subjective, i.e., non-neutral. Furthermore, among the sentiment carrying tweets, there is a 0.2 strong tendency towards positive sentiment, with 85% positive 0.1 vs. 15% negative tweets. 0 We analyze the sentiment leanings towards 14 selected -0.1 topics related to the environmental issues. The 1.6 million -0.2 tweets are filtered according to the following 14 topics (in -0.3 alphabetical order): climate change, CO2 , coal, fracking, gas, -0.4 global warming, nuclear (power, waist, etc.), oil, pollution, recycling, renewable (energy, sources, etc.), solar (energy), sustainability, and wind (power, energy, etc.). The volume of filtered tweets for each topic and for each of the observed Topic communities is presented in Figure 4.
80,000 60,000 The first
IV. D ISCUSSION
interesting finding is that the sentiment analysis is in accordance to the commonly accepted attitude towards 40,000 different environmental topics. Most of the communities show 20,000 leaning towards ‘renewable’, ‘sustainability’, ‘solar’, positive ‘recycling’, and negative towards ‘CO2 ’, ‘pollution’, and 0 ‘fracking’. Additionally, the sentiment of all the communities is below their averages for all topics from ‘nuclear’ until ‘fracking’, except for an outlier community that we examine separately. This gives an indication that the generic sentiment Topic model produces reasonable results. However, an evaluation and a comparison to a domain specific sentiment model is required to support such a claim. There are two notable exceptions: the ‘Sceptic’ and the ‘Celebrity’ communities. The ‘Sceptic’ community is the most segregated from the rest (see Figure 3), and its sentiment leanings are the most contrarian to other communities (see Figure 5). It is least in favor of the two most positive topics ‘renewable’ and ‘sustainability’, and most positive about the topics ‘nuclear’, ‘oil’, ‘gas’, and ‘fracking’. These results clearly indicate that the preferences of this community are diverging from the interests of the other communities. The ’Celebrity’ community is dominated by ‘iansomerhalder’, one of the most influential users overall (see Figure 3). Despite the high influence, the community produces very low number of tweets (less than 1% of all the unique tweets, see Table II). Its influence emerges from the large number of
retweets, due to the large number of followers of ’iansomerhalder’. This hints at the possibility to engage high profile celebrities, with the commitment to environmental issues, in promotion and spreading of influential contents. On the other hand, the analysis of the contents produced by the ‘Celebrity’ community is not very reliable due to the low volume of tweets. The extremely negative sentiment leaning towards the topics ‘solar’ and ‘wind’ is due to their frequent co-occurrence with conventional energy sources, where they are presented as contrasting examples of environmentally friendly alternatives. The ‘Celebrity’ community seems to be most in favor of the topics ‘renewable’ and ‘recycling’, and least in favor of the topics ‘oil’, ‘gas’, ‘CO2 ’, ‘pollution’, and ‘fracking’. These extremes can be explained by the use of most polarizing opinionated language in this community. V. C ONCLUSION The paper contributes to the research on complex networks in social media by combining a structural and a contentbased analysis of Twitter data. From structural properties of the retweet network, we identify influential users and communities. From the contents of their tweets, we characterize discussion topics and their sentiment. Sentiment of different communities shows perceivable differences in their leanings towards different topics. We have identified two communities that diverge from the rest: ‘Sceptic’ with the most different sentiment leanings then the other communities, and ‘Celebrity’ with a relatively low number of original tweets, but highly influential, with the potential to spread interesting information. One of the weaknesses of this first experiment is the use of generic, domain-independent sentiment training data. Our previous research in sentiment analysis of Twitter data in politics and stock market suggests that different vocabularies are used in different domains, and that high quality expert labeling of domain-specific tweets yields better sentiment models. We have all the infrastructure to support the selection and labeling of tweets in place, and we plan to engage environmental experts to produce a considerable set (over 20.000) of labeled tweets to be used to train the sentiment model. It will be interesting to observe if a domain-specific sentiment model produces considerably different sentiment assignments than the generic model, used for experiments described in this paper. ACKNOWLEDGMENT This work was supported in part by the European Commission under the FP7 projects SIMPOL (Financial Systems SIMulation and POLicy Modelling, grant no. 610704) and MULTIPLEX (Foundational Research on MULTIlevel comPLEX networks and systems, grant no. 317532), by the Slovenian Research Agency programme Knowledge Technologies (grant no. P2-103), and Ad Futura Programme of the Slovenian Human Resources and Scholarship Fund (to J.S.). ˇ We thank Miha Grˇcar and Martin Znidarˇ siˇc for their help in the construction of sentiment classifiers and tweet preprocessing.
R EFERENCES [1] M. Cha, H. Haddadi, F. Benevenuto, and P. K. Gummadi, “Measuring user influence in twitter: The million follower fallacy,” ICWSM, vol. 10, pp. 10–17, 2010. [2] A. Avnit, “The million followers fallacy,” Pravda Media Group, 2009. [3] B. Suh, L. Hong, P. Pirolli, and E. H. Chi, “Want to be retweeted? large scale analytics on factors impacting retweet in twitter network,” in 2010 IEEE Second Intl. Conf. on Social Computing. IEEE, 2010, pp. 177–184. [4] E. Bakshy, J. M. Hofman, W. A. Mason, and D. J. Watts, “Everyone’s an influencer: quantifying influence on twitter,” in Proc. Fourth ACM Intl. Conf. on Web Search and Data Mining. ACM, 2011, pp. 65–74. [5] M. Conover, J. Ratkiewicz, M. Francisco, B. Gonc¸alves, F. Menczer, and A. Flammini, “Political polarization on twitter,” in Proc. Fifth Intl. Conf. on Weblogs and Social Media (ICWSM), 2011. [6] M. D. Conover, B. Gonc¸alves, J. Ratkiewicz, A. Flammini, and F. Menczer, “Predicting the political alignment of twitter users,” in Privacy, security, risk and trust, 2011 IEEE Third Intl. Conf. on Social Computing. IEEE, 2011, pp. 192–199. [7] A. Agarwal, B. Xie, I. Vovsha, O. Rambow, and R. Passonneau, “Sentiment analysis of twitter data,” in Proceedings of the Workshop on Languages in Social Media. Association for Computational Linguistics, 2011, pp. 30–38. [8] J. Bollen, H. Mao, and X. Zeng, “Twitter mood predicts the stock market,” Journal of Computational Science, vol. 2, no. 1, pp. 1–8, 2011. [9] D. Gayo-Avello, “A meta-analysis of state-of-the-art electoral prediction from twitter data,” Social Science Computer Review, 2013. ˇ [10] J. Smailovi´c, J. Kranjc, M. Jurˇsiˇc, M. Grˇcar, M. Gaˇcnik, M. Znidarˇ siˇc, and I. Mozetiˇc, “Monitoring the twitter sentiment during the bulgarian elections,” 2014, submitted to Special Issue on Discovery Science in Information Sciences journal. [11] V. Vapnik, The Nature of Statistical Learning Theory. Springer, 1995. [12] A. Go, R. Bhayani, and L. Huang, “Twitter sentiment classification using distant supervision,” CS224N Project Report, Stanford, pp. 1–12, 2009. [13] V. D. Blondel, J.-L. Guillaume, R. Lambiotte, and E. Lefebvre, “Fast unfolding of communities in large networks,” Journal of Statistical Mechanics: Theory and Experiment, vol. 2008, no. 10, p. P10008, 2008. [14] M. E. J. Newman, “Modularity and community structure in networks,” Proceedings of the National Academy of Sciences of the USA, vol. 103, no. 23, pp. 8577–8582, 2006. [15] R. Feldman and J. Sanger, Text Mining Handbook: Advanced Approaches in Analyzing Unstructured Data. New York, NY, USA: Cambridge University Press, 2006. [16] T. Joachims, “A support vector method for multivariate performance measures,” in Proceedings of the 22nd International Conference on Machine learning. ACM, 2005, pp. 377–384. [17] ——, “Training linear SVMs in linear time,” in Proceedings of the 12th ACM SIGKDD international conference on Knowledge discovery and data mining. ACM, 2006, pp. 217–226. [18] T. Joachims and C.-N. J. Yu, “Sparse kernel svms via cutting-plane training,” Machine Learning, vol. 76, no. 2-3, pp. 179–193, 2009. ˇ [19] J. Smailovi´c, M. Grˇcar, N. Lavraˇc, and M. Znidarˇ siˇc, “Stream-based active learning for sentiment analysis in the financial domain,” Information Sciences, vol. 285, pp. 181–203, 2014. [20] ——, “Predictive sentiment analysis of tweets: A stock market application,” in Human-Computer Interaction and Knowledge Discovery in Complex, Unstructured, Big Data. Springer, 2013, pp. 77–88. [21] R. Feldman and J. Sanger, The text mining handbook: advanced approaches in analyzing unstructured data. Cambridge University Press, 2007. [22] W. Zhang and S. Skiena, “Trading strategies to exploit blog and news sentiment,” in Proc. Fourth Intl. AAAI Conf. on Weblogs and Social Media (ICWSM), 2010, pp. 375–378. [23] M. E. J. Newman, “Power laws, Pareto distributions and Zipf’s law,” Contemporary Physics, vol. 46, no. 5, pp. 323–351, 2005.