Commodity Research
Commodities Daily 17 October 2016
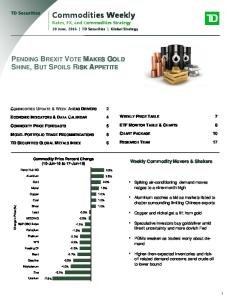
Most pronounced position reduction in gold for 10 years Energy: Brent appears to be stabilising at $52 per barrel, while WTI is hovering around the $50 per barrel mark. The 20% price increase since the end of September was driven largely by speculation. According to the CFTC’s statistics that were published on Friday, speculative net long positions in WTI climbed by an additional 31,500 to 254,400 contracts in the week to 11 October. This was the third pronounced weekly rise in a row, during that time net long positions increased by 126,000 contracts. At the same time, they find themselves at their highest level since May 2015. The data for Brent are likely to paint a similar picture at lunchtime today, though they already find themselves at a higher level and in the last reporting week were only a good 40,000 contracts below the record level achieved in the spring. Whether investors will stick to their guns will depend primarily on whether OPEC maintains the credibility of its announced production cuts. If there are growing doubts and investors jettison their long positions, this would generate significant selling pressure on oil prices. The higher oil prices are already having one visible side effect: drilling for (shale) oil in the US is worthwhile again. According to Baker Hughes, drilling activity climbed last week for the 15th time in the past 16 weeks. The oil rig count has increased by a good 100 since the end of June, thereby negating half of the decline since the beginning of the year again. This points to a trend reversal in US oil production – which could also prompt investors to sell their long positions. Precious metals: Gold is also trading at only a good $1,250 per troy ounce as the new week of trading gets underway. Admittedly, gold is finding support from moderate but continual ETF inflows: since the beginning of the month, holdings have been increased by 19 tons, which is more than in the whole of last month. However, gold is facing headwind on the one hand from the firm US dollar, which appreciated for a time to a 2½-month high against the euro this morning. On the other hand, rising stock markets and higher bond yields are keeping the gold price in check. The yields on ten-year US Treasuries have climbed to a 4½-month high, which makes gold less attractive as an alternative investment. As the CFTC’s statistics on the positioning of speculative market participants show, the slide in the gold price in early October, which saw it fall below several technically important thresholds, was driven by speculation to a major extent. In the week to 11 October, for instance, net long positions were slashed by a further 26%. At 148,800 contracts, they find themselves at their lowest level since the end of May. In the last two reporting weeks, net long positions were decimated by around 42% or 106,000 contracts – the most pronounced position reduction within the space of two weeks since the data series began ten years ago. We believe that this will ease the selling pressure from this side, however. What is more, because we assume that gold demand will pick up in Asia in the coming months, we expect the gold price to stabilise and then recover.
Speculative market positioning (net) 11-Oct
‘000 contracts
WTI
254.375
31.544
Henry Hub
139.175
21.465
Gasoline
36.632
5.815
Gold
148.793
-51.323
Silver
45.546
-18.961
Platinum
11.316
-6.031
Palladium
13.425
-0.894
Copper
12.893
5.805
Wheat
-137.243
17.953
Corn
-121.914
31.182
Soybeans
68.789
6.798
Cotton
53.195
-12.772
Coffee
36.849
-2.269
Cocoa
23.563
0.752
Sugar
250.826
-17.475
Source: CFTC, Bloomberg
Number of active US oil and gas rigs 14-Oct
Rig count weekly change
USA total
539
Oil
432
4
Gas
105
11
Horizontal
431
18
57
-4
Directional
51
1
Source: Baker Hughes, Bloomberg
280
1400
240
1350
Eugen Weinberg
200
1300
+49 69 136 43417
[email protected]
160
1250
Analyst
120
1200
Carsten Fritsch
80
1150
+49 69 136 21006
[email protected]
40
1100
Analyst
0
1050
Barbara Lambrecht
1000 Apr-15
Jul-15
Oct-15
Jan-16
Apr-16
Net long positions of money managers ('000 contracts), ls
Jul-16
Oct-16
Gold (US$ per troy ounce), rs
Head of Commodity Research
+49 69 136 22295
[email protected]
Analyst Michaela Kuhl +49 69 136 29363
[email protected]
Source: CFTC, Bloomberg, Commerzbank Research
For important disclosure information please see page 6. research.commerzbank.com / Bloomberg: CBKR / Research APP available
15
Vertical
CHART OF THE DAY: Latest gold price fall driven largely by speculation
-40 Jan-15
Weekly change
Analyst Daniel Briesemann +49 69 136 29158
[email protected]
Commodity Research | Commodities Daily
Base metals: Metal prices are going in different directions as the week begins, and remain largely unchanged. Copper is trading at around the $4,700 per ton mark, aluminium costs $1,650 per ton and nickel is priced at a good $10,400 per ton. As the National Bureau of Statistics reported last Friday, producer prices in China climbed again in September for the first time since early 2012 (by +0.1% year-on-year). This is attributable first and foremost to the higher steel and coal prices sparked by the recovering real estate market. Our economists assume that the inflation dynamism will increase on both the producer side and the consumer side, which could limit the Chinese central bank’s scope for monetary policy action. Market participants will be focusing their attention this week on further economic data from China, such as the figure for third-quarter GDP. If this turns out to be positive, as Prime Minister Li Keqiang has already hinted, it will likely lend buoyancy to metal prices. According to the CFTC’s statistics, speculative market participants have displayed continued optimism towards copper of late, expanding their net long positions on the Comex in New York in the week to 11 October, too. At 12,900 contracts, net longs now find themselves at their highest level since the beginning of August, though this has done virtually nothing to boost the copper price. What is more, the price slide at the end of last week suggests that some net long positions have been reduced again in the meantime. Agriculturals: For the first time since the end of September, a pound of cotton costs more than 70 US cents again. What is more, cotton has increased by 5% in price since the middle of last week. The price rise was sparked by new US Department of Agriculture estimates of stocks in the US and worldwide. Cotton stocks in the US look set to rise to only 936,000 tons at the end of 2016/17 because of a lower than expected crop and higher exports. That’s 131,000 tons less than previously assumed. On a global level, the USDA downwardly revised ending stocks by a good 500,000 to 19 million tons. The lion’s share of this is attributable to China, where the stock estimate was lowered from a good 11 million to less than 10.5 million tons as compared to the previous month. The higher than anticipated sales from state reserves are making themselves felt here: this summer alone, China sold 2.5 million tons of cotton from its state reserves to domestic manufacturers. The government expects sales on a similar scale in the coming year, too. This is intended to plug the production deficit in China, which the USDA estimates at approx. 3 million tons in the 2016/17 crop year. Imports will not be nearly enough to fill the gap. As China’s National Development and Reform Commission announced last week, only imports of 894,000 tons of cotton will allowed at the low import tariff of 1% in 2017, too. A prohibitively high import tax is levied on imports above and beyond this level. Prices Energy 1) Brent Blend WTI Gasoline Gasoil Diesel Jet fuel Natural gas ($/mmBtu) Base metals 2) Aluminum Copper Lead Nickel Tin Zinc Precious metals 3) Gold Gold (€/oz) Silver Platinum Palladium Agriculturals 1) Wheat (LIFFE, €/t) Wheat CBOT Corn Soybeans Cotton Sugar Coffee Arabica Cocoa (LIFFE, £/t) Currencies 3) EUR/USD
2
Inventories current 52.0 50.4 500.0 461.3 461.3 468.8 3.29
1 day -0.2% -0.2% -0.2% -1.0% 0.1% -0.2% -1.7%
1 week -2.9% -2.6% -3.3% -3.4% -0.9% -0.1% -1.2%
1 month 12.8% 16.2% 7.1% 11.9% 14.6% 14.6% 9.8%
ytd 38% 35% 26% 38% 45% 32% 38%
Energy * Crude oil Gasoline Distillates Ethanol Crude oil Cushing Natural gas Gasoil (ARA) Gasoline (ARA)
1675 4675 1998 10485 19450 2258
-1.0% -0.8% 0.1% 0.5% -0.2% 0.8%
-2.3% -3.4% -4.9% -0.7% -3.2% -2.9%
4.8% -2.1% 3.1% 7.4% 1.9% 2.0%
10% 0% 11% 18% 34% 40%
1251.4 1140.4 17.4 935.0 646.5
-0.5% 0.2% -0.3% -0.2% 1.1%
-0.6% 0.9% -1.4% -2.7% -3.3%
-4.5% -2.9% -7.4% -7.8% -3.9%
18% 17% 25% 5% 15%
Base metals ** Aluminum LME Shanghai Copper LME COMEX Shanghai Lead LME Nickel LME Tin LME Zinc LME Shanghai
163.8 421.0 354.3 962.5 70.6 22.91 155.4 2268
1.6% 1.2% 1.4% 0.7% 1.8% 0.5% 1.8% 0.8%
4.3% 3.7% 3.0% 1.9% 5.4% -1.1% 3.1% -2.2%
2.8% 4.8% 5.6% 0.6% 4.6% 2.5% 4.4% 1.4%
-6% -14% -6% 8% 10% 61% 23% 0%
1.0972
-0.8%
-1.5%
-1.8%
1%
Precious metals *** Gold Silver Platinum Palladium
current 473958 225498 156972 19393 61334 3759 3039 651
1 day
-
1 week 1.0% -0.8% -2.3% -3.9% -2.1% 2.2% 0.6% 4.7%
1 month -1.4% -1.0% -0.7% -6.1% -3.3% 9.4% -11.7% -32.1%
1 year 9% 2% 6% 2% 13% 1% -19% -24%
2083250 84655 345800 71094 121439 189800 362478 3250 455650 165614
-0.3% -0.9% 0.1% 0.0% 0.5% -2.1% -0.1% -
-1.7% 1.1% -1.4% 0.7% 13.4% -0.5% 0.5% -5.0% -0.4% 4.6%
-3.9% -32.8% -0.9% 1.5% -15.5% 1.0% -1.2% -15.3% 2.5% -11.1%
-33% -71% 18% 66% -21% 25% -17% -27% -23% 0%
65952 671653 2280 2019
0.1% 0.0% 0.5% -0.3%
0.2% 0.0% 0.5% -1.1%
1.6% 0.3% 1.1% -2.4%
33% 10% -15% -30%
-
Source: DOE, PJK, LME, COMEX, SHFE, Bloomberg, Commerzbank Research Percentage change on previous period 1) 2) 3) 1 month forward, 3 months forward, spot Crude oil in USD per barrel, oil products and base metals in USD per ton, Precious metals in USD per troy ounce, grains and soybeans in US cents per bushel, Cotton, sugar and coffee Arabica in US cents per pound * US inventories of crude oil, oil products and ethanol in ‘000 barrel, US natural gas inventories in billion cubic feet, ARA stocks in ‘000 tons ** tons, *** ETF holdings in ‘000 ounces
17 October 2016
Commodity Research | Commodities Daily
Net long positions of money managers vs. price GRAPH1: Crude oil (WTI)
GRAPH 2: Natural gas (Henry Hub; futures and swaps)
'000 contracts
350 300
120
300
100
200
6.0
100
5.0
0
4.0
-100
3.0
-200
2.0
250 200
80
150
60
100 40
50 0 Jan-14
20 Jul-14
Jan-15
Jul-15
Jan-16
spec. net long positions, lS
Jul-16
7.0
'000 contracts
-300 Jan-14
WTI ($/barrel), rS
1.0 Jul-14
Jan-15
Jul-15
spec. net long posit., lS
Jan-16
HenryHub ($/MMBtu), r S
Source: CFTC; Bloomberg, Commerzbank Research
Source: CFTC; Bloomberg, Commerzbank Research
GRAPH 3: Crude oil (Brent)
GRAPH 4: Gold
in '000 contracts
500
120
Jul-16
'000 contracts
300
1400
250
400
100
300
80
150
200
60
100
100
40
1300
200
1200
50
0 Jan. 14
20 Jul. 14
Jan. 15
Jul. 15
Jan. 16
Spec. Net long positions, lS
Jul. 16
1100
0 -50 Jan-14
1000 Jul-14
Jan-15
Jul-15
spec. net long posit., left
Brent, $/barrel, rS
Jan-16
Gold ($ per troy ounce), right
Source: ICE; Bloomberg, Commerzbank Research
Source: CFTC; Bloomberg, Commerzbank Research
GRAPH 5: Silver
GRAPH 6: Copper
100
24
'000 contracts
80
22
60
20
40
18
20
16
0
14
-20 Jan-14
12 Jul-14
Jan-15
Jul-15
spec. net long posit., lS
Jan-16
Jul-16
Silver ( USD per troy ounce), rS
6500 6000 5500 5000 4500 4000 Jul-15
Jan-16
Jul-16
Copper (USD per ton), r S
GRAPH 8: Wheat
'000 contracts
550
200
500
60
800
'000 contracts
30
700
0
100
450
-30
600
400
-60
500
0 -100
-90
350
-200
300 Jul-14
Jan-15
spec. net long posit., lS
Jul-15
Jan-16
Jul-16
Corn (USd per bushel), rS
Source: CFTC; Bloomberg, Commerzbank Research
17 October 2016
7000
Source: CFTC; Bloomberg, Commerzbank Research
GRAPH 7: Corn
-300 Jan-14
7500
spec. net long positions, lS
Source: CFTC; Bloomberg, Commerzbank Research
300
'000 contracts 50 40 30 20 10 0 -10 -20 -30 -40 -50 Jan-14 Jul-14 Jan-15
Jul-16
400
-120 -150 Jan-14
300 Jul-14
Jan-15
spec. net long posit., lS
Jul-15
Jan-16
Jul-16
Wheat (USd per bushel), rS
Source: CFTC; Bloomberg, Commerzbank Research
3
Commodity Research | Commodities Daily
GRAPH 9: Forward curve oil market (WTI)
GRAPH 10: Forward curve oil market (Brent)
59
62
56
59
53
56
50
53
47
50
44
47
41 1M
8M
15M
22M
actual
29M
3Y
one week ago
43M
44 1M
7M
one month ago
13M
19M
actual
25M
31M
37M
one week ago
Source: NYMEX; Bloomberg, Commerzbank Research
Source: ICE; Bloomberg, Commerzbank Research
GRAPH 11: Forward curve gas market (Henry Hub)
GRAPH 12: Forward curve gasoil (ICE)
3.75
520
3.50
500
43M
one month ago
480
3.25
460
3.00
440
2.75 420
2.50 1M
8M
15M
22M
actual
29M
3Y
one week ago
43M
400 1M
3M
5M
7M
actual
one month ago
9M
Source: NYMEX; Bloomberg, Commerzbank Research
Source: ICE; Bloomberg, Commerzbank Research
GRAPH 13: Forward curve aluminium (LME)
GRAPH 14: Forward curve copper (LME)
1900
5000
1800
4900
1700
4800
1600
4700
1500 1M
8M actual
15M
22M
29M
one week ago
3Y
43M
13M
15M
one month ago
4600 1M
one month ago
8M actual
15M
22M
29M
one week ago
Source: LME; Bloomberg, Commerzbank Research
Source: LME; Bloomberg, Commerzbank Research
GRAPH 15: Forward curve Nickel (LME)
GRAPH 16: Forward curve zinc (LME)
11500
11M
one week ago
3Y
43M
one month ago
2400 2350
11000
2300
10500 2250
10000
2200 2150
9500 1M
8M actual
15M
22M
29M
one week ago
Source: LME; Bloomberg, Commerzbank Research
4
3Y
43M
one month ago
1M
5M actual
9M
13M
one week ago
17M
21M
one month ago
Source: LME; Bloomberg, Commerzbank Research
17 October 2016
Commodity Research | Commodities Daily
GRAPH 17: Forward curve lead (LME)
GRAPH 18: Forward curve tin (LME)
2200
20500
2100
20000
2000
19500
1900
19000 18500
1800 1M
8M actual
15M
1M
22M
one week ago
one month ago
4M actual
7M
10M
one week ago
13M one month ago
Source: LME; Bloomberg, Commerzbank Research
Source: LME, Bloomberg, Commerzbank Research
GRAPH 19: Forward curve wheat (CBOT)
GRAPH 20: Forward curve wheat (MATIF) 190
530 500
180
470
170 440
160
410 380
150 2M
7M actual
12M
18M
22M
one week ago
2M
one month ago
5M
7M
actual
11M
14M
18M
one week ago
Source: CBOT; Bloomberg, Commerzbank Research
Source: MATIF; Bloomberg, Commerzbank Research
GRAPH 17: Forward curve corn (CBOT)
GRAPH 22: Forward curve soybeans (CBOT)
440
1020
420
1000
400
19M
24M
one month ago
980
380 960
360
940
340 320
920
2M
7M actual
12M
18M
22M
one week ago
27M
1M
7M actual
one month ago
12M
18M
one week ago
Source: CBOT; Bloomberg, Commerzbank Research
Source: CBOT; Bloomberg, Commerzbank Research
GRAPH 23: Forward curve cotton (NYBOT)
GRAPH 24: Forward curve sugar (NYBOT)
72
23M one month ago
24.0
71 22.0
70 20.0
69 68
18.0
67 16.0
66 2M
7M actual
12M
17M
one week ago
Source: NYBOT; Bloomberg, Commerzbank Research
17 October 2016
21M
26M
one month ago
5M
9M actual
17M
21M
one week ago
29M
33M
one month ago
Source: NYBOT; Bloomberg, Commerzbank Research
5
Commodity Research | Commodities Daily
In accordance with ESMA MAR requirements this report was completed 17/10/2016 11:00 CEST and disseminated 17/10/2016 11:01 CEST. This document has been created and published by the Corporates & Markets division of Commerzbank AG, Frankfurt/Main or Commerzbank’s branch offices mentioned in the document. Commerzbank Corporates & Markets is the investment banking division of Commerzbank, integrating research, debt, equities, interest rates and foreign exchange. If this report includes an analysis of one or more equity securities, please note that the author(s) certify that (a) the views expressed in this report accurately reflect their personal views; and (b) no part of their compensation was, is, or will be directly or indirectly related to the specific recommendation(s) or views expressed by them contained in this document. The research analyst(s) named on this report are not registered / qualified as research analysts with FINRA. Such research analyst(s) may not be associated persons of Commerz Markets LLC and therefore may not be subject to FINRA Rule 2241 restrictions on communications with a subject company, public appearances and trading securities held by a research analyst account. It has not been determined in advance whether and in what intervals this document will be updated. Unless otherwise stated current prices refer to the most recent trading day’s closing price or spread which may fluctuate. Disclaimer This document is for information purposes only and does not take into account specific circumstances of any recipient. The information contained herein does not constitute the provision of investment advice. It is not intended to be and should not be construed as a recommendation, offer or solicitation to acquire, or dispose of, any of the financial instruments and/or securities mentioned in this document and will not form the basis or a part of any contract or commitment whatsoever. Investors should seek independent professional advice and draw their own conclusions regarding suitability of any transaction including the economic benefits, risks, legal, regulatory, credit, accounting and tax implications. The information in this document is based on public data obtained from sources believed by Commerzbank to be reliable and in good faith, but no representations, guarantees or warranties are made by Commerzbank with regard to accuracy, completeness or suitability of the data. Commerzbank has not performed any independent review or due diligence of publicly available information regarding an unaffiliated reference asset or index. The opinions and estimates contained herein reflect the current judgement of the author(s) on the date of this document and are subject to change without notice. The opinions do not necessarily correspond to the opinions of Commerzbank. Commerzbank does not have an obligation to update, modify or amend this document or to otherwise notify a reader thereof in the event that any matter stated herein, or any opinion, projection, forecast or estimate set forth herein, changes or subsequently becomes inaccurate. This communication may contain trading ideas where Commerzbank may trade in such financial instruments with customers or other counterparties. Any prices provided herein (other than those that are identified as being historical) are indicative only, and do not represent firm quotes as to either size or price. The past performance of financial instruments is not indicative of future results. No assurance can be given that any financial instrument or issuer described herein would yield favourable investment results. Any forecasts or price targets shown for companies and/or securities discussed in this document may not be achieved due to multiple risk factors including without limitation market volatility, sector volatility, corporate actions, the unavailability of complete and accurate information and/or the subsequent transpiration that underlying assumptions made by Commerzbank or by other sources relied upon in the document were inapposite. Commerzbank and or its affiliates may act as a market maker in the instrument(s) and or its derivative that has been mentioned in our research reports. Employees of Commerzbank and or its affiliates may provide written or oral commentary, including trading strategies, to our clients and business units that may be contrary to the opinions conveyed in this research report. Commerzbank may perform or seek to perform investment banking services for issuers mentioned in research reports. Neither Commerzbank nor any of its respective directors, officers or employees accepts any responsibility or liability whatsoever for any expense, loss or damages arising out of or in any way connected with the use of all or any part of this document. Commerzbank may provide hyperlinks to websites of entities mentioned in this document, however the inclusion of a link does not imply that Commerzbank endorses, recommends or approves any material on the linked page or accessible from it. Commerzbank does not accept responsibility whatsoever for any such material, nor for any consequences of its use. This document is for the use of the addressees only and may not be reproduced, redistributed or passed on to any other person or published, in whole or in part, for any purpose, without the prior, written consent of Commerzbank. The manner of distributing this document may be restricted by law or regulation in certain countries, including the United States. Persons into whose possession this document may come are required to inform themselves about and to observe such restrictions. By accepting this document, a recipient hereof agrees to be bound by the foregoing limitations. Additional notes to readers in the following countries: Germany: Commerzbank AG is registered in the Commercial Register at Amtsgericht Frankfurt under the number HRB 32000. Commerzbank AG is supervised by both the German regulator, Bundesanstalt für Finanzdienstleistungsaufsicht (BaFin), Graurheindorfer Strasse 108, 53117 Bonn, Marie-Curie-Strasse 24-28, 60439 Frankfurt am Main and the European Central Bank, Sonnemannstrasse 20, 60314 Frankfurt am Main, Germany. United Kingdom: This document has been issued or approved for issue in the United Kingdom by Commerzbank AG London Branch. Commerzbank AG, London Branch is authorised by Bundesanstalt für Finanzdienstleistungsaufsicht (BaFin), and the European Central Bank and is subject to limited regulation by the Financial Conduct Authority and Prudential Regulation Authority. Details on the extent of our regulation by the Financial Conduct Authority and Prudential Regulation Authority are available from us on request. This document is directed exclusively to eligible counterparties and professional clients. It is not directed to retail clients. No persons other than an eligible counterparty or a professional client should read or rely on any information in this document. Commerzbank AG, London Branch does not deal for or advise or otherwise offer any investment services to retail clients. United States: This document has been approved for distribution in the US under applicable US law by Commerz Markets LLC (‘Commerz Markets’), a wholly owned subsidiary of Commerzbank AG and a US registered broker-dealer. Any securities transaction by US persons must be effected with Commerz Markets, and transaction in swaps with Commerzbank AG. Under applicable US law; information regarding clients of Commerz Markets may be distributed to other companies within the Commerzbank group. This research report is intended for distribution in the United States solely to “institutional investors” and “major U.S. institutional investors,” as defined in Rule 15a-6 under the Securities Exchange Act of 1934. Commerz Markets is a member of FINRA and SIPC. Commerzbank AG is a provisionally registered swap dealer with the CFTC. Canada: The information contained herein is not, and under no circumstances is to be construed as, a prospectus, an advertisement, a public offering, an offer to sell securities described herein, solicitation of an offer to buy securities described herein, in Canada or any province or territory thereof. Any offer or sale of the securities described herein in Canada will be made only under an exemption from the requirements to file a prospectus with the relevant Canadian securities regulators and only by a dealer properly registered under applicable securities laws or, alternatively, pursuant to an exemption from the dealer registration requirement in the relevant province or territory of Canada in which such offer or sale is made. Under no circumstances is the information contained herein to be construed as investment advice in any province or territory of Canada and is not tailored to the needs of the recipient. In Canada, the information contained herein is intended solely for distribution to Permitted Clients (as such term is defined in National Instrument 31-103) with whom Commerz Markets LLC deals pursuant to the international dealer exemption. To the extent that the information contained herein references securities of an issuer incorporated, formed or created under the laws of Canada or a province or territory of Canada, any trades in such securities may not be conducted through Commerz Markets LLC. No securities commission or similar regulatory authority in Canada has reviewed or in any way passed upon these materials, the information contained herein or the merits of the securities described herein and any representation to the contrary is an offence. European Economic Area: Where this document has been produced by a legal entity outside of the EEA, the document has been re-issued by Commerzbank AG, London Branch for distribution into the EEA. Singapore: This document is furnished in Singapore by Commerzbank AG, Singapore branch. It may only be received in Singapore by an institutional investor as defined in section 4A of the Securities and Futures Act, Chapter 289 of Singapore ("SFA") pursuant to section 274 of the SFA. Hong Kong: This document is furnished in Hong Kong by Commerzbank AG, Hong Kong Branch, and may only be received in Hong Kong by ‘professional investors’ within the meaning of Schedule 1 of the Securities and Futures Ordinance (Cap.571) of Hong Kong and any rules made there under. Japan: This research report and its distribution do not constitute and should not be construed as a "solicitation" under the Financial Instrument Exchange Act (FIEA). This document may be distributed in Japan solely to "professional investors" as defined in Section 2(31) of the FIEA and Section 23 of the Cabinet Ordinance Regarding Definition of Section 2 of the FIEA by Commerzbank AG, Tokyo Branch. Note, however, that Commerzbank AG, Tokyo Branch has not participated in its
6
17 October 2016
Commodities Daily
preparation. Not all financial or other instruments referred to in this document are available within Japan. Please contact the Corporates & Markets division of Commerzbank AG or Commerzbank AG, Tokyo Branch for inquiries on the availability of such instruments. [Commerzbank AG, Tokyo Branch] Registered Financial Institution: Director of Kanto Local Finance Bureau (Tokin) No. 641 / Member Association: Japanese Bankers Association. Australia: Commerzbank AG does not hold an Australian financial services licence. This document is being distributed in Australia to wholesale customers pursuant to an Australian financial services licence exemption for Commerzbank AG under Class Order 04/1313. Commerzbank AG is regulated by Bundesanstalt für Finanzdienstleistungsaufsicht (BaFin) under the laws of Germany which differ from Australian laws. © Commerzbank AG 2016. All rights reserved. Version 9.25 Commerzbank Corporates & Markets Frankfurt Commerzbank AG DLZ - Gebäude 2, Händlerhaus Mainzer Landstraße 153 60327 Frankfurt
London Commerzbank AG PO BOX 52715 30 Gresham Street London, EC2P 2XY
New York Commerz Markets LLC 225 Liberty Street, 32nd floor, New York, NY 10281-1050
Singapore Commerzbank AG 71, Robinson Road, #12-01 Singapore 068895
Tel: + 49 69 136 21200
Tel: + 44 207 623 8000
Tel: + 1 212 703 4000
Tel: +65 631 10000
17 October 2016
Hong Kong Commerzbank AG 15th Floor, Lee Garden One 33 Hysan Avenue, Causeway Bay Hong Kong Tel: +852 3988 0988
7