CITYWIDE VISION PHILADELPHIA
2 35 > SUMMARY
The future begins now. Through two phases of work—the Citywide Vision and 18 District Plans—Philadelphia2035 builds on our city’s recent achievements and long-established assets to guide physical development for the next 25 years and beyond. Philadelphia today is a desirable, vibrant place with an authentic urban form. Our well-designed grid of small streets has unmatched charm and function; Philadelphia is consistently ranked as one of the nation’s most walkable cities. After decades of population loss, Philadelphia’s numbers are once again on the rise. Our central location in the Northeast Megaregion is within a 200-mile radius of more than 46 million people. Philadelphia is the economic engine of the eighth-largest regional economy in the world, and diverse economic sectors give Philadelphia strength across many markets. No other city can claim Philadelphia’s legacy of transformative U.S. history. Fairmount Park makes Philadelphia eminently livable; it is the largest municipal park system in the eastern United States. The city remains affordable for residents by providing a range of housing choices that accommodates virtually all income levels. An updated zoning and development process—transformative in its own right—will help to implement Philadelphia2035 in a fair, predictable, and transparent way. Philadelphia2035 is our blueprint for a 21st-century city that THRIVEs with new growth and opportunities, CONNECTs to the region and the world, and RENEWs its valued resources for future generations.
PHILADELPHIA
2 35 2
Philadelphia2035
> PHILADELPHIA2035 CITYWIDE VISION SUMMARY > DEFINING THE CONTEXT 4 > BUILDING ON OUR STRENGTHS 7 Philadelphia2035 = Citywide Vision + District Plans 1 Update on a 5-year cycle 2 Vision informs District Plans 3 District Plans inform zoning map revisions
> FRAMING OUR FUTURE 10 > MAKING IT HAPPEN 20
Phase 1: Citywide Vision
Phase 2: 18 District Plans
It Began with a Plan Philadelphia Today Population and Employment Forecasting
Strong Metropolitan Center Diverse, Authentic Neighborhoods Industrial-Legacy Areas Existing and Future Land Use
Three Forward-Looking Themes THRIVE CONNECT RENEW
Implementation: Next Steps Benefits and Measures Priorities and Cost Estimates
> DEFINING THE CONTEXT It Began with a Plan
Philadelphia has a rich history of planning achievements beginning with William Penn’s elegant design for the city in 1681. From that time on, the city has been shaped by thoughtful planning to make the most of location, urban form, and access to resources. As the heart of a new nation, Philadelphia’s port on the Delaware River was a center of commerce. In the early 19th Century, the port was augmented by railroads that fed Philadelphia with raw materials for manufacture and distribution making it, for a time, the “Workshop of the World.” In the mid 20th century the construction of interstate highways and a new airport increased the flow of goods and access to and from the city. By this time a rich transit network was in place and a comprehensive plan in the works. That 1960 comprehensive plan left a legacy in Philadelphia. During the mid-20th century, Philadelphia’s economy was shifting from an industrial and manufacturing base to a service economy. The plan recognized this and put much emphasis on transforming downtown Philadelphia into a commercial office and residential center. Additionally, the 1960 plan guided development of parts of the far Northeast and Southwest. >> The PCPC at Center of Planning for Philadelphia An important purpose of Philadelphia2035 is to consolidate ideas from multiple sources so the City presents a unified, comprehensive vision and plan. Philadelphia2035 is also key to the Philadelphia City Planning Commission’s (PCPC) and Zoning Code Commission’s (ZCC) “Integrated Planning and Zoning Process,” which directly links zoning reform with citywide and district planning, and establishes a Citizens Planning Institute to serve as the PCPC’s education and outreach arm. A comprehensive plan sets broad policy within which City government works as it carries out its operations and capital investments. With projections of future population, housing, and employment, Philadelphia2035 establishes a framework around which City departments can plan improvements.
4
In concert with a reformed zoning code, Philadelphia2035 improves the development process by making it more predictable and transparent. >> The Philadelphia2035 Planning Process The first phase of Philadelphia2035 presents a comprehensive vision of citywide initiatives, strategies and projects that sets overall development policies for the next 25 years. Many of the recommendations of the Citywide Vision will be further expanded and detailed in forthcoming District Plans. PCPC turned to two teams of experts for input and direction to create Philadelphia2035. First was the City Working Group, comprised of representatives from City agencies. Many of these agencies have
Ideas from Spring 2010 Public Meetings
plans that informed Philadelphia2035, and many will be responsible for implementing recommendations. The second group, the Advisory Board, consisted of regional leaders from the public, private, and nonprofit sectors. To gain input from citizens and stakeholders, the PCPC conducted several citywide public meetings, established a Facebook page, and developed an interactive website: www.phila2035.org. Following the release of the draft Citywide Vision in early 2011, the PCPC held a public open house and conducted “Plain Talk/Plan Talk” roundtable meetings. Dozens of stakeholder and civic organization meetings were also conducted. As the PCPC begins the District Plans and subsequently recommends revisions to the City’s zoning map, public outreach will continue in earnest.
!
!
1!
!
!
Priority projects designated by the public at the fall 2010 public meetings
!
1 Rapid transit along Roosevelt Boulevard with neighborhood centers at stations
! ! ! ! ! ! !
2 Continuous waterfront recreation trail
!
! !
! ! !
! ! ! ! !
!
!
2
3 Transit system along Delaware River waterfront
!
!
! !
! !
!
!
4!
! ! ! ! ! ! !
!
!
!
!
!
!
!
!
5
!
!
!
!
!
6!
!
!
!
!
! !
4 North Philadelphia transit-oriented development with housing investment
! !
!
5 Reading Railroad Viaduct park and maintenance of existing parks
! !
!
!
!
3
! !
!
! ! !
!
!
!
!
!
! !
!!
!
!
!
!
!
!
PATCO
!
!
7!
! !
!
!
!
6 Centennial District and cultural corridor transit along Benjamin Franklin Parkway
!
7 Green schoolyards for neighborhood use
!
8 Broad Street subway extension to Navy Yard
!
!
!
8!
10
!
9
!
! ! ! !
9 Navy Yard development with new industry 10 Small-scale urban farming on vacant land and brownfields
Philadelphia2035
Philadelphia Today A comprehensive plan is based on an understanding of relevant conditions. These conditions are created by historical and emerging trends and relationships, reflect Philadelphia’s strengths and weaknesses, and establish a foundation from which to measure progress toward the goals of Philadelphia2035. >> Regional Context Philadelphia enjoys a central location within a four-state, 12-county Greater Philadelphia region, projected to grow from 6.3 to 7.0 million people between 2010 and 2035. At a larger scale, Philadelphia is well situated within the Northeast Megaregion, the 54-million-person corridor from Maine to Virginia that is likely to grow to 60 million by 2035. Philadelphia’s share of the region’s population continues to decrease, though at a slower pace than past trends, reflecting the recent decade’s successes in employment stabilization and neighborhood revitalization. Density and diversity positively differentiate Philadelphia from surrounding communities. With more than 11,000 people per square mile, Philadelphia serves households that prefer an urban location and lifestyle. >> Demographic Trends Population change is a central consideration in planning for the city’s future. Philadelphia is narrowing the population loss caused by the movement of households from the city. A growing minority and immigrant population brings new multicultural perspectives and entrepreneurial talent, and cultivates new trade and cultural opportunities. With more than one-half-million foreign-born residents in Greater Philadelphia today,
Greater Philadelphia Region 6.35 million people, 12 counties, 4 states
Bucks Mercer
Montgomery Chester Delaware Cecil
MD
PA
Burlington NJ DE
New Castle
Citywide Vision Summary
Camden Gloucester Salem 10 Miles
Population Characteristics, 2006-2008
Median Age Population >65 Years (%) Population 65 years
n.a.
$36,222
29.1 9.9
39.7 11.6
Family with children
30.4
24.6
the city has a strong foundation from which to attract substantial future immigration. Philadelphia has a relatively young population. The city’s median age of 35.5 years is lower than the national median, due to high birth rates and low median ages of the city’s Black, Asian, and Hispanic populations.
>> Economic Profile The Philadelphia metropolitan area is known for positive but moderate economic growth, as well as economic diversity, which offers a wide range of job and investment opportunities and cushions the region from downturns in volatile sectors. The city and region share strengths in education, health care, and government enterprises, yet regional job growth exceeds the city’s in all other major sectors. The region’s jobs are increasingly decentralized as new employers locate in suburban and ex-urban corridors. Within the city, certain places are competitive including Center City, University City, Philadelphia International Airport, and the Navy Yard. The city is making progress in retaining and attracting new educated, working-age residents
and in improving the educational attainment of existing citizens. Yet, overall, the city’s population has low educational attainment and laborforce participation, high unemployment, and low income.
>> Health and Well-being Profile Philadelphia faces significant public-health challenges including high rates of chronic disease and obesity. Research links obesity to increased likelihood of other negative health outcomes. Most of the city possesses the infrastructure necessary for healthy, walkable neighborhoods, but a majority of Philadelphians faces significant environmental hurdles that contribute to unhealthful behaviors. Additionally, inadequate access to sources of healthy foods limits residents’ ability to achieve balanced diets and inadequate access to safe recreational spaces limits their ability to stay active. Several efforts are underway to improve access to and increase usage of these resources. >> Environmental Profile Direct access to both the Delaware and Schuylkill Rivers provides a generally reliable quantity of water, yet extensive investment in treatment and watershed management is required to protect its quality. The quality of the region’s air is harmed by contaminants transported into the area by prevailing winds and by excessive consumption of fossil fuels; however, since the 1970’s, the quality of the city’s air and water have improved due to environmental stewardship, investment, and reductions in heavy industrial activity. One of the city’s major environmental legacies is a large amount of vacant land resulting from previous deindustrialization and population loss. And the city’s people, buildings, infrastructure, and natural areas are vulnerable to environmental changes associated with long-term climate change.
5
Population and Employment Forecasting
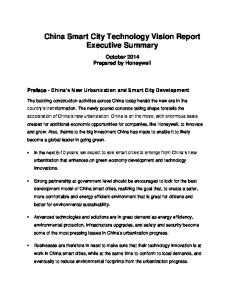
To develop a comprehensive plan for Philadelphia in 2035, it is necessary to make assumptions about long-range physical, social, and economic conditions. Population and employment forecasts help determine what and where changes are likely to occur and the type of housing, places of employment, and services that will be needed to accommodate the projected changes. >> Population Philadelphia has experienced the boom of population growth and the bust of decline. The first census in 1790 reported a Philadelphia population of 54,366. With a strategic location on the Atlantic Seaboard, Philadelphia was a major center of commerce, and by 1950, the city reached a peak population of 2.07 million, as the third largest city in the country. Over the next 50 years, Philadelphia experienced a major period of disinvestment and decline as employment and population decentralized towards surrounding counties. By 2000, Philadelphia had lost over 25 percent of its population and over 200,000 jobs. Positively, in the decade between 2000 and 2010, Philadelphia reversed the trend and posted gains in population and households. According to initial data from Census2010, the city’s population increased by 0.6 percent to 1,526,006, and the number of households in the city increased by 1.6 percent to 599,736. Prior to the economic recession that began in 2007, residential development activity in Philadelphia increased substantially, particularly in and around Center City.
dents by 2035: a significant population increase of 100,000 people (or 38,000 households) over 25 years. >> Employment Jobs are both a cause and result of population change. Residents with skills, capital, and entrepreneurial energy create jobs. At the same time, the availability of jobs retains and attracts residents. In the past four decades, Philadelphia has become less of a job center and more of a bedroom community. The ratio of residents to Philadelphiabased jobs increased from 1.99 in 1970 to 2.27 in 2010, as the jobs in the city decreased proportionately more than the decrease in residents. By contrast, in most of the other counties in the region, the ratio of residents to jobs decreased substantially as growth in county-based employment outpaced increases in residents. >> Employment Forecast The Philadelphia2035 employment forecast is based upon the historical relationship between jobs and population, anticipated changes in the city’s demographics and workforce, and the potential of land and facilities to accommodate jobsupporting enterprises. Over the next 25 years, the PCPC anticipates that changes in public policies and strategic investments in infrastructure will enable the city to reverse decades of net employment loss by capturing and retaining at least 40,000 of the more than 300,000 additional jobs expected to be created in Greater Philadelphia. The new Philadelphia-based jobs will be distributed across multiple economic sectors.
>> Population Forecast The PCPC determined that the recent increase in population and residential development activity is a strong indicator of positive future growth. The PCPC’s population forecast for 2035 used a range of five forecasts based on different assumptions, including extrapolation of long- and short-term trends, and consideration of the impacts of future conditions and interventions on births, deaths, and migration. This approach yielded an average forecast of nearly 1.63 million Philadelphia resi-
Philadelphia’s Growth 1800
75,000 people 1850
409,000 people 1900
1.29 million people 1950
2.07 million people 2010
Philadelphia2035 Forecast
6
2010
2035
2010-2035 Change
1.
Population
1,530,000
1,630,000
+ 100,000
2.
Households
600,000
638,000
+ 38,000
3.
Jobs
675,000
715,000
+ 40,000
4.
Residents per Job
2.27
2.28
+ 0.01
1.53 million people
Philadelphia2035
> BUILDING ON OUR STRENGTHS Philadelphia has three key strengths on which to build its future physical development: A strong metropolitan center; diverse, authentic neighborhoods; and industrial-legacy areas.
Strong Metropolitan Center
renowned historic sites, such as the Independence National Historical Park, along with cultural assets, like the Philadelphia Museum of Art and the Franklin Institute.
Philadelphia’s Metropolitan Center is critical to our region. It includes the major employment, institutional, and residential hubs of Center City and University City. Many of the region’s largest public and private employers are headquartered or have major operations in the Metropolitan Center.
positioned for global competition...
335,000 jobs are located in the Metropolitan Center.
The Center City portion of the Metropolitan Center is home to an estimated 92,000 residents, the 3rd largest downtown population in the U.S., with walking access to jobs, stores, schools, and parks. (Center City District, 2010).
The Metropolitan Center is a hub for SEPTA and Amtrak, and is connected to freight, port, and air facilities that link Philadelphia’s residents, workers, and goods to the eastern seaboard and the world. Within the Metropolitan Center are world-
Philadelphia Museum of Art
Rittenhouse Square 15 min walk
44% of Center City workers walk to work.
North Broad St. Institutions
Franklin Square 15 min walk
Barnes Foundation 3
t hS
t
40
Girard
11 City Hall
5
1
3
~1.0 mi
~1.5 mi
6 ~0.5 mi 7 8
Kimmel Center Was hi
ngto
10
Market-Frankford Line
Independence Mall 2 9 4
n Av
e.
Penns Landing 20min walk
Broad Street Line
Washington Square 17min walk
Philadelphia Sports Complex
Citywide Vision Summary
Convention Center
Ave.
PATCO
Higher Education Institutions in the Metropolitan Center 1. 2. 3. 4. 5. 6. 7. 8. 9. 10. 11.
University of Pennsylvania Temple University - City Center Drexel University University of the Arts Moore College of Art & Design Art Institute of Philadelphia Curtis Institute of Music Peirce College Thomas Jefferson University Pennsylvania Academy of the Fine Arts Philadelphia Community College
7
Diverse, Authentic Neighborhoods
Philadelphia has nearly 170 distinct neighborhoods, spread across its 135 square miles. Influenced by the urban street grid, Philadelphia’s neighborhoods are walkable and interconnected by public transit and rail networks.
undergoing revitalization and enhancement...
Residents benefit from a range of affordable housing choices, and convenient access to public services and urban amenities. While some neighborhoods have suffered over years of economic and population change, access and choice are key to expanding revitalization into neighborhoods most in need of stabilization and recovery.
Opportunity for Infill Housing Choice
70% 5%
6%
Apartment Condo
6%
Detached
14%
SemiDetached
Row House
North Broad
Character and Diversity
Amtrak Corridor
Far Northeast Regional Center
Hunting Park West
Lower Schuylkill North Delaware Philadelphia International Airport (PHL)
Central Delaware Waterfront
Transit Access Industrial-Legacy Area Parks and Open Space
Navy Yard
Industrial-Legacy Areas
ripe for renewal and transformation...
8
Commercial Corridor
For over a century, manufacturing was the economic engine of Philadelphia. Manufacturing and industrial operations were distributed throughout the city, but major industrial concentrations developed along the riverfronts of the Lower Schuylkill and the Delaware River and in North Philadelphia. Industrial output in Philadelphia peaked in the 1950’s and declined steadily. When factories and operations closed, large swaths of land in industrial areas were abandoned, and many remaining operating sites became underutilized.
Public Services
Now, these underutilized “industrial-legacy” areas are viewed as assets because of their available acreage, connections to utilities, access to transportation, and proximity to diverse labor and customer markets. These are all vital ingredients for creating new uses and new jobs for a city that is growing again. Philadelphia2035 identifies nine industrial legacy areas where focused planning coupled with a draft zoning code can produce a strong and stable environment for a diverse mix of activities: industry, commerce, research and development, residential, and new waterfront recreation and open space.
Philadelphia2035
Existing and Future Land Use
A comprehensive plan shows where expected land demand and associated support facilities are to be accommodated in the future. Building on current and forecasted conditions, this section presents key citywide land-use findings to inform recommendations about the use of Philadelphia’s land resources, particularly as District Plans are prepared over the next several years. >> Existing Land Use Land use is a basic description of a city’s physical development. Philadelphia2035 employs updated land use definitions that reflect the type, location, and intensity of activities that take place on the city’s 86,000 acres of land. A comparison between 1970 and 2010 city data shows substantial absorption of vacant land close to adjoining counties, increased vacancy in communities surrounding the Metropolitan Center, and increased prevalence of low-density, auto-oriented development. The city has fewer vacant and developable acres than in 1970 but that vacancy is now concentrated in the close-in neighborhoods and employment centers that have seen high losses of population and jobs. Citywide, land is less intensively used than in 1970. The city’s smaller number of residents and jobs are more spread out, and newer buildings are typically more suburban in character than the structures they replaced. Net residential and employment density are lower than in 1970.
The land-use analysis also suggests that publicsector intervention will continue to be necessary to achieve effective reuse of the city’s currently underutilized land. For example, the land-use model showed underutilized land in parts of North, South, and West Philadelphia to be among the acres most suitable for future development; however, many of the communities that surround the Metropolitan Center remain economically distressed and unlikely to sustain private-sector repurposing of underutilized property without public financial incentives. As in the past, targeted interventions that utilize phased, placemaking strategies will continue to offer a sound approach to building private market confidence in the longterm development of specific areas:
• Reinforce the city’s unique features and areas of strength; • Strengthen land use and transportation connections between areas of strength; • Make use of and modernize existing infrastructure; • Promote density and diversity of land use in centers, districts, and corridors; • Reinforce places and facilities that successfully serve larger markets; • Adjust public services and facilities to reflect shifting customer locations and preferences; and • Exploit the city’s accessible, compact form to create competitive advantage.
2010 Land Use
>> Future Land Use Model Between 2010 and 2035, Philadelphia will see demand for new development based on population and employment growth. The city is expected to gain new residents and businesses while continuing to meet the changing land use needs of the current 1.53 million residents. It is estimated that nearly 7,000 acres will be needed to accommodate the housing, commerce and industry growth forecasted for the next 25 years. Understanding the City’s underutilized land resources, susceptibility to change, and suitability for new uses, the PCPC confirmed three assumptions: 1) There is sufficient land in the city to accommodate current and future uses; 2) The bulk of available land is located in the city core, within and adjacent to former industrial uses; and 3) Even with a healthy pace of development, more than 2,000 acres will remain underutilized in 2035 for lack of demand. It will be important to stabilize these areas so they will be ready to accommodate development beyond 2035.
Citywide Vision Summary
Transportation Acres: 20,373
24%
30% Residential Acres: 25,940
Commercial Acres: 4,376 Industrial 5% Acres: 10,818
13%
Civic and Institution
5% Acres: 4,415 4% Cultural and Recreation Acres; 3,162 10% Parks and Open Space 5% 5%
Other Acres: 4,071
Acres: 8,689 Vacant Acres: 4,233
9
> FRAMING OUR FUTURE Three Forward-Looking Themes Focusing on future land use for the city as a whole is only one of several topics Philadelphia2035 addresses in making physical-development-related recommendations for 2035. The others are organized into three forward-looking themes: THRIVE, CONNECT and RENEW. Within these broad themes are nine elements that are typical of the focus and organization of comprehensive plans. Elements include broad goals and 25 specific topics, each of which is supported by a specific goal, achievable through dozens of objectives and hundreds of strategies.
> THRIVE
> CONNECT
> RENEW
In 2035, Philadelphia is a thriving metropolis. It is a city built on healthy neighborhoods and a diverse economy offering opportunity to everyone. Cultural and institutional resources and new enterprises flourish, and land is used in suitable and vibrant ways.
In 2035, people, goods, and ideas move effortlessly between neighborhoods, the region, and the world, driving economic prosperity. Reliable and efficient transportation serves a population that is more energy conscious than ever before.
In 2035, Philadelphia preserves and renews its environmental and historic resources. The city showcases centuries of growth and change, treasured parks and rivers, valued culture and architecture, and clean air and water.
1 Neighborhoods Improve neighborhood livability
2 Economic Development Make Philadelphia more competitive in the metropolitan region
3 Land Management Capitalize on land assets
4 Transportation
6 Open Space
Improve transportation safety, efficiency, and convenience
5 Utilities
Increase equitable access to our open-space resources
7
Adapt utility services to changing technology and consumption patterns
Environmental Resources Fulfill city obligations to meet ambitious federal environmental standards
8
Historic Preservation Preserve and reuse historic resources
9 Public Realm Achieve excellence in the design and quality of Philadelphia’s built environment
10
Philadelphia2035
THRIVE >
Philadelphians THRIVE in the center of a competitive metropolitan region
1 Neighborhoods Philadelphia is called “The City of Neighborhoods” as neighborhoods are the foundation of our city. The Neighborhoods element places communities and the people of Philadelphia at the forefront of Philadelphia2035. This element focuses on issues related to land use and economic development, and quality of life.
transit stations that form the hearts of our communities. The policies in this topic aim to strengthen these assets by recommending capital improvements, zoning changes, and incentive programs. This topic also pays special attention to transit and healthy food access in our neighborhood centers.
Each one of our neighborhoods has its own character and atmosphere, but all neighborhoods share common assets that strengthen and form their identity. Some neighborhood assets are intangible and social—ethnic identity, religious institutions, and great neighbors—which land-use and economic policies cannot affect. But important physical-development considerations such as public facilities, housing, and commercial services are the kind of issues that can be affected by City policies and are considered in this section.
The Housing topic addresses policies that affect both new construction and our existing housing stock with an emphasis on rehabilitation and infill. The housing policies set forth in Philadelphia2035 ensure that Philadelphians have quality housing choices that reflect changing demographics and affordability needs, while locating new housing to strengthen our neighborhood centers.
Neighborhood Centers Promote strong and well-balanced neighborhood centers
1 Strengthen neighborhood centers by clustering community-serving public facilities. 2 Strengthen neighborhood centers by developing viable commercial corridors. 3 Strengthen neighborhood centers by promoting transit-oriented development around stations. 4 Provide convenient access to healthy food for all residents.
1.2
Housing Improve the quality and diversity of new and existing housing
1 Stabilize and upgrade existing housing stock. 2 Ensure a wide mix of housing is available to residents of all income levels.
The Neighborhood Centers topic focuses on the community-serving public facilities such as libraries and health centers, commercial corridors, and
Strong and Stable Commercial Corridors
1.1
3 Promote new affordable housing developments to strengthen existing neighborhood assets.
Poverty and Affordable Housing Concentrations
Percent of Population in Poverty 0 - 10% Business Improvemnt or Special Services District
Citywide Vision Summary
11% - 40% 41% - 80%
Strong Corridor
Non-Residential
Stable Corridor
PHA and OHCD Affordable Housing Site
11
2 Economic Development Growth of Philadelphia’s job and tax base is critical to the success of both the city and the Greater Philadelphia region. For several decades, the city has experienced erosion in employment and tax ratable properties, but the tides are turning in favor of Philadelphia’s economic resurgence: Philadelphia remains a dynamic force in the region’s economic market, the population has increased for the first time since 1950, and Philadelphia2035 forecasts 100,000 new residents and 40,000 additional jobs over the next 25 years. A key factor in the economic revival of Philadelphia is its central location in the Northeast Megaregion, a globally significant economic superengine stretching from Northern Virginia to Southern Maine. The Northeast Megaregion produces 20 percent of the nation’s gross domestic product, with only two percent of the nation’s land area, and is expected to add one million new residents over the next generation (America2050, 2010).
Among the city’s unique assets are its existing and emerging employment centers. The Center City/ University City area makes up the Metropolitan Center of Philadelphia, and generates jobs in leading education, health care, cultural, professional services, and hospitality sectors. The Navy Yard, Sports Complex, and Philadelphia International Airport comprise one of the region’s most dynamic Metropolitan Subcenters. Located across the city are several nationally renowned universities and hospitals that are both key employers, and sources of entrepreneurial talent and innovation for Philadelphia. The full realization of our economic potential requires the City to infuse entrepreneurial energy into areas long associated with Philadelphia’s rich industrial past. Numerous Industrial-Legacy Areas, weakened by the decline in manufacturing, now present opportunities for redevelopment into modern industrial enterprises, and/or into creative mixes of other land uses, including institutional, commercial, and residential.
2.1
Metropolitan and Regional Centers Support the growth of economic centers
1 Support and promote Center City/University City as the primary economic center of the region. 2 Strengthen Metropolitan Subcenters. 3 Encourage the growth and development of both existing and emerging Regional Centers.
2.2
Industrial Land Target industrial lands for continued growth and development
1 Ensure an adequate supply and distribution of industrially zoned land. 2 Reposition former industrial sites for new users.
2.3
Institutions Grow Philadelphia’s strong institutional job sectors
1 Encourage institutional development and expansion through policy and careful consideration of land resources. 2 Create cooperative relationships between institutions and neighbors.
Philadelphia’s Expanding Metropolitan Center
Percentage of Employed People Working in Education and Medicine in 2008
Girard Ave
40 St
Spring Garden St
Baltimore
30.9%
Philadelphia
30.8%
Boston
30.4%
Pittsburgh
29.3%
Washington, D.C. 2010
1963
Develop tourism and creative economy into a leading economic sector 1 Maintain Philadelphia’s strong role in the national and international tourism market. 2 Provide ample resources to cultural institutions to enrich the City’s quality of life.
25.0%
Detroit
Washington Ave
Cultural Economy
27.2%
Cleveland South St
2.4
20.2%
Chicago
18.6% 15.7%
Houston
14.0%
Phoenix 30
20
10
0
(Source: Census Bureau, 2008 Economic Census)
12
Philadelphia2035
3 Land Management The Land Management element sets forth policies for vacant land and structures, land suitability, and municipal support facilities. Issues related to land use and economic development are key to all of the elements within THRIVE. The topics under Land Management are related to land and how it is used, specifically land that is often overlooked and underutilized. This element also looks at the environmental impacts of development on sensitive lands in the Land Suitability topic. Currently, policies for the Land Management topics are spread across numerous public agencies and are often uncoordinated. For example, five agencies hold vacant land and structures in Philadelphia and each has multiple ways by which it sells land. Policies for public notification, sales method, appraisal process, and what land is available for sale differ from agency to agency. Similarly, municipal support facilities, like vehicle
fuel-pumping stations and maintenance yards, are maintained by various City departments. Often these facilities are not shared and may duplicate functions. Philadelphia2035 strives for coordinated policies for vacant land and structures, sensitive lands such as steep slopes and floodplains, and municipal support facilities. Implementation of the coordinated policies set forth in the Land Management element will result in reduced capital and operational costs by lowering the number of City-owned facilities and eliminating duplicative programs and services, promotion of redevelopment and economic development, and protection of sensitive lands.
3.1
Vacant Land and Structures Manage and reduce vacancy
1 Centralize land management in a single City agency to track and dispose of surplus land and structures and return publicly owned vacant parcels to taxable status. 2 Prevent abandonment of land and structures. 3 Reuse vacant land and structures in innovative ways.
3.2
Land Suitability Protect sensitive lands from over development
1 Use topography to direct land development.
3.3
Municipal Support Facilities Locate and manage all municipal support facilities efficiently
1 Reduce expenditures for municipal support facilities.
Ownership of Vacant Land and Buildings
Sensitive Land Areas
28% Public 72% Private
Distribution of Vacant Land and Buildings
Historic Stream 15% to 25% Slope (Engineering Countermeasures Necessary)
64% Land
36% Buildings
(Source: Philadelphia Water Department 2009; Board of Revision of Taxes 2009)
Citywide Vision Summary
Over 25% Slope (Development Not Feasible) FEMA 500-Year Floodplain FEMA 100-Year Floodplain (Sources: PCPC 2010, U.S. FEMA 2007)
13
CONNECT >
Philadelphians CONNECT seamlessly to the region and the world
4 Transportation Transportation plays a vital role in our daily lives and in the economy of our city and region. Our transportation system determines how we get from our homes to our places of work, and how we travel to schools and libraries, places of worship, restaurants and shopping, medical and business appointments, parks and playgrounds, museums and movies, and to visit friends and family. Transportation is critical to the economy because it delivers workers to jobs, and products and customers to markets. Transportation brings tourists to Philadelphia to enjoy the many attractions of the city. Philadelphia International Airport is one of the busiest airports in the world and among the fastest growing in the United States, while Amtrak’s Northeast Corridor is the busiest passenger rail corridor in the U.S. Freight-related employment in the region totals over one-half million jobs (U.S. Bureau of Economic Analysis, 2008).
Historically, transportation infrastructure has been a major determinant of urban form. William Penn’s grid system now extends through much of the city and provides a well-connected network that offers drivers, bicyclists, and pedestrians many alternative routes. Buses, trolleys, and trackless trolleys also use the street network to transport thousands of transit passengers, many of whom have no alternative (e.g., no-car households, the elderly, students). The larger transportation facilities—major railways and highways built in the 19th and 20th centuries, as well as rivers, seaports, and airports—provide regional and national mobility, yet may be barriers to movement between bordering neighborhoods.
4.1
Transit Increase the use of transit to reduce environmental impacts and travel time
1 Invest in existing infrastructure to improve service and attract riders. 2 Extend and introduce new technological advances to the transit network to serve new markets. 3 Coordinate land use decisions with existing and planned transit assets to increase transportation choices.
4.2
Complete Streets
Balance use of roadways to ensure safe and efficient travel by all modes 1 Implement a complete streets policy to ensure that the right-of-way will provide safe access for all users. 2 Expand on- and off-street networks serving pedestrians and bicyclists. 3 Improve safety for pedestrians and bicyclists and reduce pedestrian and bicycle crashes.
4.3
Streets and Highways
Provide a safe and efficient road network that supports planned land uses 1 Upgrade and modernize existing streets, bridges, and traffic control infrastructure to ensure a high level of reliability and safety.
Major Transit Improvement Proposals
Cross Section of a One-Way Complete Street
2 Control automobile congestion through traffic management and planning.
Roosevelt Blvd Transit
3 Improve highway access for goods movement. 4 Improve pedestrian connections across major rights-of-way.
4.4
Sidewalk
Bike Lane
Travel Lane
Curb Extension or BumpOut and Parking
Sidewalk
Cultural Corridor Transit !
West Market Transit Station
Route 36 Extension
14
!
Delaware Waterfront Transit
Broad Street Line Extension to Navy Yard
Airports, Seaports, and Freight Rail
Enhance the city and regional economy by reinforcing airports, seaports, and freight rail 1 Strengthen the airports’ global and local connections. 2 Elevate the competitive position of Philadelphia ports on the Eastern Seaboard. 3 Modernize freight rail assets to ensure efficient goods movement to and through Philadelphia.
Philadelphia2035
5 Utilities Public and private utility companies and City agencies process and distribute energy, information, water, heating and cooling, and handle the disposal and recycling of wastewater and solid waste for Philadelphia’s residents and businesses. This is accomplished through a vast infrastructure of cables, conduits, pipes, sanitary- and storm-sewer lines, transmitters, signals, vehicles, buildings, tanks, and wireless infrastructure. Some of these systems rely on infrastructure that is literally hundreds of years old (e.g., some sewer and water lines), whereas other infrastructure is new and changing rapidly (e.g., best management practices for stormwater and technology innovations).
How society consumes and conserves energy and nonrenewable resources is a topic of much concern. Cities, by design, are significant and efficient consumers. The consumer base is large, but there is potential for efficient utility networks because of density of development. Like many older cities that experienced the greatest growth during the late-19th and early-20th centuries, Philadelphia has a dense core surrounded by less-dense, more recent development. The denser areas offer opportunity for efficient delivery of services, but are typically where older infrastructure exists. Conversely, newer infrastructure is located in places where the development is more sprawling. As the objectives in this section demonstrate, utility users in Philadelphia will benefit greatly from utility efficiency measures, reduction and reuse of resources, investment in emerging energy-reduction innovations, and strategic investment in utility infrastructure upgrade and expansion.
5.1
Consumption, Capacity, and Condition Provide environmentally supportive, affordable, and reliable utility service to all customers
1 Reduce electric, gas, and water consumption to reduce financial and environmental costs. 2 Achieve reductions in waste through reuse, recycling, and composting of solidwaste materials. 3 Ensure adequate utility capacity to serve customers. 4 Modernize and bring the condition of existing utility infrastructure to a state of good repair.
5.2
Broadband Infrastructure Reinforce access to and use of broadband telecommunications infrastructure as a vital public utility
1 Prepare a long-term plan for maintenance and use of City-owned broadband infrastructure and wireless assets. 2 Expand affordable access to broadband and promote digital literacy programs among low-income populations of the city. 3 Encourage technical innovation and recruitment of high-tech businesses.
Reduction of Solid Waste Entering Landfills
1.55 million tons 70% reduction 2009
Household Internet Adoption Rates Across Philadelphia
465,000 tons
2015
723,000 tons 140,000 tons
Total Waste Disposed Outside of City
City of Philadelphia Waste Disposed Outside of City
Percentage of Households Subscribing to Broadband Internet Services 69% - 100% 62% - 68%
(Source: Philadelphia Streets Department, 2010)
51% - 61% 39% - 50% 0% - 38% Knight Foundation, 2010. U.S. Census Block Groups, 2000. Map prepared by Charles Kaylor, Department of Geography and Urban Studies, Temple University.
Citywide Vision Summary
15
RENEW >
Philadelphians RENEW valuable resources to sustain a bright future.
6 Open Space Open space in Philadelphia assumes many forms from watershed parks to urban plazas, recreation fields to riverfronts, community gardens to playgrounds. Open space offers many benefits in a dense, urban environment. Well-maintained open spaces can improve the quality of the immediate and regional environment, the health of the neighbors who frequent the spaces, and the local economy by raising the value of nearby properties. Philadelphia has extensive park resources including the Fairmount Park system, recreation properties, and national and state parks. The largest parks in the Fairmount Park system were created as protective watersheds for the city’s seven principal waterways. Recreation trails and park destinations have developed within these watershed parks. In addition, 142 neighborhood parks and 160 recreation centers and playgrounds serve Philadelphia residents across the city. Together,
park and natural resources account for over 10,000 acres, or 12 percent of Philadelphia’s land resources. The Department of Parks and Recreation is responsible for the provision and maintenance of park and recreation facilities in Philadelphia, with support from local advocacy groups and community development corporations, ensuring accessibility to and connectivity within our natural systems. Many of the recommendations are related to improving and creating connections between our watershed parks with new or improved trails. In some cases, park-based trails need gaps filled to create a complete system. New greenways offer potential to transform the way Philadelphians recreate and move across the City, from river to river, park to park. Our riverfronts will continue to develop into thriving places with various uses and increasing access to them. Neighborhood parks and recreation facilities are emphasized as important resources to be located within a comfortable walking distance for each Philadelphian.
6.1
Watershed Parks and Trails Complete, expand, and connect watershed parks and trails in the city and the region
1 Create a citywide trails master plan to coordinate the planning and construction of trail systems within Philadelphia. 2 Create a corridor network that connects parks, neighborhoods, and trails citywide. 3 Connect citywide parks to the existing protected natural areas of the regional greenspace network.
6.2
Waterfronts Create improved access to our waterfronts
1 Improve and increase waterfront recreation opportunities. 2 Expand use of rivers for passenger transportation.
6.3
Neighborhood Parks and Recreation Expand access to neighborhood parks and recreation
1 Ensure that all Philadelphians live within a 10-minute walk of a neighborhood park or a recreation center.
Accessibility to Existing Public Open Space Greater than One Acre
2 Connect neighborhood parks and trails to neighborhood centers and major public facilities.
Trail Gaps to be Completed
e e
e
h d
a
e e Existing public open space greater than one acre
16
b c
b
Airport High-population areas particularly underserved by open space
3 Ensure proper maintenance and vibrancy of park and recreation facilities.
a b c d
Delaware Waterfront Trail East Coast Greenway Tidal Schuylkill Trail Upper Schuylkill Trail
e Watershed Park Trails (multiple locations) f North Delaware Trail g Ivy Ridge Trail
Philadelphia2035
7 Environmental Resources Renewing our environmental resources is essential to the health of our city and region. In today’s world we can be called to do no less. The recommendations in Philadelphia2035 build upon the environmental goals set in Greenworks Philadelphia (2009) established by the Mayor’s Office of Sustainability, and anticipate meeting even more ambitious goals by 2035. During the 19th century, Philadelphia’s ability to harness water on the Schuylkill River at the Fairmount Water Works and to access to Pennsylvania’s coal and oil, enabled the city to grow to an industrial powerhouse. Today, however, with increased uncertainty about energy prices,
supply, and impacts, Philadelphia can compete for new residents and investment by reducing our energy consumption and diversifying our energy supply. We should continue to increase our energy efficiency and seek out renewable energy sources. As Philadelphia becomes less dependent on carbon-based energy sources the promise for new types of jobs and businesses will help to build our economy and distinguish Philadelphia as a 21stcentury city.
7.1
Air Quality Improve air quality within the city and the region
1 Reduce overall and per capita contributions to air pollution. 2 Reduce overall and per capita greenhouse gas (GHG) emissions by 45 percent by 2035. 3 Reduce air temperature during the warm season in the city.
7.2
Water Quality Improve the quality and management of our water and wetland resources
1 Improve the quality of city and regional water sources. 2 Restore and create urban stream banks and tidal wetlands along watersheds.
Benefits of Tree Planting
tree photosynthesis and carbon sequestration
3 Support stormwater regulations set by the Philadelphia Water Department to capture stormwater on site and reduce flooding damage.
O2
CO2
• Improved air quality • Increased energy savings
7.3
• Improved traffic safety • Increased real-estate values
NOx CO2
• Increased sociological benefits
O3 SO2 pollution
Tree Cover
Increase tree coverage equitably across the city 1 Increase the overall tree canopy across the city to 30 percent.
stormwater
2 Enhance the city’s forests to create a total of 7,200 acres.
K N P
3 Support tree planting and stewardship within the city.
Impervious Surfaces and Tree Cover 52% of Philadelphia is covered by impervious surfaces.
While tree canopy covers 19.6% of the City’s land area, only 11% of Philadelphia’s census tracts have a tree cover of 30% or more.
70%
1%
46%
Percentage of 30% tree canopy, by census tract
Percentage of impervious surface, by census tract
0%
95% (Source: TreeVitalize, 2001; PPR, 2010; University of Vermont, 2010)
Citywide Vision Summary
(Source: TreeVitalize, 2001; PPR, 2010; University of Vermont, 2010)
17
8 Historic Preservation Philadelphia has a rich history reflected in our buildings, neighborhoods, and culture. By recognizing and protecting our historic and cultural sites, Philadelphia is investing in its future. Historic preservation is a valuable planning tool for protecting Philadelphia’s important resources. The various architectural, historic, and cultural resources reflect our multi-faceted past and their protection helps us honor our ancestors’ achievements and daily lives. The products of our collective history foster our sense of well-being and contribute to our creative health. Preservation also offers a sustainable way to approach development. As we become more conscious of our natural and historic resources, the preservation of our built environment allows us to adapt and reuse existing buildings. Encouraging development in the areas that are already built helps preserve the open space and natural areas of the region. Reusing existing buildings saves tons of construction debris from landfills while also ensuring that neighborhoods retain a sense of history.
Investment in our communities’ rich architectural heritage results in unique neighborhoods that have stable property values and diverse populations. As neighborhoods recognize their historic assets, they attract more residents and experience better overall maintenance. There are several methods for preserving the City’s historic and architectural heritage. Listing a building, structure, or district on the Philadelphia Register of Historic Places ensures that it is protected from inappropriate alterations or demolition. The National Register offers incomeproducing properties a 20 percent tax credit on rehabilitation projects. Programs that help homeowners maintain and preserve their properties encourage investment.
8.1
Cultural, Historical, and Architectural Resources Support sensitive development that preserves and enhances Philadelphia’s multi-faceted past
1 Preserve culturally, historically, and architecturally significant buildings, sites, structures, and districts. 2 Rehabilitate abandoned industrial infrastructure for new uses and reuse industrial buildings to create new neighborhood anchors. 3 Preserve and reuse all “at risk” historic anchor buildings and commercial corridor buildings. 4 Protect archaeological sites. 5 Ensure maintenance and management of cemeteries and religious properties. 6 Preserve historically significant view sheds and landscapes. 7 Preserve cultural and ethnic traditions, places, and resources.
8.2
Heritage Tourism Expand tourism programs to highlight Philadelphia’s cultural and historic heritage and to increase spending on heritage tourism
1 Create new and enhance existing tourism programs based on various cultural experiences unique to Philadelphia. 2 Demonstrate sustainable practices in visitor activities and facilities.
Historic Properties and Districts
d
a b c d e
a m l b h
k i c e
f g
g f
Historic Street Paving
j
National Register Historic District Local and National Historic Site Philadelphia Registered Historic District
h i j k l m
Awbury Arboretum Diamond Street Girard Estate Greenbelt Knoll League Island Park (aka FDR Park) Old City Park Mall (Temple University’s Campus) Parkside Rittenhouse (Fitler Residential) Society Hill Spring Garden Tudor East Falls East Logan Street
Properties on the Philadelphia Register of Historic Places
2,288
9,737
Properties within Philadelphia’s registered historic districts Individually designated properties, not in historic districts Note: Numbers include individual condo units (Source: Philadelphia Historical Commission, 2010)
18
Philadelphia2035
9 Public Realm The public realm consists of all of the spaces and places where Philadelphians have shared encounters each day. Sidewalks, streets, parks, and plazas are the areas where we can come together, socialize, intermingle, and experience the city. The physical surroundings that define our public realm contribute to creating a sense of place and a quality of life that is unique to Philadelphia. The grid plan that William Penn created for Philadelphia set a pattern of development that we treasure today. The neat rows of streets creating small blocks for development were first imagined when walking was the primary mode of transportation. This rhythm of blocks allowed Philadelphia to grow in a regulated way that facilitated construction and circulation through the city. It was not until the advent of the automobile that street design began to change. In the mid-20th century, cul-de-sacs and curvilinear streets became fash-
ionable, but this suburban model of development often removes the walkable scale and limits our means of transportation. Penn’s original plan also offered a balance between private property and public lands. The five original squares afforded residents open space to escape the dense surrounding development and to come together to play, celebrate, and commune in a natural setting. Well-designed parks and recreation spaces offer Philadelphians locations to have shared neighborhood interactions that foster greater community and better overall health. Many elements affect the public realm: height and massing of buildings along the street; length and width of the street and sidewalks; landscaping and natural features; lighting; and, of course, the overall condition of these elements.
9.1
Development Patterns Enhance and improve the walkable form with buildings and spaces that have appropriately scaled heights, massing, and setbacks
1 Preserve the walkable scale of the city. 2 Ensure that new development reinforces the urban scale.
9.2
Urban Design Elevate public demand for good design in the public realm
1 Apply sound design principles to guide development across the city. 2 Create welcoming, well-designed public spaces, gateways, and corridors. 3 Link public art with major capital initiatives. 4 Ensure maintenance and protection of public works of art.
Landmark Gateways
Clothespin Large-scale Gateway
(Source: Office of Arts, Culture, and the Creative Economy)
Successful Needs Enhancement Small-scale Gateway Successful Needs Enhancement
Citywide Vision Summary
19
> MAKING IT HAPPEN Implementation: Next Steps The recommendations of the Citywide Vision are a significant portion of Philadelphia2035, but are only its first phase. Phase two is preparation of 18 District Plans, which will take an additional five years and result in specific land-use and capital-investment recommendations. Together with the work of the Zoning Code Commission and the Citizens Planning Institute, these efforts constitute the “Integrated Planning and Zoning Process.” >> District Plans Each of the 18 districts is larger than an individual neighborhood, but smaller than whole quadrants of the city. District Plans will concentrate on such issues as major development opportunities, redevelopment of vacant land and buildings, areas in transition, transit-oriented development, neighborhood centers, community facilities, and community needs, all in relation to specific character and growth patterns. A key product will be a recommended land-use plan for each district, which will be used as the basis for recommending zoning map revisions in a subsequent phase. >> Citizens Planning Institute The Citizens Planning Institute (CPI) is a new organization through which the PCPC can engage with and inform citizens about planning principles, proDistrict Plans’ Schedule Upper Far Northeast Lower Far Northeast Central Northeast
Lower Northwest
Upper Northwest
Upper North
North West Park
Lower North
West University/ Southwest
Lower Southwest
20
Lower Northeast
North Delaware
River Wards
Central South Lower South
Fall Year 1 Year 2 Year 3 Year 4 Year 5 Spring Year 6
vide a common language to discuss issues, and increase the capacity of civic organizations to participate in planning their communities. >> Zoning Code Reform Philadelphia’s first zoning code was enacted in 1933. The last major revision of the code was completed in 1962. Since then, over 1,000 piecemeal amendments have made the zoning code an overly complex and burdensome regulatory document. A voters’ referendum created the Zoning Code Commission (ZCC) in 2007 and charged it with the task of rewriting the code. After three years of collaboration among stakeholders, the ZCC produced a draft zoning code intended to yield predictable development results, encourage positive development, preserve the character of neighborhoods, and involve the public in development decisions. The ZCC presented the draft zoning code to City Council in May 2011 and completed a zoning map revision plan outlining a two-step remapping process. The PCPC will manage a collaborative process to recommend map revisions within each district following preparation of each District Plan, beginning in late 2011. Changes to the zoning maps is a legislative process, will occur only where needed, and will include considerable community input. >> Responsible Agencies Philadelphia2035 will be implemented by dozens of stakeholders. As the facilitator of the inter-agency collaboration that resulted in the production of the Citywide Vision, the PCPC is positioned to take on a continuing role in coordinating plan implementation. This responsibility will involve working closely with members of the Philadelphia2035 Advisory Board and Working Group to follow through on recommendations.
Stakeholders and responsible agencies for implementation may extend beyond City agencies depending on the nature and scope of the strategy. Regional, state, and federal government agencies and quasi-governmental organizations will be involved in project coordination, funding, and execution. >> Partner Organizations Although many of the strategies and objectives outlined in Philadelphia2035 can only be fully implemented by government, nonprofit and community organizations do have roles. Individuals and civic associations can perform activities and support programs that help implement the Citywide Vision, such as: THRIVE • Work with a local business association or improvement district to help beautify commercial area. • Partner with nonprofits to support a neighborhood farmers' market or establish and maintain community gardens. CONNECT • Advocate for complete streets, and help educate drivers, cyclists, and pedestrians about the rules of the road. • Promote recycling in the neighborhood and the City’s Recycle Rewards program. RENEW • Create/support a “Friends” group for a neighborhood park. • Nominate and support the designation of historic resources in the neighborhood.
Philadelphia2035
Benefits and Measures In preparing Philadelphia2035, the PCPC committed to charting a measurable and accountable course for physical development over the next 25 years. The Citywide Vision’s 73 objectives can be mapped, measured, and otherwise analyzed by either the PCPC staff or partner agencies and organizations. Focusing on these objectives operationally will help the City make progress toward the specific goals of the plan, as well as achieve the following benefits to our economy, health and well-being, and environment:
>> Economic Benefits Improvements in economic and fiscal vitality will generate jobs, income, wealth, taxes, and competitive services: • Increased tax base, as measured by tax rates, bond ratings • Increased property values, as measured by total market value • Improved land utilization, as measured by vacancy amounts and rates
>> Health and Well-being Benefits Improvements to the built environment will provide equitable access to services and reduce barriers to healthy living:
>> Environmental Benefits Improvements to natural and man-made systems will enable safe and healthful conditions for the current and future population:
• Increased access and opportunity, as measured by percent of Philadelphians within adequate distance of public facilities, healthy food sources, open space amenities, and transportation infrastructure
• Improved air quality, as measured by groundlevel ozone, particulate matter, air-quality index • Improved water quality, as measured by multiple EPA standards
• Improved transportation safety, as measured by number of traffic-related injuries and fatalities
• Improved state of repair, as measured by percent of assets in good repair
• Increased resilience to natural hazards, as measured by hazard incidence and impacts, changing risks over time
• Improved affordability, as measured by housing and transportation costs as percentage of income
• Reduced travel times, as measured by commute times, travel delays • Reduced poverty, as measured by percent of people in poverty
• Reduced consumption of non-renewable energy, as measured by consumption by source and end use
• Lower rates of chronic disease, as measured by percent of Philadelphians selfreporting asthma, hypertension, and other chronic diseases • Lower rate of obesity, as measured by percent of Philadelphians who are obese
Sample Page from the Objectives Tracking Matrix
Nonrenewable Energy Consumption
Resilience to Natural Hazards
Nonrenewable Air Quality Energy Consumption Water Quality
Resilience to Natural Hazards
Water Quality
Air Quality
Obesity Rate
Chronic Disease
Affordability
Safety
Obesity Rate Access to Opportunities
Poverty
Travel ChronicTimes Disease
Affordability State of Repair
Safety Land Utilization
Access to Property Value Opportunities
Poverty Tax Base
ECONOMIC HEALTHBENEFITS AND WELL-BEING BENEFITS HEALTH AND WELL-BEING BENEFITS ENVIRONMENTAL BENEFITS ENVIRONMENTAL MEASURES BENEFITS AND INDICATORSMEASURES
Travel Times
State of Repair
Land Utilization
ECONOMIC BENEFITS
Property Value
OBJECTIVE
Tax Base
OBJECTIVE
Centralize land management 3.1.1 in a single Centralize City agency land management to track in a single City agency to track and dispose of surplus land and structures and dispose and return of surplus publiclyland and structures and return publicly owned vacant parcels to taxable status. owned vacant parcels to taxable status.
Total vacant land acreage or # of parcels/structures Total vacant lan Number of ways to purchase City landNumber of way Number of vacant properties sold by city Number annually of vaca
.1.2
Prevent abandonment of land 3.1.2 and structures. Prevent abandonment of land and structures.
Number of property forclosures Number of prop Number of vacant properties registered Number of vaca Amount collected in taxes and fees forAmount vacant collect proper
.1.3
Land Management
.1.1
Reuse vacant land and structures ways. 3.1.3in innovative Reuse vacant land and structures in innovative ways.
OBJECTIVE
OBJECTIVE
acreage of vacant land used for parks/stormwater acreage of vaca
ECONOMIC BENEFITS
ECONOMIC HEALTHBENEFITS AND WELL-BEING BENEFITS HEALTH AND WELL-BEING BENEFITS ENVIRONMENTAL BENEFITS ENVIRONMENTAL MEASURES INDICATORSMEASURES MoneyBENEFITS spent onAND remediation/feasibility Money studies spent for on re
Transportation
Nonrenewable Energy Consumption
Square feet of impervious surface in Square flood plains feet of Number stormwater mitigation projects Number stormw Square feet impervious surface steep Square slopes feet imp
Resilience to Natural Hazards
Air Quality Nonrenewable Energy Consumption Water Quality
Resilience to Natural Hazards
Water Quality
Air Quality
Obesity Rate
Chronic Disease
Affordability
Safety
Number of developments within identifi Number ed TODofboun deve Density of development within 21 TOD boundaries Density of deve Ridership on TOD-serving transit linesRidership on TO
Obesity Rate Access to Opportunities
Coordinate land-use decisions 4.1.3withCoordinate existing and land-use planned decisions with existing and planned transit assets to increase transportation transitchoices, assets to decrease increase transportation choices, decrease Citywide Vision Summary reliance on automobiles, increase access reliance to jobs, on automobiles, goods, and increase access to jobs, goods, and services, and maximize the economic, services, environmental, and maximize and the economic, environmental, and public health benefits of transit. public health benefits of transit.
Chronic Travel Times Disease Poverty
.1.3
Affordability State of Repair
Linear miles of net new track/total route Linear miles miles of Money received through New Starts, Money EDA/HUD/DOT received Number of feasibility studies, engineering, Number andofdesig feas
Safety Land Utilization
Extend and introduce new technological to thenew technological advances to the 4.1.2 Extend advances and introduce transit network to serve new markets.transit network to serve new markets.
Access to Property Value Opportunities
.1.2
Poverty Tax Base
Invest in existing infrastrucuture 4.1.1 to improve Investservice in existing andinfrastrucuture attract to improve service and attract riders riders
Travel Times
.1.1
State of Repair
Reduce expenditures for municipal facilities. 3.3.1 support Reduce expenditures for municipal support facilities.
Land Utilization
.3.1
Property Value
Use topography to direct land 3.2.1 development. Use topography to direct land development.
Tax Base
.2.1
Number of facilities consolidated/co-located Number of facil Number of state of good repair Number of stat Building energy cost reduction from effi Building ciency energy project
Percent of system in state of good repair Percent of syste Money spent/committed to projects toMoney improve spent/co existi System ridership and percent of modeSystem share captured ridershi
Priorities and Cost Estimates
Recommendations in Philadelphia2035 are presented with the intention of phased implementation over a 25-year period. This approach advances projects that are relatively easy and less costly to accomplish, and schedules projects later in the 25 years that need a long lead time to plan, design, and fund.
>> Phased Implementation of Strategies The recommendations of Philadelphia2035 are organized according to the time frame or phase of implementation: short, medium, and long term. Recommendations slated to be implemented within five years are categorized as short term. They are generally projects that are already “in the pipeline” or policy oriented, requiring a one-time policy change. The City intends to align short-term projects that have capital and/or operating budget implications with its six-year Capital Program and/or Five-Year Plan, respectively.
tion of Philadelphia2035 becomes manageable and can serve as a complementary guide for the City’s Capital Program. The strategies, phasing, and estimated costs are shown in the Strategies Cost Matrix in the full Citywide Vision document. The costs are good-faith estimates determined by the PCPC in collaboration with the agencies responsible for implementation. Not all projects lend themselves to hard costs.
Medium-term projects are those that are scheduled to be implemented in the six- to 15-year time frame. These projects need significant momentum to get started, in terms of planning, design, and assemblage of funding and other resources to implement. Long-term projects will be implemented in the 16- to 25-year time frame, and beyond. These are typically infrastructure-heavy, expensive capital projects that utilize funding from multiple sources and levels of government. In some cases, longterm projects rely on successful implementation of short- or medium-term projects to proceed. Many strategies are not simply one-time investments, but require ongoing attention for continued operation. Also, many strategies call for programs that require additional staffing. These on-going operating costs reflect the costs of hiring and maintaining those staff positions. >> Cost Estimating Implementation of the strategies of Philadelphia2035 is an expensive proposition. The City will need to target its own capital and operating funds wisely through the years and work creatively with relevant government agencies, at the state and federal levels, and with private-sector and institutional partners to secure necessary funding. Despite estimated capital costs in excess of $40 billion, by Phasing projects over 25 years and among numerous funding sources, implementa-
22
PHILADELPHIA
2 35 and
YOU
if you are a
if you are a
Resident or Business Owner
Developer, Architect, or Builder
you may want to:
you may want to:
• • • • • •
• Purchase real estate • Decide whether it is most appropriate to reuse or construct new buildings in a given location • Identify likely hot spots for new development • Understand the City’s development priorities • Align your design/development ideas with city goals • Participate in meetings for District Plans
Expand, start, or relocate a business Purchase real estate Renovate an existing building Improve a local park Find a suitable location for a community garden Attract a new business or service to your neighborhood center • Verify whether a proposed development in your neighborhood is in line with city goals and objectives • Participate in meetings for District Plans • Register for the Citizens Planning Institute
if you are a
City Administrator or Public Employee you may want to:
• • • • • • • •
Identify areas well positioned for growth Protect constituents from unwanted land uses Strengthen or grow a neighborhood center Determine how to maximize return on public investment Pursue state/federal money for infrastructure projects Target City capital funds Participate in meetings for District Plans Advance priorities for healthy communities
Philadelphia2035
City of Philadelphia Honorable Michael A. Nutter, Mayor Alan Greenberger, Deputy Mayor for Economic Development
Philadelphia City Planning Commission Alan Greenberger, FAIA, Chairman Joseph Syrnick, Vice-Chairman Rob Dubow Patrick Eiding Bernard Lee, Esq.
Elizabeth K. Miller Richard Negrin Nilda Iris Ruiz, MBA Nancy Rogo Trainer, AIA, AICP
Gary J. Jastrzab, Executive Director
Philadelphia2035 is supported, in part, with funds granted from the William Penn Foundation to the Fund for Philadelphia, Inc. This document was printed on FSC-certified paper using soy inks.
Philadelphia City Planning Commission 1515 Arch Street, 13th Floor Philadelphia, PA 19102 215.683.4615 www.philaplanning.org www.phila2035.org June 2011
PHILADELPHIA CITY PLANNING COMMISSION
PCPC Citywide Vision Summary
23