Cigarette Smoking Is Associated with Subclinical Parenchymal Lung Disease The Multi-Ethnic Study of Atherosclerosis (MESA)–Lung Study David J. Lederer1, Paul L. Enright2, Steven M. Kawut3,4, Eric A. Hoffman5, Gary Hunninghake6, Edwin J. R. van Beek5, John H. M. Austin7, Rui Jiang1,8, Gina S. Lovasi8,9, and R. Graham Barr1,8 1
Department of Medicine, and 7Department of Radiology, College of Physicians and Surgeons, 8Department of Epidemiology, Mailman School of Public Health, and 9Institute of Social and Economic Research and Policy, Columbia University, New York, New York; 2Department of Medicine, University of Arizona, Tucson, Arizona; 3Center for Clinical Epidemiology and Biostatistics, and 4Department of Medicine, University of Pennsylvania School of Medicine, Philadelphia, Pennsylvania; and 5Department of Radiology, and 6Department of Medicine, Carver College of Medicine, University of Iowa, Iowa City, lowa
Rationale: Cigarette smoking is a risk factor for diffuse parenchymal lung disease. Risk factors for subclinical parenchymal lung disease have not been described. Objectives: To determine if cigarette smoking is associated with subclinical parenchymal lung disease, as measured by spirometric restriction and regions of high attenuation on computed tomography (CT) imaging. Methods: We examined 2,563 adults without airflow obstruction or clinical cardiovascular disease in the Multi-Ethnic Study of Atherosclerosis, a population-based cohort sampled from six communities in the United States. Cumulative and current cigarette smoking were assessed by pack-years and urine cotinine, respectively. Spirometric restriction was defined as a forced vital capacity less than the lower limit of normal. High attenuation areas on the lung fields of cardiac CT scans were defined as regions having an attenuation between 2600 and 2250 Hounsfield units, reflecting ground-glass and reticular abnormalities. Generalized additive models were used to adjust for age, gender, race/ethnicity, smoking status, anthropometrics, center, and CT scan parameters. Measurements and Main Results: The prevalence of spirometric restriction was 10.0% (95% confidence interval [CI], 8.9–11.2%) and increased relatively by 8% (95% CI, 3–12%) for each 10 cigarette pack-years in multivariate analysis. The median volume of high attenuation areas was 119 cm3 (interquartile range, 100–143 cm3). The volume of high attenuation areas increased by 1.6 cm3 (95% CI, 0.9–2.4 cm3) for each 10 cigarette pack-years in multivariate analysis. Conclusions: Smoking may cause subclinical parenchymal lung disease detectable by spirometry and CT imaging, even among a generally healthy cohort. Keywords: cigarette smoking; computed tomography; interstitial lung disease; restrictive lung disease; spirometry
(Received in original form December 31, 2008; accepted in final form June 12, 2009) Supported by National Institutes of Health R01-HL077612, R01-HL075476, N01HC95159–165, N01-HC95169, K23-HL086714, KL2-RR024157, the Robert Wood Johnson Physician Faculty Scholars Program, the Robert Wood Johnson Foundation Health and Society Scholars Program, and the Herbert and Florence Irving Scholar Award. The MESA and MESA-Lung Studies were conducted and supported by the NHBLI in collaboration with the MESA and MESA-Lung Investigators. This manuscript has been reviewed by the MESA investigators for scientific content and consistency of data interpretation with previous MESA publications and significant comments have been incorporated prior to submission for publication. A full list of participating MESA investigators and institutions can be found at http://www.mesa-nhlbi.org. Correspondence and requests for reprints should be addressed to R. Graham Barr, M.D., Dr.P.H., Columbia University Medical Center, 630 West 168th Street, PH 9 East - Room 105, New York, NY 10032. E-mail:
[email protected] This article has an online data supplement, which is accessible from this issue’s table of contents at www.atsjournals.org Am J Respir Crit Care Med Vol 180. pp 407–414, 2009 Originally Published in Press as DOI: 10.1164/rccm.200812-1966OC on July 16, 2009 Internet address: www.atsjournals.org
AT A GLANCE COMMENTARY Scientific Knowledge on the Subject
Cigarette smoking is a risk factor for some idiopathic interstitial pneumonias, and current smokers have a higher prevalence of spirometric restriction. There are no population-based cohort studies examining the association between cigarette smoking and increased lung density on computed tomography (CT). What This Study Adds to the Field
Smoking may cause subclinical parenchymal lung disease detectable by spirometry and CT imaging.
The diffuse parenchymal lung diseases (DPLDs) are characterized by fibrosis and inflammation of the lung parenchyma, areas of high attenuation on computed tomography (CT) scan, and reduced FVC (1). Although some DPLDs are treatable, the most common idiopathic form of DPLD, idiopathic pulmonary fibrosis (IPF), has no proven therapies and carries a uniformly high mortality rate (2, 3). Identification of risk factors for IPF and other DPLDs might allow for the development of preventative strategies. Cigarette smoking is a putative risk factor for some of the idiopathic interstitial pneumonias. For example, case series and clinical experience suggest that desquamative interstitial pneumonia and respiratory bronchiolitis-associated interstitial lung disease are strongly linked to cigarette smoking (4, 5). Cigarette smoking has also been associated with a greater risk for IPF in some (6–10) but not all studies (11, 12). Each of these studies is limited by casecontrol design and largely unadjusted analyses. Most also preceded the modern understanding of this disease (2, 6–8, 11, 12). Asymptomatic, early parenchymal lung disease has been increasingly recognized and reported in family members of affected individuals (10, 13–16). To date, however, only one population-based study has examined risk factors for subclinical parenchymal lung disease. In the U.S. National Health and Nutrition Examination Survey (NHANES) I, current smokers had an increased risk for spirometric restriction (reduced FVC in the absence of airflow obstruction) compared with never smokers, but former smokers had no increased risk; associations with cumulative smoking (pack-years) were not reported (17). Although suggestive, spirometric restriction has many possible causes, only one of which is parenchymal lung disease. In recent years, CT imaging has become the gold standard noninvasive test to diagnose DPLD (1). Unlike spirometry, CT imaging of the lungs has not generally been available in population-based cohorts, despite the development of powerful
408
AMERICAN JOURNAL OF RESPIRATORY AND CRITICAL CARE MEDICINE VOL 180
tools for quantitating parenchymal lung disease noninvasively with CT (18). The Multi-Ethnic Study of Atherosclerosis (MESA) is a population-based prospective cohort study that enrolled older adults without clinical cardiovascular disease. MESA participants underwent cardiac CT scanning that imaged most of the lung parenchyma, offering the opportunity to identify risk factors for subclinical parenchymal lung disease. Therefore, we examined the relationships between cigarette smoking, spirometric restriction, and increased lung attenuation by CT imaging in MESA. We hypothesized that a greater number of pack-years of cigarette smoking would be associated with a higher prevalence of spirometric restriction and a greater volume of high CT attenuation in the lung parenchyma independent of obesity and other potential confounding factors in participants without evidence of airflow obstruction. Some of the results of this study have been previously reported in the form of an abstract (19).
METHODS MESA MESA is a multicenter prospective cohort study to investigate the prevalence, correlates, and progression of subclinical cardiovascular disease in individuals without clinical cardiovascular disease (http:// www.mesa-nhlbi.org) (20). In 2000 to 2002, MESA recruited 6,814 men and women aged 45 to 84 years old from six United States communities: Forsyth County, NC; northern New York County and Bronx County, NY; Baltimore City and Baltimore County, MD; St. Paul, MN; Chicago, IL; and Los Angeles, CA. MESA participants are white, African American, Hispanic, or Asian (mostly of Chinese origin). Exclusion criteria included clinical cardiovascular disease, weight greater than 136 kg, any impediment to long-term participation, and chest CT within the past year. The protocols of MESA and all studies described herein were approved by the Institutional Review Boards of all collaborating institutions and the National Heart, Lung, and Blood Institute.
The MESA-Lung Study The MESA-Lung Study enrolled 3,965 of 4,484 eligible MESA participants who had consented to genetic analyses, undergone baseline measures of endothelial function, and attended an examination during the MESA-Lung recruitment period in 2004 to 2006 (Figure 1). Chinese Americans were over-sampled to improve the precision of estimates for this group. In the current study, we excluded 72 participants who did not complete spirometry, 180 with less than two acceptable spirometry maneuvers, 231 who did not reach a volume-time plateau, 756 with airflow obstruction (an FEV1/FVC ratio less than 0.70), and 163 with incomplete data for pack-years or cotinine.
2009
using a modified version of the Pulmonary Analysis Software Suite (26–29) at a single reading center by trained readers without knowledge of smoking history. Scanner calibration methods in MESA for coronary calcium have been previously published (25) and are described in the online supplement. To account for variation in scanner calibration at 21,000 Hounsfield units (HU), attenuation of air outside the body was measured for each scan and the attenuation of each pixel was corrected to have the value: (21,000 3 measured pixel attenuation)/mean air attenuation.
CT Definition of Subclinical Parenchymal Lung Disease We are not aware of an established definition of either DLPD or subclinical parenchymal lung disease using quantitative CT measures. Therefore, we defined subclinical parenchymal lung disease as high attenuation areas (HAAs) within the lung fields having a CT attenuation value between 2600 and 2250 HU (Figure 2). This range of CT lung attenuation includes ground-glass and reticular abnormalities and is low enough to clearly exclude more dense areas, such as complete atelectasis, medium and large blood vessels, and pulmonary nodules, which are all more dense than water (HU of 0) (30, 31). The intraclass correlation coefficient of HAA among the 100% replicate CT scans was 0.93 (n 5 2,653). We validated HAA expressed as a percentage of the total lung volume imaged on cardiac CT scans against full-lung CT scans in 42 MESA participants. The Spearman correlation coefficient of HAA between cardiac and full-lung scans was 0.87 and the mean difference was 0.2% (95% limits of agreement 22.5 to 13.0%). A board-certified thoracic radiologist and a board-certified pulmonologist independently reviewed the lung fields of 101 CT scans sampled randomly among participants with greater than 10% HAA by volume (95th percentile of HAA) and less than 10% HAA. Reviewers were blinded to the HAA values of the scans and were not permitted to quantify voxel attenuation using imaging software.
Statistical Analysis For descriptive purposes, the cohort was stratified by pack-years of cigarette smoking. We estimated prevalence ratios using Poisson regression with robust standard errors in generalized linear models (32). All continuous variables had linear relationships with the natural log prevalence of spirometric restriction. For the lung attenuation analysis, generalized additive models with loess smoothing functions for continuous variables were used to allow for the flexible specification of relationships and to minimize misspecification of potential confounding variables. The volume of HAAs was regressed on pack-years controlling for the total volume of imaged lung and other covariates. We chose this approach instead of expressing HAA as a percentage of the imaged lung volume because the latter approach specifies the dependent variable as a ratio, which may induce spurious correlations (33). Statistical significance was defined as two-tailed P values less than 0.05. Analyses were performed using SAS 9.1 (SAS Institute, Cary, NC) and the gam function in R 2.6 (R Foundation, Vienna, Austria).
Spirometry Spirometry was performed according to American Thoracic Society/ European Respiratory Society guidelines (see online supplement) (21). We defined spirometric restriction as an FVC less than the lower limit of normal according to NHANES III race-specific reference equations (22). Because references equations for Asian Americans were not available from the NHANES III study, we used a 0.88 correction factor for the predicted FVC for Chinese Americans (23).
Lung Attenuation on CT Scan Quantitative measures of lung attenuation were performed on the lung fields of MESA cardiac CT scans, which image approximately 70% of the lung volume from the carina to lung bases (24). CT scans were performed during the years 2000 to 2002 on multidetector CT scanners (three sites) and electron beam tomography scanners (three sites) using a standardized protocol (25). Two sequential scans on separate breathholds were performed in succession at full inspiration on each participant. The scan with higher air volume was used for analyses, except in cases of discordant scan quality control score, in which case the higher-quality scan was used (24). Image attenuation was assessed
RESULTS The mean age of the 2,563 participants was 64 6 9 years, and 44% were men. Thirty-three percent were white, 24% were African American, 25% were Hispanic, and 18% were Chinese American. Eight percent were current and 37% were former smokers, with a median number of cigarette pack-years of 15 (interquartile range 5–31). Participants with heavier smoking histories were more likely to be white, male, and obese (Table 1). Spirometric Restriction
The prevalence of spirometric restriction was 10.0% (95% confidence interval [CI], 8.9–11.2%) overall and was highest among the heaviest smokers (Table 2). After adjustment for demographics, the prevalence of spirometric restriction increased by 10% for every 10 cigarette pack-years smoked (95% CI, 7–14%). Additional adjustment for smoking status,
Lederer, Enright, Kawut, et al.: Smoking and Subclinical ILD
409
Figure 1. Participants in the Multi-Ethnic Study of Atherosclerosis–Lung study included in the present analysis.
urine cotinine level, and anthropometrics did not meaningfully change this association. The nonlinear model (Figure 3A) did not fit the data better than the linear model, suggesting that the relationship between pack-years and spirometric restriction was linear. Similarly, a higher urine cotinine concentration was associated with a greater prevalence of spirometric restriction even after adjusting for demographics, cigarette pack-years, and anthropometrics (5% increase in the prevalence of spirometric restriction per 1 mg/ml increase in urine cotinine; 95% CI, 1–9%; Table 3). HAAs
HAA greater than 10% was sensitive and specific for areas of high attenuation suggestive of clinically relevant abnormalities identified by visual readings. Sensitivity of HAA greater than 10% was 81 and 78% compared with qualitative readings by a board-certified thoracic radiologist and board-certified pulmonologist, respectively. Specificity of HAA greater than 10% was 64 and 91%, respectively. Interobserver agreement was 71% and interobserver k was 0.45. After excluding scans with breath artifacts, k was 0.60. Among the 56 scans with greater than 10% HAA, the most common abnormalities detected were
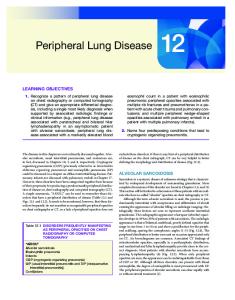
ground-glass opacities or atelectasis (radiologist: 34, pulmonologist: 52), reticular abnormalities (radiologist: 2, pulmonologist: 5), possible or probable usual interstitial pneumonia pattern (radiologist: 6, pulmonologist: 1), definite usual interstitial pneumonia (UIP) pattern (radiologist: 1, pulmonologist: 0), and focal scar (radiologist: 5, pulmonologist: 3). Figure 2 shows histograms of CT lung attenuation and representative CT images of the lungs from three study subjects at the median (119 cm3), 75th percentile (143 cm3), and 95th percentile (202 cm3) of HAA. HAA was greater among those with spirometric restriction compared with those with normal spirometry (age-, sex-, and race-adjusted mean difference of 5.0 cm3, 95% CI 0.1 to 9.9 cm3; P 5 0.04). HAA increased across categories of pack-years (Table 2). After adjusting for demographics, HAA increased by 2.5 cm3 (95% CI, 1.8–3.3 cm3) for each 10 cigarette pack-years. Additional adjustment for smoking status, urine cotinine, and anthropometrics attenuated this association, but it remained significant in the fully adjusted model. The nonlinear model (Figure 3B) did not fit the data better than the linear model, suggesting that the relationship between pack-years and HAA was linear. A fully adjusted model limited to former and never smokers showed similar findings (mean increase of 1.8 cm3 of
410
AMERICAN JOURNAL OF RESPIRATORY AND CRITICAL CARE MEDICINE VOL 180
2009
TABLE 1. CHARACTERISTICS OF 2,563 MULTI-ETHNIC STUDY OF ATHEROSCLEROSIS PARTICIPANTS WITHOUT AIRFLOW OBSTRUCTION Cigarette Pack-Years N No. of subjects Demographics and anthropometrics Age at spirometry, years Men, % Race/ethnicity White, % African American, % Chinese American, % Hispanic, % Height, cm Weight, kg Body mass index, kg/m2 Body mass index category, kg/m2 ,25 25–29.9 30–39.9 >40 Waist circumference, cm Hip circumference, cm Smoking Never smoker, % Former smoker, % Current smoker, % Cigarette pack-years (among ever-smokers) Urine cotinine, mg/ml (among current smokers) Spirometry FEV1, L FEV1, % predicted FVC, L FVC, % predicted FEV1/FVC ratio Forced expiratory time 100%, s Computed tomography Type of CT scanner Multidetector CT Electron beam tomography Total imaged lung volume (gas 1 tissue), cm3 Pulmonary gas volume, cm3 Pulmonary tissue volume, cm3 Emphysema, %* Respiratory diseases† History of respiratory problems before age 16 yr, % Self-reported asthma before the age of 45, % Self-reported pulmonary fibrosis, % Self-reported emphysema, % Self-reported history of tuberculosis, %
0
1–10
11–20
.20
1,444
432
235
452
64 6 10 35
64 6 9 52
64 6 10 54
64 6 9 60
29 22 25 25 163 6 10 75 6 17 28 6 5
32 28 9 31 167 6 10 81 6 17 29 6 6
42 29 8 23 167 6 9 81 6 17 29 6 6
44 28 9 19 168 6 10 84 6 18 30 6 6
32 39 27 2 96 6 14 104 6 11
22 44 29 5 100 6 15 107 6 12
27 44 26 4 98 6 14 106 6 12
22 39 34 5 100 6 14 107 6 12
0 90 10 4 (2–7) 1.0 (0.1–3.1)
0 84 16 15 (3–17) 3.7 (1.5–5.8)
0 75 25 36 (27–50) 5.2 (2.3–9.0)
2.6 98 3.4 97 0.78 11
2.6 98 3.4 96 0.78 11
2.6 94 3.3 93 0.78 11
2,563
2,563 98 2 0
2,563 2.4 98 3.0 96 0.79 10
6 6 6 6 6 6
0.7 15 0.9 15 0.05 2
6 6 6 6 6 6
0.7 16 1.0 16 0.05 3
6 6 6 6 6 6
0.7 17 0.9 16 0.05 3
6 6 6 6 6 6
0.7 16 1.0 16 0.05 3
2,563 66 34 2,510 6 686 2,096 6 633 413 6 83 15 (8–24) 2,531 2,563 2,540 2,563 2,563
6 7 0.1 0.1 0.01
57 43 2,769 6 734 2,325 6 676 443 6 88 17 (10–26) 7 7 0 0.2 0.01
52 48 2,867 6 680 2,410 6 630 457 6 82 18 (9–28) 7 6 0.4 0 0.01
50 50 2,899 6 657 2,417 6 605 482 6 90 15 (8–25) 7 5 0.2 1.8 0.02
Data are mean 6 SD, median (interquartile range), and percentage. * Percent emphysema is the percentage of the total voxels in the whole lung that fell below 2910 Hounsfield units. † Additional self-reported chest diseases are reported in Table E1 in the online data supplement.
HAAs per 10 cigarette pack-years; 95% CI, 1.0–2.7; n 5 2,253). Limiting the fully adjusted model to the subgroup with normal body mass index (20–25 kg/m2) showed similar results (mean increase of 2.8 cm3 of HAAs per 10 cigarette pack-years; 95% CI, 1.5–4.2 cm3; n 5 654). A higher urine cotinine level was also associated with a greater volume of high lung attenuation even after adjusting for demographics, cigarette pack-years, and anthropometrics (mean increase of 2.0 cm3 of HAAs per 1 mg/ml increase in urine cotinine; 95% CI, 1.4–2.7 cm3; Table 3). Additional Analyses
Additional analyses are presented in Table E2 in the online data supplement. Decreased kurtosis and skewness of the lung histogram are characteristically observed in patients with DPLD
and correlate with measures of disease severity (30). In our study, greater cigarette pack-years were associated with decreased kurtosis and skewness (Table E2). We also explored the effect of potential confounders on our results (Table E2). Neither stratification by type of CT scanner nor exclusion of scans of suboptimal quality affected our findings. Exclusion of those with chest wall or pleural disease alone (n 5 39) or those with any self-reported chest disease (n 5 100) did not change our findings. Similarly, exclusion of participants with reduced left ventricular function or wall motion abnormalities; occupational exposure to dusts, gases, or fumes; tricyclic antidepressant use; coronary artery calcification; or obesity led to similar results (Table E2). Inclusion of 350 participants with an FEV1/FVC ratio less than 0.70 but greater than the lower limit of normal gave similar
Lederer, Enright, Kawut, et al.: Smoking and Subclinical ILD
411
TABLE 2. ASSOCIATIONS BETWEEN CIGARETTE PACK-YEARS, SPIROMETRIC RESTRICTION, AND AREAS OF HIGH ATTENUATION ON LUNG COMPUTED TOMOGRAPHY Cigarette Pack-Years
No. of subjects Prevalence of spirometric restriction Prevalence ratios for spirometric restriction Age, sex, and race/ethnicity-adjusted Age, sex, race/ethnicity, smoking status, and urine cotinine-adjusted Full multivariate model HAA volume, cm3* Mean increase in HAA volume, cm3* Age, sex, and race/ethnicity-adjusted Age, sex, race/ethnicity, smoking status, and urine cotinine-adjusted Full multivariate model
Effect Estimate per 10 Pack-Years (95% CI)
0
1–10
11–20
.20
P for Trend
1,444 9%
432 8%
235 9%
452 16%
,0.001
1 (Ref) 1 (Ref) 1 (Ref) 122
0.8 0.8 0.8 130
0.9 0.9 0.8 131
1.6 1.5 1.4 140
0.003 0.02 0.08 ,0.001
1.10 (1.07–1.14) 1.09 (1.05–1.14) 1.08 (1.03–1.12)
,0.001 ,0.001 ,0.001
0 (Ref) 0 (Ref) 0 (Ref)
2.4 2.1 1.0
5.0 3.7 3.3
14.0 10.9 9.2
,0.001 ,0.001 ,0.001
2.5 (1.8–3.3) 2.0 (1.2–2.8) 1.6 (0.9–2.4)
,0.001 ,0.001 ,0.001
P Value
2,563
Definition of abbreviations: CI 5 confidence interval; HAA 5 high attenuation area. Prevalence ratios are from generalized linear models. Mean increases are from generalized additive models with loess smoothers for continuous covariates. Linear estimates are presented. The full multivariate model includes age, sex, race/ethnicity, smoking status, urine cotinine, height, body mass index, hip circumference, and waist circumference. All HAA models are further adjusted for study site, total volume of imaged lung, and milliampere dose. * High attenuation areas (HAAs) are regions of lung with an attenuation between 2600 and 2250 Hounsfield units.
results (22). Inclusion of 715 participants with airflow obstruction did not alter our findings. In a post hoc analysis, the association between pack-years and CT lung attenuation was different for men compared with women. The mean increase in HAA per 10 pack-years was 2.3 cm3 (95% CI, 1.4–3.3 cm3) for men compared with 0.6 cm3 (95% CI, 20.6 to 1.9 cm3) for women (P for interaction 5 0.005) in fully adjusted models. We did not detect a similar gender difference for the association of pack-years with spirometric restriction.
lung abnormalities. Higher HAA and spirometric restriction were both associated with a greater number of pack-years of cigarettes smoked independent of body size, current smoking status, and other potential confounders. Our findings support the hypothesis that cigarette smoking is a risk factor for parenchymal lung abnormalities other than emphysema. Mannino and coworkers previously identified current smoking status as an independent risk factor for spirometric re-
DISCUSSION This is the first study to examine the association between cumulative cigarette smoking and areas of increased lung attenuation on CT in a large population-based cohort. To do so, we defined a novel measure of increased CT lung attenuation, HAA, that accurately predicts the presence of parenchymal TABLE 3. ASSOCIATIONS BETWEEN URINE COTININE, SPIROMETRIC RESTRICTION, AND AREAS OF HIGH ATTENUATION ON LUNG COMPUTED TOMOGRAPHY Effect Estimate (95% CI) per 1 mg/ml Increase in Urine Cotinine No. of subjects Prevalence ratios for spirometric restriction Age, sex, and race/ethnicity-adjusted Age, sex, race/ethnicity, pack-years–adjusted Full multivariate model Mean increase in HAA volume, cm3* Age, sex, and race/ethnicity-adjusted Age, sex, race/ethnicity, pack-years–adjusted Full multivariate model
P Value
2,563 1.07 (1.03–1.11) 1.04 (1.01–1.08) 1.05 (1.01–1.09)
,0.001 0.03 0.02
2.4 (1.7–3.1) 1.8 (1.1–2.5) 2.0 (1.4–2.7)
,0.001 ,0.001 ,0.001
Definition of abbreviations: CI 5 confidence interval; HAA 5 high attenuation area. Prevalence ratios are from generalized linear models. Mean increases are from generalized additive models with loess smoothers for continuous covariates. Linear estimates are presented. The full multivariate model includes age, sex, race/ethnicity, cigarette pack-years, height, body mass index, hip circumference, and waist circumference. All HAA models are further adjusted for study site, total volume of imaged lung, and milliampere dose. * HAAs are regions of lung with an attenuation between 2600 and 2250 Hounsfield units.
Figure 2. (A) Histograms of lung attenuation and (B–D) representative computed tomography images of three study participants at the (B) 50th, (C ) 75th, and (D) 95th percentiles of high attenuation area (119, 143, and 202 cm3 of HAAs, respectively). The differences in the number of HAAs (2600 to 2250 Hounsfield units) appear small on visual inspection of the histograms in A. However, there are notable differences in the peakedness (kurtosis) and skewness of the three histograms, with lower kurtosis and skewness as the number of HAAs increases. Areas of increased attenuation appear gray and white on the lung windows shown in C and D.
412
AMERICAN JOURNAL OF RESPIRATORY AND CRITICAL CARE MEDICINE VOL 180
2009
Figure 3. Continuous relationships of cigarette pack-years to (A) spirometric restriction and (B) the volume of high lung attenuation. Thick dotted lines: smoothed regression lines adjusted for age, gender, race/ethnicity, current smoking status, urine cotinine, height, body mass index, and waist and hip circumferences. B is further adjusted for study site, total volume of imaged lung, and milliampere dose. Thin solid lines: 95% confidence intervals. Neither smoothed curve differed significantly from a straight line (A: P 5 0.65; B: P 5 0.16), suggesting that the relationships between cigarette pack-years and both measures are linear. Multivariate-adjusted (predicted) probabilities of spirometric restriction were estimated by combining the prevalence of spirometric restriction in the sample with the predicted incremental probabilities of spirometric restriction using a generalized additive model. Multivariate-adjusted (predicted) values of HAA were estimated by adding the sample mean to predicted mean differences using a generalized additive model.
striction in 4,320 participants in the NHANES I study (17), a finding we confirmed using urine cotinine, a biological marker of current smoking. In the NHANES study, current smoking was associated with a 40% increased odds of spirometric restriction after adjusting for potential confounders, an effect estimate similar in magnitude to the 40% increase in the prevalence of spirometric restriction we detected in heavy smokers (.20 pack-years) compared with never smokers. Our study builds on this important previous work by showing that cumulative cigarette smoke exposure is associated with spirometric restriction and areas of increased lung attenuation on CT independent of current smoking status, providing the first evidence that cigarette smoking might lead directly to increases in lung density even without a formal diagnosis of DPLD. The increased HAA we observed in heavy smokers might represent pathological changes in the lung, such as interstitial inflammation or fibrosis. Despite a number of case-control studies linking cigarette smoking to IPF (6–9), the mechanisms underlying this association are not well established. Cigarette smoke can injure endothelial and alveolar epithelial cells by increasing oxidative stress (34–36) and enhancing virus-induced parenchymal inflammation (37). Such injury could lead to abnormal wound healing and parenchymal fibrosis in susceptible individuals. In an animal model, cigarette smoke also increases the number of pulmonary myofibroblasts and enhances the fibrotic response to bleomycin, possibly by increasing matrix metalloproteinase-9 levels (38), and may further promote fibrosis by stimulating release of transforming growth factor-b1 from fibroblasts (39). Our findings should direct additional effort toward understanding the role of cigarette smoking in the development of pulmonary parenchymal fibrosis and inflammation. Cigarette smoke is also a well-known cause of airway changes, such as mucous hypersecretion, airway inflammation, and increases in airway wall thickness. The airways of cigarette smokers are characterized by increases in inflammatory cells, which can persist after smoking cessation (40). We excluded large airways from our quantitative assessment of CT lung density, minimizing the impact of airway inflammation on our findings. Small-airway inflammation and bronchiolocentric fibrosis, however, may have contributed to our results. Nevertheless, because our findings were unchanged by the exclusion of current smokers, it is unlikely that respiratory bronchiolitis or
alveolar macrophage accumulation completely accounts for our findings. Pulmonary edema also increases lung attenuation. Cigarette smoking could increase lung water by affecting left ventricular function. However, clinical cardiovascular disease, including heart failure, was an exclusion criterion, and our results remained unchanged after excluding those with decreased left ventricular function or wall motion abnormalities, minimizing the likelihood that our findings represent increases in pulmonary edema. Our study had several limitations. First, we retrospectively ascertained cigarette pack-years and smoking status, introducing the potential for information bias. To minimize misclassification of these key exposures, we ascertained the number of cigarette pack-years using standardized and supplemental methods and measured urine cotinine, an established indicator of recent tobacco smoke exposure (41). Second, although smoking is an established risk factor for chronic obstructive pulmonary disease its association with DPLD is less certain; unmeasured confounders could be responsible for some or all of the associations we observed. For example, obesity is a frequent cause of reductions in lung volume due to changes in chest wall compliance and diaphragmatic efficiency (42–45), and abdominal obesity has recently been shown to be a critical factor contributing to spirometric restriction (46). In our study, obesity was associated with cigarette smoking. To avoid confounding by body size, we used flexible modeling of precisely measured anthropometric factors, such as body mass index, height, and hip and waist circumferences, and we found consistent results among participants with a normal body mass index. Nonetheless, residual confounding by body size cannot be entirely excluded. The lack of putative risk factors for IPF and other idiopathic interstitial pneumonias limits our ability to examine additional confounding factors. Third, static lung volumes were not measured in MESA. A restrictive ventilatory defect is defined as ‘‘a reduction in total lung capacity below the 5th percentile of the predicted value, and a normal FEV1/vital capacity’’ and therefore requires measurement of lung volumes by plethysmography, gas dilution, or gas washout techniques (47). Among patients referred to a pulmonary function laboratory, spirometric restriction is associated with a low total lung capacity only about half of the
Lederer, Enright, Kawut, et al.: Smoking and Subclinical ILD
time (48, 49). On the other hand, CT measures are particularly sensitive for changes in the pulmonary parenchyma, and our findings were consistent across both measures of subclinical parenchymal lung disease. Fourth, we created a new measure, HAA, for epidemiologic research, because there is no current standard. We chose a reasonable range of lung density (2600 to 2250 HU) that represents typical ground-glass opacities and interstitial thickening, while clearly excluding areas devoid of air, such as complete atelectasis and consolidation (31). While scanning during diaphragmatic motion or incomplete inspiration can also lead to areas of increased lung attenuation, our results remained unchanged after excluding scans of suboptimal quality. Our measure was highly reproducible between scans and showed moderate agreement between expert reviewers. In addition, findings for the alternative measures of kurtosis and skewness showed consistency with our new measure and with previous studies of interstitial disease (30). Fifth, although we ascertained CT lung attenuation using partial lung scans obtained to assess coronary calcium, most idiopathic DPLDs preferentially involve the lower lobes, which were virtually completely imaged. In addition, our new measure correlated strongly with measures from full-lung CT scans. Finally, the association between cigarette pack-years and HAAs was relatively small: the increase in HAAs for each 10 cigarette pack-years was equal in magnitude to 4% of its standard deviation. An association of this magnitude should be expected in a healthy cohort, likely representing subclinical parenchymal changes. Larger effect sizes might be expected only in those with clinical DPLD. In conclusion, we found that cumulative and current cigarette smoking were both independently associated with spirometric restriction and increased CT lung attenuation in a populationbased sample of older adults without airflow obstruction or clinical cardiovascular disease. Our findings support the hypothesis that smoking is a risk factor for subclinical parenchymal inflammation and/or fibrosis. Conflict of Interest Statement: D.J.L. received $1,001 to $5,000 from CanAccord Adams for medical consulting, received $10,001 to $50,000 from Gilead as an institutional grant, is a Columbia site PI for ARTEMIS clinical trial, received $1,001 to $5,000 from Broncus Technologies as an institutional grant, and has a patent pending for lung injury biomarker in sleep apnea. P.L.E was a coinvestigator for EASE study. S.M.K. received $1,001 to $5,000 from Gilead as a consultant on IPF, received $10,001 to $50,000 from Gilead for serving on a steering committee on trials in IPF, and received $1,001 to $5,000 in lecture fees from Gilead. E.A.H. is a founder and shareholder in VIDA Diagnostics, a company commercializing image analysis software used in this study and developed at the University of Iowa. G.H. does not have a financial relationship with a commercial entity that has an interest in the subject of this manuscript. E.J.R.v.B. received up to $1,000 from EDDA Technology Inc. as a Medical Advisory Board volunteer and received $10,000 to $50,000 from QI2 as the owner/founder. J.H.M.A. does not have a financial relationship with a commercial entity that has an interest in the subject of this manuscript. R.J. does not have a financial relationship with a commercial entity that has an interest in the subject of this manuscript. G.S.L. does not have a financial relationship with a commercial entity that has an interest in the subject of this manuscript. R.G.B. does not have a financial relationship with a commercial entity that has an interest in the subject of this manuscript. Acknowledgment: The authors thank the other investigators, staff, and participants of the MESA and MESA-Lung Studies for their valuable contributions.
References 1. American Thoracic Society/European Respiratory Society. International multidisciplinary consensus classification of the idiopathic interstitial pneumonias. Am J Respir Crit Care Med 2002;165: 277–304. 2. American Thoracic Society/European Respiratory Society. Idiopathic pulmonary fibrosis: diagnosis and treatment. International consensus statement. Am J Respir Crit Care Med 2000;161:646–664. 3. King TE Jr, Tooze JA, Schwarz MI, Brown KR, Cherniack RM. Predicting survival in idiopathic pulmonary fibrosis: scoring system and survival model. Am J Respir Crit Care Med 2001;164:1171–1181.
413 4. Carrington CB, Gaensler EA, Coutu RE, FitzGerald MX, Gupta RG. Natural history and treated course of usual and desquamative interstitial pneumonia. N Engl J Med 1978;298:801–809. 5. Fraig M, Shreesha U, Savici D, Katzenstein AL. Respiratory bronchiolitis: a clinicopathologic study in current smokers, ex-smokers, and never-smokers. Am J Surg Pathol 2002;26:647–653. 6. Baumgartner KB, Samet JM, Stidley CA, Colby TV, Waldron JA. Cigarette smoking: a risk factor for idiopathic pulmonary fibrosis. Am J Respir Crit Care Med 1997;155:242–248. 7. Hubbard R, Lewis S, Richards K, Johnston I, Britton J. Occupational exposure to metal or wood dust and aetiology of cryptogenic fibrosing alveolitis. Lancet 1996;347:284–289. 8. Iwai K, Mori T, Yamada N, Yamaguchi M, Hosoda Y. Idiopathic pulmonary fibrosis. Epidemiologic approaches to occupational exposure. Am J Respir Crit Care Med 1994;150:670–675. 9. Miyake Y, Sasaki S, Yokoyama T, Chida K, Azuma A, Suda T, Kudoh S, Sakamoto N, Okamoto K, Kobashi G, et al. Occupational and environmental factors and idiopathic pulmonary fibrosis in Japan. Ann Occup Hyg 2005;49:259–265. 10. Steele MP, Speer MC, Loyd JE, Brown KK, Herron A, Slifer SH, Burch LH, Wahidi MM, Phillips JA III, Sporn TA, et al. Clinical and pathologic features of familial interstitial pneumonia. Am J Respir Crit Care Med 2005;172:1146–1152. 11. Mullen J, Hodgson MJ, DeGraff CA, Godar T. Case-control study of idiopathic pulmonary fibrosis and environmental exposures. J Occup Environ Med 1998;40:363–367. 12. Scott J, Johnston I, Britton J. What causes cryptogenic fibrosing alveolitis? A case-control study of environmental exposure to dust. BMJ 1990;301:1015–1017. 13. Bitterman PB, Rennard SI, Keogh BA, Wewers MD, Adelberg S, Crystal RG. Familial idiopathic pulmonary fibrosis. Evidence of lung inflammation in unaffected family members. N Engl J Med 1986;314: 1343–1347. 14. Hodgson U, Laitinen T, Tukiainen P. Nationwide prevalence of sporadic and familial idiopathic pulmonary fibrosis: evidence of founder effect among multiplex families in Finland. Thorax 2002;57:338–342. 15. Marshall RP, Puddicombe A, Cookson WO, Laurent GJ. Adult familial cryptogenic fibrosing alveolitis in the UK. Thorax 2000;55:143–146. 16. Rosas IO, Ren P, Avila NA, Chow CK, Franks TJ, Travis WD, McCoy JP Jr, May RM, Wu HP, Nguyen DM, et al. Early interstitial lung disease in familial pulmonary fibrosis. Am J Respir Crit Care Med 2007;176:698–705. 17. Mannino DM, Holguin F, Pavlin BI, Ferdinands JM. Risk factors for prevalence of and mortality related to restriction on spirometry: findings from the First National Health and Nutrition Examination Survey and follow-up. Int J Tuberc Lung Dis 2005;9:613–621. 18. Hoffman EA, Reinhardt JM, Sonka M, Simon BA, Guo J, Saba O, Chon D, Samrah S, Shikata H, Tschirren J, et al. Characterization of the interstitial lung diseases via density-based and texture-based analysis of computed tomography images of lung structure and function. Acad Radiol 2003;10:1104–1118. 19. Lederer DJ, Enright PL, Kawut SM, Hoffman EA, Hunninghake GW, Jiang R, Barr RG. Predictors of subclinical restriction on spirometry: The MESA-Lung Study [abstract]. Am J Respir Crit Care Med 2008; 177:A882. 20. Bild DE, Bluemke DA, Burke GL, Detrano R, Diez Roux AV, Folsom AR, Greenland P, Jacobs DR Jr, Kronmal R, Liu K, et al. Multiethnic study of atherosclerosis: objectives and design. Am J Epidemiol 2002;156:871–881. 21. Miller MR, Hankinson J, Brusasco V, Burgos F, Casaburi R, Coates A, Crapo R, Enright P, van der Grinten CPM, Gustafsson P, et al. Standardisation of spirometry. Eur Respir J 2005;26:319–338. 22. Hankinson JL, Odencrantz JR, Fedan KB. Spirometric reference values from a sample of the general US population. Am J Respir Crit Care Med 1999;159:179–187. 23. Hankinson JL, Kawut SM, Shahar E, Smith LJ, Stukovsky KH, Barr RG. Performance of spirometry reference values in a multiethnic population. The MESA-Lung Study [abstract]. Am J Respir Crit Care Med 2007;175:A605. 24. Hoffman EA, Jiang R, Baumhauer H, Brooks MA, Carr JJ, Detrano R, Reinhardt J, Rodriguez J, Stukovsky K, Wong ND, et al. Reproducibility and validity of lung density measures from cardiac CT Scans– The Multi-Ethnic Study of Atherosclerosis (MESA) Lung Study. Acad Radiol 2009;16:689–699. 25. Carr JJ, Nelson JC, Wong ND, McNitt-Gray M, Arad Y, Jacobs DRJ, Sidney S, Bild DE, Williams OD, Detrano RC. Calcified coronary
414
26.
27.
28.
29.
30.
31.
32. 33. 34.
35.
36.
37.
AMERICAN JOURNAL OF RESPIRATORY AND CRITICAL CARE MEDICINE VOL 180
artery plaque measurement with cardiac CT in population-based studies: standardized protocol of Multi-Ethnic Study of Atherosclerosis (MESA) and Coronary Artery Risk Development in Young Adults (CARDIA) study. Radiology 2005;234:35–43. Guo J, Reinhardt JM, Kitaoka H, Zhang L, Sonka M, McLennan G, Hoffman EA. Integrated system for CT-based assessment of parenchymal lung disease. IEEE International Symposium on Biomedical Imaging 2002:871–874. Hu S, Hoffman EA, Reinhardt JM. Automatic lung segmentation for accurate quantitation of volumetric X-ray CT images. IEEE Trans Med Imaging 2001;20:490–498. Tschirren J, McLennan G, Palagyi K, Hoffman EA, Sonka M. Matching and anatomical labeling of human airway tree. IEEE Trans Med Imaging 2005;24:1540–1547. Zhang L, Hoffman EA, Reinhardt JM. Atlas-driven lung lobe segmentation in volumetric X-ray CT images. IEEE Trans Med Imaging 2006;25:1–16. Best AC, Lynch AM, Bozic CM, Miller D, Grunwald GK, Lynch DA. Quantitative CT indexes in idiopathic pulmonary fibrosis: relationship with physiologic impairment. Radiology 2003;228:407–414. Do KH, Lee JS, Colby TV, Kitaichi M, Kim DS. Nonspecific interstitial pneumonia versus usual interstitial pneumonia: differences in the density histogram of high-resolution CT. J Comput Assist Tomogr 2005;29:544–548. Zou G. A modified Poisson regression approach to prospective studies with binary data. Am J Epidemiol 2004;159:702–706. Kronmal RA. Spurious correlation and the fallacy of the ratio standard revisited. J R Stat Soc Ser A Stat Soc 1993;156:379–392. Hoshino S, Yoshida M, Inoue K, Yano Y, Yanagita M, Mawatari H, Yamane H, Kijima T, Kumagai T, Osaki T, et al. Cigarette smoke extract induces endothelial cell injury via JNK pathway. Biochem Biophys Res Commun 2005;329:58–63. Nagy J, Demaster EG, Wittmann I, Shultz P, Raij L. Induction of endothelial cell injury by cigarette smoke. Endothelium 1997;5:251– 263. Kasahara Y, Tuder RM, Cool CD, Lynch DA, Flores SC, Voelkel NF. Endothelial cell death and decreased expression of vascular endothelial growth factor and vascular endothelial growth factor receptor 2 in emphysema. Am J Respir Crit Care Med 2001;163:737–744. Kang MJ, Lee CG, Lee JY, Dela Cruz CS, Chen ZJ, Enelow R, Elias JA. Cigarette smoke selectively enhances viral PAMP- and virus-induced
38.
39.
40.
41.
42. 43. 44.
45.
46.
47.
48.
49.
2009
pulmonary innate immune and remodeling responses in mice. J Clin Invest 2008;118:2771–2784. Cisneros-Lira J, Gaxiola M, Ramos C, Selman M, Pardo A. Cigarette smoke exposure potentiates bleomycin-induced lung fibrosis in guinea pigs. Am J Physiol Lung Cell Mol Physiol 2003;285:L949–L956. Wang H, Liu X, Umino T, Kohyama T, Zhu YK, Wen FQ, Spurzem JR, Romberger DJ, Kim HJ, Rennard SI. Effect of cigarette smoke on fibroblast-mediated gel contraction is dependent on cell density. Am J Physiol Lung Cell Mol Physiol 2003;284:L205–L213. Lapperre TS, Postma DS, Gosman MM, Snoeck-Stroband JB, ten Hacken NH, Hiemstra PS, Timens W, Sterk PJ, Mauad T. Relation between duration of smoking cessation and bronchial inflammation in COPD. Thorax 2006;61:115–121. Thompson SG, Stone R, Nanchahal K, Wald NJ. Relation of urinary cotinine concentrations to cigarette smoking and to exposure to other people’s smoke. Thorax 1990;45:356–361. Jenkins SC, Moxham J. The effects of mild obesity on lung function. Respir Med 1991;85:309–311. Jones RL, Nzekwu MM. The effects of body mass index on lung volumes. Chest 2006;130:827–833. Rochester DF, Enson Y. Current concepts in the pathogenesis of the obesity-hypoventilation syndrome. Mechanical and circulatory factors. Am J Med 1974;57:402–420. Fritts HW Jr, Filler J, Fishman AP, Cournand A. The efficiency of ventilation during voluntary hyperpnea: studies in normal subjects and in dyspneic patients with either chronic pulmonary emphysema or obesity. J Clin Invest 1959;38:1339–1348. Leone N, Courbon D, Thomas F, Bean K, Jego B, Leynaert B, Guize L, Zureik M. Lung function impairment and metabolic syndrome: the critical role of abdominal obesity. Am J Respir Crit Care Med 2009; 179:509–516. Pellegrino R, Viegi G, Brusasco V, Crapo RO, Burgos F, Casaburi R, Coates A, van der Grinten CP, Gustafsson P, Hankinson J, et al. Interpretative strategies for lung function tests. Eur Respir J 2005;26: 948–968. Aaron SD, Dales RE, Cardinal P. How accurate is spirometry at predicting restrictive pulmonary impairment? Chest 1999;115:869– 873. Glady CA, Aaron SD, Lunau M, Clinch J, Dales RE. A spirometrybased algorithm to direct lung function testing in the pulmonary function laboratory. Chest 2003;123:1939–1946.