J Vet Intern Med 2006;20:528–535
Survival of Cats with Naturally Occurring Chronic Renal Failure Is Related to Severity of Proteinuria Harriet M. Syme, Peter J. Markwell, Dirk Pfeiffer, and Jonathan Elliott Background: Tubulointerstitial kidney disease is a common cause of illness and death in pet cats and is typically not associated with overt proteinuria. Hypothesis: Proteinuria would be independently related to survival in cats with renal failure, with or without hypertension. Animals: The study included 136 client-owned cats; 28 apparently normal, 14 hypertensive but not azotemic, 66 azotemic but not hypertensive, and 28 both hypertensive and azotemic. Methods: Cox’s proportional hazards model was used to determine the influence of initial plasma creatinine concentration, proteinuria (urine protein-to-creatinine ratio or albumin-to-creatinine ratio), age, and systemic hypertension on the risk of death or euthanasia during the follow-up period. Multivariable linear regression was used to determine the relation between severity of proteinuria and predictive variables, including age, plasma creatinine concentration, systolic blood pressure, sex, and urine specific gravity. Results: Plasma creatinine concentration and proteinuria were very highly related to survival. The hazard ratio (95% confidence intervals) for death or euthanasia was 2.9 (1.4–6.3) and 4.0 (2.0–8.0) for urine protein-to-creatinine ratio 0.2–0.4 and .0.4, respectively, compared with the baseline group with a urine protein-to-creatinine ratio of ,0.2 and were 2.4 (1.2– 4.8) and 4.9 (2.3–10.2) for an albumin-to-creatinine ratio of 30–82 mg/g and ,82 mg/g, respectively, compared with a baseline group with albumin-to-creatinine ratio of ,30 mg/g. Treated hypertensive cats did not have reduced survival, although systolic blood pressure, together with plasma creatinine concentration was positively related to the magnitude of proteinuria. Conclusions and Clinical Importance: Despite the relatively low concentrations of proteinuria typical of chronic renal disease in cats, this measurement is of prognostic significance. Key words: Urine albumin-to-creatinine ratio; Urine protein-to-creatinine ratio; Systemic hypertension; Systolic blood pressure; Tubulointerstitial kidney disease.
hronic renal failure (CRF) is a very common cause of illness and death in pet cats. The prevalence of renal failure increases with advancing age, with at least 15% of cats over 15 years old being azotemic.1 The causes of renal failure in cats are diverse, including polycystic kidney disease, obstructive ureterolithiasis, renal lymphoma, pyelonephritis, and amyloidosis. However, the most frequent histopathologic description of tissue collected either by renal biopsy or at postmortem examination is diffuse tubulointerstitial nephritis.1,2 Glomerular diseases, at least those severe enough to result in the development of nephrotic syndrome, are uncommon.3,4 Cats diagnosed with CRF have a variable clinical course, and many will die of their disease. Factors that predict the progression of renal disease to end stage, resulting in death or euthanasia of the patient, have not been identified in cats with spontaneously occurring renal disease, although, in general, cats with severely
C
From the Departments of Veterinary Clinical Sciences (Syme, Pfeiffer) and Veterinary Basic Sciences (Elliott), Royal Veterinary College, Hawkshead Lane, Hatfield, Hertfordshire, UK; and WALTHAM Centre for Pet Nutrition, Melton Mowbray, Leicestershire, UK (Markwell). This work was funded by a grant from the WALTHAM Centre for Pet Nutrition. Results of this study were presented at the 21st annual ACVIM forum, Charlotte, NC, 2003. The validation of the albumin assay was presented at the 18th annual ACVIM forum, Seattle, WA, 2000. Reprint requests: Harriet M. Syme, Department of Veterinary Clinical Sciences, Royal Veterinary College, Hawkshead Lane, Hatfield, Hertfordshire AL9 7TA, UK; e-mail:
[email protected]. Received September 28, 2005; Revised September 29, 2005, December 7, 2005; Received January 9, 2006. Copyright E 2006 by the American College of Veterinary Internal Medicine 0891-6640/06/2003-0009/$3.00/0
increased plasma creatinine concentrations at diagnosis are unlikely to survive for long periods.5 Feeding cats with CRF a diet restricted in protein and phosphate content increases survival time, presumably by attenuating the severity of renal secondary hyperparathyroidism, in addition to lessening the severity of uremia.6 Proteinuria is an important predictor of disease progression in humans and dogs with spontaneous kidney disease7,8; however, in these species, glomerular lesions are more common than in cats,9,10 and, consequently, the clinical finding of moderate to marked proteinuria is more common. Protein excretion has been shown to increase in cats after subtotal nephrectomy but measurement of protein excretion has only been reported in a small number of cats with spontaneously occurring kidney disease.5,11 The aim of the present study was to investigate the factors that are associated with increased urinary protein excretion in cats with variable renal function and to determine whether these influence survival time. In particular, the influence of systemic blood pressure (at the time of enrollment to the study) was studied, because humans and dogs with hypertension and kidney disease tend to be more severely proteinuric and to have more rapid disease progression.7,12 Two measures of protein excretion were investigated, the urine protein-tocreatinine ratio (UPC) and the urine albumin-tocreatinine ratio (UAC). The UPC is frequently used in the clinical setting, because it removes the requirement for timed urine collection and so can be used when cats are examined as outpatients. It has been shown to correlate well with measurement of protein in 24-hour urine collections in both normal cats and in those with experimental reduction in renal function.13 Because it was considered that measures of albumin excretion
Proteinuria in Cats
might reflect changes in glomerular structure or function more closely than measurement of total protein, an immunologic method for measuring albumin concentration in cat urine was developed and used to calculate the UAC ratio.
Methods Patient Selection To determine whether renal function or systolic blood pressure (SBP) influenced protein (both total protein and albumin) excretion, urine samples were collected from normal cats, cats with CRF, and cats with hypertension for inclusion in the present study. The cats were recruited from the general, client-owned, population who presented to 2 first-opinion veterinary clinics between April 1997 and March 2002: The People’s Dispensary for Sick Animals, Bow, and the Beaumont Animal Hospital, Camden Town, both in London. The clinical criteria that were fulfilled for cats to be included in these groups were as follows. To be considered normal, cats had to have no clinically significant abnormalities detected on history, physical examination, or routine plasma biochemistry (this included measurement of plasma concentration of creatinine, urea, bilirubin, sodium, potassium, chloride, phosphate, calcium, cholesterol, albumin, and globulin, and also alanine aminotransferase and alkaline phosphatase activities) and have a urine specific gravity $ 1.035. In an attempt to age match these cats with those in the diseased groups, cats were actively recruited into this group if they were at least 12 years old. However, younger cats were not excluded. To be classified as having CRF, cats had to have plasma creatinine concentrations greater than the upper limit of the laboratory reference range (.177 mmol/L [.2.0 mg/dL]), together with historical or physical examination findings consistent with the diagnosis, such as polyuria, polydipsia, and palpably small kidneys. Cats with urine specific gravity $ 1.035 were considered to have renal failure if elevations in plasma creatinine concentration were observed repeatedly and no prerenal cause for the azotemia could be established. Cats with acute renal failure, diagnosed on the basis of clinical history and response to treatment, were excluded. For descriptive purposes, the cases were categorized on the basis of the cat’s plasma creatinine concentration in accordance with the staging system that has been proposed by the International Renal Interest Society (IRIS) Study Group: stage I (creatinine ,140 mmol/L [,1.6 mg/dL]), stage II (creatinine 1402250 mmol/L [1.622.8 mg/dL]), stage III (creatinine 2502440 mmol/L [2.825.0 mg/dL]), and stage IV (creatinine .440 mmol/L [.5.0 mg/dL]). In addition, stage II was further subdivided into substage IIa (creatinine 1402177 mmol/L [1.622.0 mg/dL]) and IIb (creatinine 1772250 mmol/L [2.022.8 mg/dL]) to reflect the cats who had plasma creatinine concentrations within and above the laboratory reference range, respectively. Cats with either current or recently treated hyperthyroidism were excluded from all the groups in the study. Cats were not excluded if they had been successfully treated for hyperthyroidism by surgical thyroidectomy at least 6 months previously, had complete resolution of signs consistent with hyperthyroidism, and had total thyroxine measurements ,40 nmol/L (,3.12 mg/dL) (reference range, 10255 nmol/L [0.7824.29 mg/dL]) after treatment. Measurements of SBP were made from the foreleg by using a Doppler flow detectora with a 9.5-MHz probe, as described previously.14 An average of several (usually 5) measurements of SBP obtained in rapid succession and the arithmetic mean of these measurements were used for subsequent data analysis. Cats were hypertensive, and treatment was implemented if SBP was
529
$175 mm Hg on more than 1 occasion or if SBP was $175 mm Hg and hypertensive ocular lesions were observed. The collection and the storage of blood and urine samples were performed with the informed consent of the cat’s owners. Blood samples were obtained by jugular venipuncture, and urine samples were collected by cystocentesis. To prevent any cat being included in the analysis on more than 1 occasion, in any cat for which urine samples from multiple visits were available for analysis, the 1st sample was used. Cats for which urine samples were not collected until after the implementation of antihypertensive therapy or those receiving angiotensin converting enzyme inhibitors for other reasons were excluded from the study. The Ethics and Welfare Committee of the Royal Veterinary College approved the study protocol. All the azotemic cats (whether azotemic at the outset of the study or those who developed azotemia during the period of follow-up) received standard therapy for CRF. This included feeding of a low-protein, low-phosphate dietb if this was palatable to the cats and if the owners were willing to feed it. Antihypertensive therapyc was prescribed to all cats where this was deemed necessary (see above), with the aim of reducing the SBP to less than 165 mm Hg. Urinalysis was performed at 3-month intervals (in all cats who returned to the clinic regularly) for detection of urinary tract infections, and, if these were diagnosed, appropriate antibiotic therapy was instituted. Similarly, cats who were hypokalemic (,3.0 mmol/L on any occasion or persistently ,3.5 mmol/L; reference range, 3.5–5.5 mmol/L) were prescribed dietary potassium supplementation,d although this was generally unpalatable to the cats and compliance with the therapy was poor. Cats also received standard medical care for any concurrent medical problems that developed.
Urinalyses After collection, urine samples were stored on ice until urinalysis was performed within 6 hours of sample collection. Analysis consisted of measurement of specific gravity with a refractometer, use of a standard multitest urine dipstick, and microscopic examination of urine sediment. Urine culture was performed only on samples that had pyuria or microscopically identified bacteria, or when there was a history of stranguria or hematuria. After urinalysis, the remaining urine was centrifugede (10 minutes at 1000 3g at ,10uC), and the supernatant was separated from any cellular debris. Aliquots of supernatant were stored at –80uC until protein assays were performed. Protein concentrations were not determined in urine samples of cats with evidence of bacterial urinary tract infection (bacteria observed during microscopic examination of urine sediment or positive urine culture) or where the urine sample was grossly blood contaminated (visibly discolored). Total protein concentration in the urine was measured by a commercial laboratoryf by using a colorimetric pyrogallol red method.g Creatinine concentration was measured in the same samples by a colorimetric picric acid method.h UPCs were calculated to correct for the effect of variable urine volume. UACs were calculated in an identical manner. For ease of data handling, units of mg albumin/g creatinine are used throughout the text rather than a unit-less ratio.
Albumin ELISA A sandwich ELISA was developed by using a commercial source of affinity-purified, polyclonal, goat anti-feline albumin antibodies, both with and without an alkaline phosphatase conjugate.i Flat-bottomed polystyrene platesj were coated overnight with 100 mL per well of 10 mg/mL unconjugated antibody in 0.1 M carbonate-bicarbonate buffer (pH 9.6). This and all sub-
530
Syme et al
sequent incubations were performed at room temperature. The wells were then washed twice with Tris-buffered saline solution– 0.05% Tween 20 (TBS-T), blocked with 100 mL TBS–1% bovine serum albumin (BSA) for 1 hour, washed as before and then 100 mL of sample or standard was added to each well and incubated for 1 hour. Standards were generated by diluting a cat plasma sample of known albumin concentration to final concentrations between 6.25 and 1000 ng/mL. Urine samples were diluted sufficiently for the albumin concentration to fall on the standard curve; this was typically between 1,000- and 10,000-fold. All dilutions were with TBS-T–1% BSA. Washing was again performed twice before addition of alkaline phosphatase conjugated antibody at a dilution of 1/25,000. Unbound conjugated antibody was removed by washing 4 times with TBS-T. Alkaline phosphatase substrate (100 mL) p-nitrophenyl phosphate (1 mg/mL) was added to each well and incubated, with agitation, for 1 hour. The optical density was measured at 405 nm.k Samples and standards were run in duplicate. The series of standard dilutions was used to generate a standard curve from which the values of the test samples were interpolated.l The analytical sensitivity of the assay (calculated from the average [n 5 6] interpolated albumin concentration corresponding to the upper 95% confidence interval of the zero standard) was 8.6 ng/mL. The working range of the assay was 8.6 to 200 ng/mL. Samples were diluted to ensure that the measured concentration fell within this range. Specificity of the assay was demonstrated by dilutional parallelism. The intra-assay coefficient of variation (CV) for urine samples (n 5 6) with albumin concentrations of 10.6, 34.0, and 147 ng/mL were 6.1, 3.1, and 17%, respectively. The interassay CVs for urine samples with albumin concentrations of 19.5 (n 5 6), 67.0 (n 5 6), and 124 (n 5 7) were 15, 14, and 16%, respectively. The results of immunoblotting of cat plasma and urine with the antibodies used in the ELISA revealed a single major band with identical migration in both samples and no cross-reactivity with BSA (data not shown).
Survival Data The survival time was calculated as the number of days from sample collection until the death or the euthanasia of the cat. No attempt was made to classify the cause of death. If possible, the date of death was recorded to the day from the medical record. Euthanasia was performed in accordance with the wishes of the owner and was based on the clinician’s assessment of the quality of life of the cat. If a cat died at home and the date of death was not recorded contemporaneously, but the owner knew the month in which the cat had died, then it was assumed that the cat had died on the 1st day of that month. Cats were censored from the analysis if they were either lost to follow-up or were still alive at the conclusion of the data-collection period. Cats were considered lost to follow-up if they had not been seen at the clinic for more than 3 months and repeated efforts to contact the owner by telephone were unsuccessful, or if the owner could not be traced.
Statistical Methods All analyses were performed by using computerized statistical analysis software.m Results are reported as mean 6 standard deviation unless otherwise stated. Probabilities #.05 were considered significant. The normality of the data was assessed by using the Kolmogorov-Smirnov test with Lilliefor’s significance correction. The UPC and UAC measurements were log transformed to normalize the distribution of the data before analysis. Transformed data from the cats in the normal group were used to generate reference ranges for UPC and UAC. The effect of blood pressure and the severity of kidney disease on protein excretion was examined by linear regression, and the
coefficient of determination (R2) was calculated. The continuous variables of age, the plasma creatinine concentration, urine specific gravity, and SBP; and the categorical variables for sex were included in the analysis with either log UPC or log UAC as the dependent variable. Variables were entered in the multivariable analysis if P was ,.10 in the univariable analysis. Survival analysis was performed by Cox’s regression analysis. The outcome variable investigated was the time to death from any cause. Potential predictive variables that were investigated were hypertension at initial examination, age (as a dichotomous variable; greater or less than the median), the plasma creatinine concentration stratified in accordance with the IRIS Staging System, and a categorical measure of proteinuria (either UPC or UAC). The effect of UPC and UAC were investigated in separate models because of colinearity of the 2 variables. UPC was stratified into 3 groups in accordance with the IRIS Staging System (,0.2, nonproteinuric; 0.220.4, mild proteinuria; and .0.4, proteinuric). Cats had a high UAC concentration if it was greater than the upper limit of the reference range derived from the group of normal cats and had borderline elevation of UAC if the value was .30 mg/g, a cut point that has been used to define microalbuminuria in humans.
Results Prediction of Proteinuria from Cross-Sectional Analysis Data from 28 normal cats were available for inclusion in the study. Twenty of the cats were female, 8 were male, and all were neutered. The age of 1 cat was unknown, whereas the remaining cats were 12.7 6 2.5 (range, 8.2217.0) years old. The age of the normal cats was reasonably well matched to that of normotensive cats with CRF (12.8 6 4.5 years; range, 3.0225.0 years) and the hypertensive cats (14.6 6 3.1 years; range, 5.6222.2 years). The UPC and UAC data were not normally distributed and so were log transformed before all subsequent analyses; this resulted in normalization of the data. Reference ranges derived for UPC and UAC from the transformed data obtained from the normal cats were 0.0520.43 and 1.9282.4 mg/g, respectively. Data from 136 cats were included in the study. This included the 28 normal cats described above, 14 cats with hypertension but plasma creatinine concentration within the laboratory reference range (IRIS Class I and IIa), and 94 cats with azotemia (IRIS Class IIb, III, and IV), 28 of whom were also hypertensive (Table 1). None of the nonazotemic, hypertensive cats had clinical signs or results of initial investigations compatible with known causes of systolic hypertension. The log UPC and log UAC measurements from the cats were highly significantly correlated (Pearson’s correlation statistic for the 2 measures was 0.83; P , .001). Creatinine concentration and SBP were associated with log UPC and log UAC at the 10% significance level and so were included in the final analysis (Table 2). Age, sex, and urine specific gravity were not significantly associated with log UPC or log UAC and were excluded. In the final, multivariable, linear regression analysis, the plasma creatinine concentration was significantly positively associated with the magnitude of proteinuria. SBP was also significantly associated with both log UAC (P , .001) and log UPC (P 5 .031).
Proteinuria in Cats
Table 1.
Normal na Age (years) Sex (M/F) SBP (mm Hg) UPC UAC (mg/g) Survival (days)
Demographic data for the 136 cats included in the study.
I
IIa
22 12.0 (8.2217.0)* 7/15 134 (1022160) 0.15 (0.0720.49) 11 (3272) 357 (12821055), n55
7 13.0 (10.0224.1) 2/5 133 (1042147) 0.18 (0.0620.25) 16 (3263) All survived
Normotensive and azotemic na Age (years) Sex (M/F) SBP (mm Hg) UPC UAC (mg/g) Survival (days) Hypertensive na Age (years) Sex (M/F) SBP (mm Hg) UPC UAC (mg/g) Survival (days)
531
6 16.0 (13.0220.0) 3/3 202 (1802223) 0.27 (0.1920.43) 69 (42300) 365 (2342399), n53
9 14.8 (12.0216.8) 6/3 199 (1782230) 0.28 (0.0620.42) 41 (172135) 987 (5272995), n53
IIb
III
IV
31 12.6 (1.4219.8) 17/14 140 (1012167) 0.15 (0.0624.46) 16 (223065) 504 (7821017), n57
22 13.0 (7.0225.0)*** 10/12 130 (942158) 0.22 (0.0623.20) 35 (22618) 154 (132766), n 5 13
12 10.0 (3.0215.0)*** 11/1 133 (902164) 0.65 (0.1223.64) 91 (2022856) 57 (02342), n 5 12
21 14.0 (11.0222.2)*** 14/7 208 (1762250) 0.30 (0.0822.34) 64 (522777) 187 (342958), n 5 12
5 15.2 (12.2218.7) 2/3 182 (1752215) 0.49 (0.1322.03) 80 (192509) 281 (312462), n55
1 5.6 1/0 179 0.54 173 21, n51
Data are reported as median (range). Stratification is based on plasma creatinine concentration in accordance with the recommendations of the IRIS Study Group. Also included in the table are the systolic blood pressure (SBP), urine protein creatinine ratio (UPC), albumin creatinine ratio (UAC), and the number of days between the cats entering the study and their death or euthanasia if this occurred (survival). a n indicates number of cats included in the analysis. * The number of asterisks indicates the number of cats of unknown age within the group.
Of the 136 cats included in the study, 10 were excluded from the survival analysis because their ages were not known. Fifty-five of the 126 cats who were included in the survival analysis died, of which 50 were euthanized. The median length of follow-up in the cats that died was 234 days (range, 221055 days). The median length of follow-up in the cats that were censored because they were either still alive at the end of the study or had been lost to follow-up was 480 days (range, 3521783 days). Cox’s regression analysis was performed separately by using categorization of either UPC (model 1) or UAC (model 2) as a putative predictive factor, in combination with creatinine concentration (categorized according to the IRIS classification scheme), age (above or below median age of 13.5 years) and whether or not the cat was hypertensive at initial presentation (Table 3). These factors were not included in the same analysis, because of the high degree of collinearity. Hypertension (at initial presentation) was not predictive of survival in either model and so was not included in the stepwise analyses (P 5 .059 and .089 in models with UPC and UAC, respectively). Both age and the plasma creatinine concentration were significantly associated with survival. In addition, both UPC and UAC were significantly and independently associated with survival (Fig 1A,B).
Discussion The results of the present study indicate that a relation exists between plasma creatinine concentration and SBP and magnitude of proteinuria in cats. This was evident for measures of both total protein and albumin concentration. Although the relation of these variables was statistically significant, taken together, creatinine concentration and SBP predicted only 18 and 25% of the variability in log UPC and log UAC, respectively. Thus, many other factors must also be important in explaining urine protein concentration in cats. One such factor is the histopathologic nature of the renal injury. Renal biopsies were not performed in this study, because the clinical management of the cats was unlikely to be altered by the results of histopathologic examination and, therefore, could not be justified in these client-owned animals. The independent association of plasma creatinine concentration with the magnitude of proteinuria in the cats in the present study is similar to observations that have been made in human patients.15,16 It has also been demonstrated previously in cats that surgical reduction of renal mass increases UPC.11,13,17 This relation can be explained by the hemodynamic consequences of declining renal function, with afferent arteriolar vasodilation, resulting in increased glomerular capillary pressure.
532
Syme et al
Table 2. Regression analyses for prediction of log UPC and log UAC. Log UPC Initial model
2
R 5 0.19, P , .001
Age (years) Sex (0 5 M, 1 5 F) Creatinine (mmol/L) (mg/dL) SBP, mm Hg USG Final model
Log UAC
2
R 5 0.24, P , .001
B –0.008 0.077
SE 0.010 0.075
P .43 .31
B –0.001 0.133
SE 0.015 0.114
P .94 .24
0.001 0.109 0.002 –0.231
0.000 0.025 0.001 2.40
,.001
0.002 0.162 0.006 –0.199
0.000 0.038 0.002 3.99
,.001
0.001 0.033 0.002
,.001
.027 .92
R2 5 0.18, P , .001
Creatinine (mmol/L) (mg/dL) SBP (mm Hg)
0.001 0.108 0.002
,.001 .96
R2 5 0.25; P , .001 0.000 0.022 0.001
0.002 0.189 0.006
,.001 .031
,.001
UPC, urine protein-to-creatinine ratio; UAC, urine albumin-to-creatinine ratio; B, beta; SE, standard error; SBP, systolic blood pressure; USG, urine specific gravity.
This has been demonstrated in experimental nephrectomy models in both the rat and the cat.11,18 In addition, as renal function declines, the decreased number of functioning tubules is less able to reabsorb and degrade filtered protein, resulting in more intact protein molecules present in urine. However, a decrease in the number of filtering nephrons will also reduce the surface area over which loss of protein can occur, thus limiting the rise in protein excretion.
Epidemiologic studies in human patients have demonstrated a positive relation between glomerular filtration rate (GFR) and albumin excretion when plasma creatinine concentrations are normal or low,19 because of glomerular hyperfiltration in patients with supranormal GFR.20,21 In the present study, there was no indication of a parabolic relation between creatinine concentration and protein excretion. In part, this may have been because of the inclusion of only a small
Table 3. Models of survival in cats with renal failure with or without hypertension, including either UPC (model 1) or UAC (model 2) as predictive variable. 95% CI for Exp(B) B
SE
–0.27 1.00 2.44 4.80
0.69 0.47 0.53 0.70
1.07 1.40
0.39 0.35
0.83
0.32
–0.22 0.69 2.10 4.55
0.69 0.45 0.48 0.69
0.89 1.58
0.35 0.38
0.78
0.31
Sig.
Exp(B)
Lower
Upper
0.77 2.72 11.5 121
0.20 1.07 4.10 30.7
2.96 6.89 32.3 476
2.91 4.04
1.36 2.04
6.22 7.99
2.30
1.24
4.27
0.80 2.00 8.13 94.8
0.21 0.83 3.18 24.6
3.11 4.83 20.8 365
2.43 4.87
1.22 2.31
4.84 10.3
2.18
1.20
3.98
Model 1 IRIS stage
I IIa IIb
UPC
Age (years)
III IV ,0.2 0.220.4 .0.4 ,13.5 .13.5
,0.001 0.70 0.035 ,0.00 ,0.001 ,0.001 0.006 ,0.001 0.008
Model 2 IRIS stage
I IIa IIb
UAC (mg/g)
Age (years)
III IV ,30 30282 .82 ,13.5 .13.5
,0.001 0.75 0.12 ,0.001 ,0.001 ,0.001 0.012 ,0.001 0.011
UPC, urine protein-to-creatinine ratio; UAC, urine albumin-to-creatinine ratio; CI, confidence interval; Exp(B), hazard ratio; B, estimated coefficient; SE, standard error; Sig., significance; IRIS, International Renal Interest Society.
Proteinuria in Cats
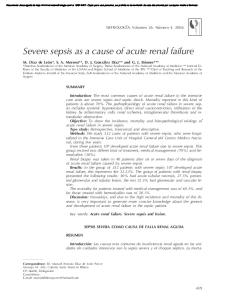
Fig 1. Survival curves constructed by using Cox’s stepwise regression analysis with stratification according to urine protein creatinine (UPC; A), and albumin creatinine (UAC; B) ratios. The analysis was controlled for the covariates of age and plasma creatinine concentration. The curves are constructed by using data from 126 cats (of which 55 died) who were apparently normal or were suffering from azotemia and/or systemic hypertension.
number of cats with normal plasma creatinine concentrations. In addition, the plasma creatinine concentration is a poor indicator of GFR except when it is moderately or severely reduced and is unlikely to reflect glomerular hyperfiltration. The aforementioned studies in human patients used either direct measurement of GFR or estimations of creatinine clearance,20,21 which may have increased the ability to detect a relation with protein excretion. A further limitation of the use of creatinine concentration as an estimate of GFR is that this declines as muscle mass decreases, as is common in cats with renal failure. In the present study, SBP was independently related to both log UPC and log UAC. Hypertension has been
533
identified as an independent risk factor for albuminuria in human patients in a number of studies,15,22 although a positive association between blood pressure measurements (in the hypertensive range) have been reported in some studies23,24 but not in others.25 Extreme elevation in SBP, such as occurs in the cats where antihypertensive treatment was deemed necessary in this study, might induce glomerular hypertension, because the mechanisms for autoregulation are overwhelmed. Because, in the present study, the majority of cats requiring antihypertensive treatment had renal failure, glomerular hypertension was particularly likely to be present. Increasing age was not a risk factor for increasing proteinuria in the present study. This could have been because of the inclusion of predominantly older cats, reflecting the population of cats who are most likely to be presented because of renal disease with or without hypertension.1,26 Age has been associated with the development of microalbuminuria in human patients. It is postulated that this is because of subclinical renal disease in the aging population.15 In addition, creatinine excretion tends to decrease with age as muscle mass declines, potentially causing an increase in UPC and UAC ratios because of a reduction in urinary creatinine excretion. Most of the cats who died in this study were euthanized rather than dying naturally. However, the clinicians who made the recommendation to euthanize the animal were often not directly involved with the study and were unaware of any numerical data obtained from the cat at entry to the study and so made their decisions solely on the basis of the clinical status of the cat at the time that it was presented to them. In addition, because the majority of these animals were being treated for free, there were no financial implications of any decision by the owner to have the cat euthanized. No association was detected between the sex of the cat and the magnitude of proteinuria. In a previous study of protein excretion in the cat, males were noted to have greater 24-hour protein excretion.27 However, because muscle mass and, therefore, creatinine excretion also tend to be higher in males, it is possible that UPC (and by inference UAC) was not different in male and female cats, because of parallel changes in both protein and creatinine excretion. Creatinine concentration, age, and protein excretion (measured as UPC or UAC) were all independently associated with shorter survival times in the present study. The creatinine concentration and protein measurements that were included in the analysis were made at entry of the cats to the study, which in many cases were many months or even years before the end point was reached. Although these variables would be expected to change over the period of follow-up, no attempt was made to extend the analysis to account for time-dependent variables. In the future, prospective studies that include this information may provide valuable insights into progressive, naturally occurring, renal dysfunction in cats. Hypertension at initial presentation was not associated with the duration of survival in this study. This
534
Syme et al
result is perhaps not unexpected, because the cats who were classified as hypertensive were given appropriate treatment and so their blood pressure was significantly reduced over the period of follow-up. However, the results of the present study indicate that, if treated, the finding of systemic hypertension does not of itself indicate a worse prognosis. Poorly controlled hypertension has been shown to accelerate disease progression in human patients with renal failure, and this is further increased in patients who also have increased protein excretion.7 A recent study of dogs with naturally occurring CRF did observe a positive association between blood pressure and survival time,12 although UPC was not included in the analysis, which may have influenced the results. A likely reason that an association between initial blood pressure and survival time is observed in dogs but not in cats is that, in general, hypertension is much more difficult to manage in dogs. Results of the present study indicate that, in cats with hypertension who are treated with amlodipine, survival times are not significantly different from cats who are normotensive at presentation. The definition of the blood pressure at which therapeutic intervention was introduced in the present study was a conservative one. This was because white coat hypertension is particularly common in cats.29 Nevertheless, it is possible that a minority of the cats identified as hypertensive in the present study were actually suffering from white coat hypertension. No attempt was made to ascribe a cause for death to the cats in the present study. Some cats died at home or with a minimum of diagnostic intervention, so it was decided that to establish cause of death would be difficult. In a previous study of cats with hypertension, cardiovascular events were a major cause of death, particularly when reduction of SBP was suboptimal.28 Cardiovascular disease was also a common cause of death in cats with renal disease, second only to end-stage renal failure regardless of whether these cats were hypertensive.6 A somewhat unexpected finding of the present study was how well measures of protein excretion performed in predicting reduced survival times in cats with CRF. Measurement of UPC is routinely available from many commercial laboratories, is relatively cheap, and requires only a small volume of urine to run. In spite of this, UPC measurements have not previously been performed on large numbers of cats with CRF, and no data regarding protein excretion as a prognostic indicator have been reported in peer-reviewed scientific journals. However, such a finding has been recently reported in the results of a clinical trial of angiotensin converting enzyme inhibitor in cats with chronic kidney disease.n No apparent benefit could be detected for measurement of UAC compared with UPC in the present study. Correlation between UPC and UAC was strong. The advantage of UAC measurement is that it facilitates the accurate quantification of protein when excretion rates are only slightly greater than normal. The majority of cats included in the present study had mild proteinuria (90% of cats had UPC values ,1.0). In fact, almost half of the azotemic cats (46/94, 49%) had
UPC values less than 0.25. This is compatible with published data, suggesting that the major disease process occurring in the majority of these cats is chronic tubulointerstitial fibrosis rather than primary glomerular disease. It was perhaps surprising to see such a marked correlation between proteinuria and survival even at this low concentration of proteinuria in a species where the lesion predominantly involves the tubulointerstitial compartments of the kidney. The results of numerous experimental studies have suggested that proteins filtered through the glomerular capillary can have intrinsic renal toxicity, which together with other risk factors can have a contributory role in the progression of renal damage. In the main, however, these studies have focused on highly artificial situations, such as rodents injected daily with large doses of albumin, such that they develop ‘‘overload proteinuria.’’ It remains uncertain whether in animals with naturally occurring renal disease rapid disease progression is because of the proteinuria causing renal injury or if the proteinuria is simply a marker for a disease process that is intrinsically more rapidly progressive. If interventions that alter protein excretion can be demonstrated to slow the progressive decline of renal function in the cat, then studies of therapeutic interventions (drugs or diet) would be greatly facilitated, because measurement of proteinuria could then be used as a surrogate end point in clinical trials.
Footnotes a
Parks model 811 B, Perimed, Bury St. Edmonds, UK Royal Canin Renal Diet, Melton Mowbray, Leicestershire, UK c Amlodipine 0.625–1.25 mg/cat/d, Istin, Pfizer, Sandwich, UK d Tumil K powder, 2 mmol q12h, Arnolds Veterinary Products, Shrewsbury, UK e Chilspin, MSE Scientific Instruments, Crawley, UK f Idexx Laboratories, Wetherby, West Yorkshire, UK g Randox Laboratories, Crumlin, Co Antrim, UK h IL Test Creatinine, Instrumentation Laboratory, Milano, Italy i Bethyl Laboratories, Montgomery, TX j Costar Corning Incorporated, Corning, NY k Wallac 1420 Victor2 EG & G, Wallac Oy, Finland l Graphpad Prism, Version 3.00 for Windows, San Diego, CA m SPSS 11.5 for Windows, Chicago, IL n Gunn-Moore D, for the BENRIC Study Group. Influence of proteinuria on survival time in cats with chronic renal insufficiency. J Vet Intern Med 2003;17:405 b
References 1. Lulich JP, O’Brien TD, Osborne CA, Polzin DJ. Feline renal failure: questions, answers, questions. Compend Cont Ed Pract Vet 1992;14:127–152. 2. DiBartola SP, Rutgers HC, Zack PM, Tarr MJ. Clinicopathologic findings associated with chronic renal disease in cats: 74 cases (1973–1984). J Am Vet Med Assoc 1987;190:1196–1202. 3. Nash AS, Wright NG, Spencer AJ, et al. Membranous nephropathy in the cat: a clinical and pathological study. Vet Rec 1979;105:71–77.
Proteinuria in Cats 4. Wright NG, Nash AS, Thompson H, Fisher EW. Membranous nephropathy in the cat and dog: a renal biopsy and follow-up study of sixteen cases. Lab Invest 1981;45:269–277. 5. Elliott J, Barber PJ. Feline chronic renal failure: clinical findings in 80 cases diagnosed between 1992 and 1995. J Small Anim Pract 1998;39:78–85. 6. Elliott J, Rawlings JM, Markwell PJ, Barber PJ. Survival of cats with naturally occurring chronic renal failure: effect of dietary management. J Small Anim Pract 2000;41:235–242. 7. Peterson JC, Adler S, Burkart JM, et al. Blood pressure control, proteinuria, and the progression of renal disease. The Modification of Diet in Renal Disease Study. Ann Intern Med 1995;123:754–762. 8. Jacob F, Polzin DJ, Osborne CA, et al. Evaluation of the association between initial proteinuria and morbidity rate or death in dogs with naturally occurring chronic renal failure. J Am Vet Med Assoc 2005;226:393–400. 9. Greene T, Bourgoignie JJ, Habwe V, et al. Baseline characteristics in the Modification of Diet in Renal Disease Study. J Am Soc Nephrol 1993;4:1221–1236. 10. Macdougall DF, Cook T, Steward AP, Cattell V. Canine chronic renal disease: prevalence and types of glomerulonephritis in the dog. Kidney Int 1986;29:1144–1151. 11. Brown SA, Brown CA. Single-nephron adaptations to partial renal ablation in cats. Am J Physiol 1995;269:R1002– R1008. 12. Jacob F, Polzin DJ, Osborne CA, et al. Association between initial systolic blood pressure and risk of developing a uremic crisis or of dying in dogs with chronic renal failure. J Am Vet Med Assoc 2003;222:322–329. 13. Adams LG, Polzin DJ, Osborne CA, O’Brien TD. Correlation of urine protein/creatinine ratio and twenty-four-hour urinary protein excretion in normal cats and cats with surgically induced chronic renal failure. J Vet Intern Med 1992;6:36–40. 14. Syme HM, Barber PJ, Markwell PJ, Elliott J. Prevalence of systolic hypertension in cats with chronic renal failure at initial evaluation. J Am Vet Med Assoc 2002;220:1799–1804. 15. Jones CA, Francis ME, Eberhardt MS, et al. Microalbuminuria in the US population: third National Health and Nutrition Examination Survey. Am J Kidney Dis 2002;39:445–459. 16. Garg AX, Kiberd BA, Clark WF, et al. Albuminuria and renal insufficiency prevalence guides population screening: results from the NHANES III. Kidney Int 2002;61:2165–2175.
535
17. Finco DR, Brown SA, Brown CA, et al. Protein and calorie effects on progression of induced chronic renal failure in cats. Am J Vet Res 1998;59:575–582. 18. Hostetter TH, Olson JL, Rennke HG, et al. Hyperfiltration in remnant nephrons: a potentially adverse response to renal ablation. Am J Physiol 1981;241:F85–F93. 19. Dell’Omo G, Penno G, Giorgi D, et al. Association between high-normal albuminuria and risk factors for cardiovascular and renal disease in essential hypertensive men. Am J Kidney Dis 2002; 40:1–8. 20. Taniwaki H, Ishimura E, Emoto M, et al. Relationship between urinary albumin excretion and glomerular filtration rate in normotensive, nonproteinuric patients with type 2 diabetes mellitus. Nephron 2000;86:36–43. 21. Pinto-Sietsma SJ, Janssen WM, Hillege HL, et al. Urinary albumin excretion is associated with renal functional abnormalities in a nondiabetic population. J Am Soc Nephrol 2000;11:1882– 1888. 22. Liese AD, Hense HW, Doring A, et al. Microalbuminuria, central adiposity and hypertension in the non-diabetic urban population of the MONICA Augsburg survey 1994/95. J Hum Hypertens 2001;15:799–804. 23. Gosling P, Beevers DG. Urinary albumin excretion and blood pressure in the general population. Clin Sci (Lond) 1989;76: 39–42. 24. Redon J, Liao Y, Lozano JV, et al. Factors related to the presence of microalbuminuria in essential hypertension. Am J Hypertens 1994;7:801–807. 25. Bigazzi R, Bianchi S, Campese VM, Baldari G. Prevalence of microalbuminuria in a large population of patients with mild to moderate essential hypertension. Nephron 1992; 61:94–97. 26. Maggio F, DeFrancesco TC, Atkins CE, et al. Ocular lesions associated with systemic hypertension in cats: 69 cases (1985–1998). J Am Vet Med Assoc 2000;217:695–702. 27. Monroe WE, Davenport DJ, Saunders GK. Twenty-four hour urinary protein loss in healthy cats and the urinary proteincreatinine ratio as an estimate. Am J Vet Res 1989;50:1906– 1909. 28. Elliott J, Barber PJ, Syme HM, et al. Feline hypertension: clinical findings and response to antihypertensive treatment in 30 cases. J Small Anim Pract 2001;42:122–129. 29. Belew AM, Barlett T, Brown SA. Evaluation of the white-coat effect in cats. J Vet Intern Med 1999;13:134–142.