Plant & Cell Physiol. 13: 81-91 (1972)
Chlorophyll fluorescence characteristics of system I chlorophyll a-protein complex and system II particles at room and liquid nitrogen temperatures
Department of Botany, University of Illinois, Urbana, Illinois 61801, U. S. A. (Received September 7, 1971)
1. Emission spectra of a system I chlorophyll (Chi) a-protein complex (SI Chl-P)3 and system II particles, prepared by the method of Dietrich and Thornber (25), and by the method of Huzisige et al. (24), respectively, were measured at room and liquid nitrogen temperatures to characterize the emission bands originating from system I and system II. 2. Room temperature and 77°K spectra clearly show that the F695 (690-697 nm) fluorescence band originates from both photosystems. In SI Chl-P the F695 band was observed both at room and at liquid nitrogen temperatures. 3. At 77°K, the Chi afluorescenceat 685 nm is nearly as intense as that at 720 nm (long-wavelength band) in dilute samples of SI Chl-P. Reabsorption of 685 nm fluorescence has distorted considerably the shape of emission spectra of system I published thus far. In dilute samples of system II, the F695 is as (or more), intense as F685, and the F735 is drastically decreased. 4. Additionally, it is reported here that in Cyanidium caldarium, studied to compare the in vivo system with isolated SI Chl-P and system II preparations, the 695 nm band is present upon excitation in both system I and system II; the ratio of the long-wavelength fluorescence (F735) to the short-wavelength fluorescence (F685) is much higher than those in the purified preparations. Conceivably, the high values, obtained in the dilute samples of algae, are due to the reabsorption of thefluorescencefrom the shortwavelength form of Chi a in the chloroplast in vivo. Furthermore, in this alga the phycocyanin fluorescence band is split with maxima at 655 (phycocyanin) and 665 nm (allophycocyanin) at 77°K. At room temperature, however, the allophycocyanin fluorescence predominates having a peak at about 670 nm. The relative increase in phycocyanin fluorescence at 77°K may be due to a decrease in the energy transfer from it to allophycocyanin in agreement with slow Forster type transfer.
1
2 3
Reprint requests should be addressed to Govindjee, 297 Morrill Hall, Department of Botany, University of Illinois, Urbana, Illinois 61801, U. S. A. Department of Botanical Sciences, University of California, Los Angeles, California 90024, U. S. A. System I chlorophyll a protein complex will be abbreviated as SI Chl-P throughout the text. 81
Downloaded from http://pcp.oxfordjournals.org at University of Illinois at Urbana-Champaign on July 7, 2010
P. Mohanty, Barbara Zilinskas Braun, Govindjee1 and J. P. Thornber2
82
P. Mohanty, B. Z. Braun, Govindjee and J. P. Thornber
In view of the increased importance of the study of emission spectra, we have attempted to analyze, in this communication, the " t r u e " (i.e., as far as possible devoid of reabsorption problem) emission characteristics of photosystems I and II both at room and liquid nitrogen temperatures; for this study a purified preparation of system I Chi a-protein complex (SI Chl-P) (23) obtained from the blue-green alga Phormidium luridum and a purified preparation of system I I particles obtained from maize chloroplasts (24) were used as the best representative of the two systems. We have also measured the emission properties of a suspension (diluted according For the sake of convenience the main Chi a emission bands have been designated as F685, F695 and F735 even though the actual positions may vary.
Downloaded from http://pcp.oxfordjournals.org at University of Illinois at Urbana-Champaign on July 7, 2010
It has been well documented that green plants and algae have two distinct pigment systems (1). Each pigment system can be isolated in a form representative of its in vivo state (2). One of the methods routinely used to characterize these pigment systems is to measure the fluorescence emission spectra at room and at liquid nitrogen temperatures. The emission spectrum of chloroplasts at room temperature (300°K) is relatively structureless: it has a main peak around 685 nm with a broad shoulder at 720740 nm. Upon cooling to 77°K, this spectrum becomes a three-banded structure with maxima at 685 (F685), 695 (F695) and 735 nm (F735) (see ref. 3)A. The long-wavelength F735 band is usually broader and more intense than the other two bands, probably consisting of more than one component. It has been postulated, from the measurements of emission and excitation spectra in several organisms, that the F735 band originates mostly from pigment system I (PSI) and F685 mainly from pigment system II (PSII) (refs. 4-7). Also it has been suggested that F695 is closely linked to the system II trap as this fluorescence appears when traps are closed (8, 9). This F695 band is sensitive to redox reagents (10-12), to polarity of solvent (13, 14), to the treatment of hydroxylamine (a potent inhibitor of photosystem II) (15), and to a naturally occurring proteinaceous factor from Ricinus (16). A new dimension to the study of emission spectra has been added from the recent suggestion that the relative intensities of F685 and F735 could indicate the extent of energy spill-over from PSII to PSI (17-19). However, the measurements of the relative intensities of fluorescence bands in the emission spectrum, especially at 77°K, are complicated by the trivial reabsorption of Chi fluorescence. Govindjee and Yang (5) could eliminate the reabsorption by the neighboring particles by a simple dilution technique. However, the concentration of Chi in a chloroplast is high (20) and the reabsorption of Chi fluorescence lowers the short-wavelength band with respect to the long wavelength band. The high concentration of Chi also partially accounts for the low yield of fluorescence in vivo. Whether a decrease of the size of the Chl-containing particles will overcome the reabsorption problem is not yet clear. Butler and Baker (21) observed that the shape of the emission spectrum does not change with the change in the size of the particles. Brody et al. (22), however, observed that the F735/F685 ratio, in particles obtained by sonication and differential centrifugation, decreases with the decrease of particle size. Recently Boardman and T h o m e (11) could not establish such a correlation; their spectra did not change upon decrease in size confirming the earlier work in ref. (21).
Characteristics of System I and System II Emission
83
to Govindjee and Yang (5) ) of a phycocyanin-containing eukaryotic acidophilic alga, Cyanidium caldarium, to illustrate the extent of reabsorption within a chloroplast.
Materials and methods
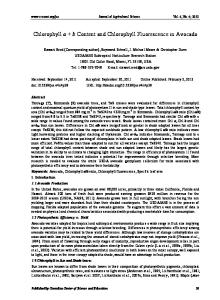
Results and discussion Fig. 1 (A) shows the emission spectra of the eukaryotic alga, Cyanidium caldarium; it is very similar to that of many phycocyanin-containing prokaryotic blue-green
B xexc 435nm • • »exC"580nm»« 77'K
•
A 685
: 1 }V 665
695
V
1 1 620 640 660
680 700
720 740 760
780
620 640
660 680 700
720 740
WAVELENGTH, nm
Fig. 1. Emission spectra of Cyanidium at room temperature (A) and at 77°K (B), Chi cone, ~~ 3.5ngjml.
760 780
Downloaded from http://pcp.oxfordjournals.org at University of Illinois at Urbana-Champaign on July 7, 2010
System II particles from maize (Zea mays) were prepared as outlined by Huzisige et al. (24). The Chi ajb ratio in our preparation was 1.9 which is comparable to that reported by Huzisige et al. (24). SI Chl-P was prepared by a previously published method (25). This preparation, as characterized by gel electrophoresis and ultracentrifugation studies, is homogeneous. The complex is associated with photosystem I and contains 20 Chi molecules (23). The absorption spectrum, P?oo content, and other characteristics of the complex have been published earlier (23, 25, 26). Cyanidium caldarium was grown for a week at 30°C, with constant gassing, in an inorganic medium (27).. The culture was centrifuged, and the cells were resuspended in the growth medium to give an absorbance of 0.025 cm' 1 at 670 nm. The protocol for measuring emission spectra, at 77°K, was the same as that of Cho and Govindjee (7, 13). The dilution of the samples was made with 50 mM Tris-chloride buffer, pH 8.0. The samples were cooled quickly (within 1-2 sec) in order to obtain the least reabsorption of F685 and F695 bands (13). The details of the spectrofluorometer have been published previously (28, 29). The spectra, corrected for the spectral response of the apparatus, were plotted as relative quanta per unit wavelength. Other details of measurements are given with each figure.
84
P. Mohanty, B. Z. Braun, Govindjee and J. P. Thornber
A
100
£90
J 70
iexc=480nm •-. room temperature -
683
-
n 60 z 50
2 40
-
% 30
-
20
=^5i
720
740
10
660 670 680 690 700 710 720 730 740 750
"
660
680
700
720
740
760 780
WAVELENGTH,nm
Fig. 2. Emission spectrum at room temperature of system II particles (isolated from maize by Huzisige et al.'s method) suspended in Tris buffer, 0.015 M (pH 7.2) (A); the same for system I Chi a-protein complex suspended in 50 mu Tris buffer (pH 8.0) at room temperature (B). Chi cone, for A, ~3.0/ig/ml; for B, ~2.0,ug/ml.
Downloaded from http://pcp.oxfordjournals.org at University of Illinois at Urbana-Champaign on July 7, 2010
algae (30). At room temperature, the excitation at 580 nm causes an emission peak at 670 nm (allophycocyanin) and another peak at 683 nm (Chi a). Excitation at 435 nm gives a weakfluorescencewith a maximum at 685 nm and a broad shoulder at 730-740 nm (Chi a). Cho and Govindjee (7, 30) concluded that these long-wavelength emission bands are not vibrational bands of the main bands, but rather they originate from distinct long-wavelength forms of Chi a. Excitation at 435 nm emits no phycocyanin fluorescence at 670 nm, suggesting that there is no back transfer of energy from chlorophyll a to allophycocyanin (30). Upon rapidly cooling the sample to 77°K, the intensity of emission increases (not shown in the figure) and the spectra show structures of Chi a [Fig. 1 (B) ]. Excitation of phycocyanin (580 nm) produces two distinct bands with maxima at 655 (phycocyanin) and 665 nm (allophycocyanin). The phycocyanin emission band is not seen at room temperature; due to the high efficiency of energy transfer from phycocyanin to allophycocyanin, phycocyanin fluorescence is low, and the phycocyanin band is submerged inside the larger allophycocyanin band. However, at 77°K phycocyanin band is even higher than the allophycocyanin band. This increase in phycocyanin fluorescence at 77°K could be due to a decrease in the efficiency of the energy transfer from phycocyanin to allophycocyanin at the lower temperature. This means that this energy transfer is temperature dependent, and may be of a slow Forster type (literature citations in ref. (30)). Emission from Chi a is at 685 nm with a shoulder at 695 nm. The intense long-wavelength Chi a emission peaks at 730 nm and contributions from other fluorescing species around 745 nm are also noticeable. With excitation at 580 nm, the 730 nm band is approximately 1.5 times more intense than the F685 band. However, with excitation at 435 nm, the F73O band is about 9 times more intense than the emission bands at 685 and 695 nm; both 685 and 695 nm emission bands are distinctly resolved. Again, nofluorescenceis seen from phycocyanin. Thus,
Characteristics of System I and System II Emission
687 1
00
/
\
80
700 r\
85
xexc = 43onm -
A.
77-K -
60
20
660
670
680
690
700
710
720 730 740 WAVELENGTH, nm
750
760
770
780
790
Fig. 3. Emission spectrum at 77° K of system II particles {isolated from maize by Huzisige el al.'s method). Chi cone, ~ 3.0/ig/ml.
the most notable feature of the emission spectrum, reported here, is the presence of two "phycocyanin" fluorescence bands and the existence of the 695 nm band (F695) even when system I Chi a is preferentially illuminated (see refs. {31, 32) and below). Fig. 2 (A) shows the room temperature emission spectrum of system II particles isolated from maize chloroplasts. The Chi ajb ratio, in this preparation, was 1.9, confirming the enrichment of photosystem I I ; the "parent" chloroplasts had a ratio of about 3. Excitation at 480 nm (mainly system II) or at 430 nm (mainly system I) gave almost identical spectra. Govindjee and Yang (5) have reported that excitation of fragmented spinach chloroplasts mainly with system I light gives a higher yield in the 720-740 nm region than excitation mainly with the system II light. Since system II particles are hopefully devoid of most of the long-wavelength forms of Chi a that belong mainly to system I, we do not expect any change in the emission spectra when the particles are excited at 435 nm or at 480 nm. The F695 band is not distinct in the room temperature spectrum. On cooling the system II sample to 77°K, the emission band F695 (now shifted to 700 nm) becomes very distinct and prominent (Fig. 3). It assumes almost equal intensity to that of the F685 (687 nm) band. The F740 band is not so pronounced. (Again, excitation at 430 nm yields a similar spectrum to that caused by the excitation at 480 nm confirming that the preparation is pure.) Thus, system II particles contain Chi a species that fluoresce at 685 nm, 697-700 nm and to a lesser extent at longer wavelengths (F740), although the ratio of F685/ F735 is much higher here than in system I. It has been shown by Cho and Govindjee (7, 30) that F740 forms of Chi a are also excited by energy transfer from the Chi a 670 (in system II) — a form of Chi a which fluoresces at 685 nm (excitation spectra not shown here). Fig. 2 (B) shows the room temperature emission spectrum of SI Chl-P isolated from Phormidium. The most noteworthy feature of this spectrum is a shoulder
Downloaded from http://pcp.oxfordjournals.org at University of Illinois at Urbana-Champaign on July 7, 2010
I
40
86
P. Mohanty, B. Z. Braun, Govindjee and J. P. Thornber
gi 90
ieica430nm Thin Suspension 77" K ve»C'4J0n(Ti Thick Suspensiof
SO
77*K
I"
\695/
\
f
P60 4
•
= 30
-
20
•
A
10 /
660
680 700
720 740
660
680 700 720
740 760 760
WAVELENGTH, nm
Fig. 4. Emission spectra at 77°K of system I Chi a-protein complex.
(A): thin suspension; Chi cone, ~2.0/ig/ml. (B): thick suspension; Chi cone, ~ 40,ug/ml.
at 692 nm besides the maximum at 682 nm. The other long-wavelength bands, F72O and F740, that are characteristic of system I Chi a, are distinctly resolved. It has been assumed that F695 (690-695 nm) originates from system II pigments (Chi a2) and that these species of Chi a are closely associated with system II traps (31-33). However, excitation at 435 nm (mainly system I) also induces a band at 696 nm in Anacystis (31, 32); thus this band may also be present in system I. Papageorgiou and Govindjee (34) discuss the possibility that band(s) at 695 nm at room temperature may originate in both pigment systems I and II. Briantais (55) has recently shown that the difference spectrum constructed from the room temperature emission spectra of system II particles and that of chloroplasts yields a peak at 695 nm. The emission spectrum of SI Chl-P clearly show that a fluorescence band at 690-700 nm is in system I. Moreover, the emission spectrum of Cyanidium at 77°K likewise shows a band at 695 nm even when this alga is excited mainly with system I (435 nm) light (Fig. 1 (B) ). When an extremely dilute (absorbance 0.02 cm"1 at Chi a peak) sample of the SI Chl-P was rapidly cooled to 77°K, the emission spectrum (Fig. 4 (A)) showed a peak at 681 nm, a shoulder at 695 nm, and a broad band, almost as intense as the 681 nm band, peaking at 720 nm with a shoulder at 740 nm. If, however, the sample is moderately thick (absorbance, 0.40 cm"1 at Chi a peak), the short-wavelength fluorescence band (Fig. 4 (B) ) is almost totally masked by the extremely intense F735 (725 nm); its intensity is now as much as ten times more than that of the 685 nm band. It is obvious that this is due to reabsorption of fluorescence by the neighboring complexes. Published (see ref. 25) emission spectra of the system I complex and of system I particles look almost indentical to the spectrum shown in Fig. 4 (B).
Downloaded from http://pcp.oxfordjournals.org at University of Illinois at Urbana-Champaign on July 7, 2010
i 40
87
Characteristics of System I and System II Emission Table 1 Comparison of the ratios of the long-wavelength (FL) {720-740 nm) emission band to the short-wavelength (Fs) (680-685 nm) emission band as estimated from emission spectra at liquid nitrogen temperature
Material used (reference)
Optical density of the sample used for 1 cm path length
Excitation wavelength in nm
Ratio FL Fs
6.3
absorption at 680 nm) absorption at 680 nm)
430 430
1.47
(at 436 nm) (at 436 nm) (at 436 nm)
436 436 436
0.92 14.5 0.92
435 435
0.61 0.37
430 430
8.0
0.02 (at 675 nm) 0.02 (at 675 nm)
430 480
0.43 0.45
0.025 (at 670 nm)
580 435
1.62 12.3
thick suspension 2.0 (~100% thin suspension (5) 0.025 (~5% Chloroplast particles (digitonin fractionation) 10xl0 3 X# pellet 0.1 144xlO3X£ pellet 0.1 144xlO3Xg supernatant (38) 0.1 Chlamydomonas
chloroplasts particles (French press fractionation) Fraction 1 Fraction 2 (37)
0.05 (at 675 nm) 0.05 (at 675 nm)
Phormidium, System I
Chi a-protein complex thick suspension " thin suspension a Maize System II particles "
0.40 (at the red maximum) 0.02 (at the red maximum)
0.89
Cyanidium
(whole cells)"
° Values calculated from the spectra presented in this paper.
The ratio of F730 to F685 in unseparated systems:
F730/F685 ratio of 1.6 was obtained when phycocyanin was excited in Cyanidium (Table 1); this value is very close to that obtained from the emission spectrum of a thin suspension of chloroplast fragments at 77°K (Govindjee and Yang, 5). These authors did not observe any change on further dilution of the sample which suggests that, at that concentration, the reabsorption by neighboring chloroplasts had been completely eliminated. It has been questioned earlier (see ref. 36) whether or not the 685 nm fluorescence band is significanlty absorbed within the single chloroplast. The F730/F685 ratio of 1.6 is considered to be high because of reabsorption of F685 band within the single intact cell. This conclusion is made possible because one can indeed obtain lower ratios with smaller system I and system II preparations. If this is true, then breaking the chloroplasts into smaller fragments should decrease the ratio of the fluorescence band at long
Downloaded from http://pcp.oxfordjournals.org at University of Illinois at Urbana-Champaign on July 7, 2010
Broken spinach chloroplast fragments
88
P. Mohanty, B. Z. Braun, Govindjee and J. P. Thornber
The ratio of F720 to F681 in SI Chl-P Our result with SI Chl-P shows that F720/F681 ratio (0.89) is fairly close to the value (0.61) reported by Brown (37) for Chlamydomonas system I particles prepared by the French press fractionation method, and to that (0.9) reported by Cederstrand and Govindjee (10; also see ref. 27) for system I prepared by the digitonin treamtment method. These ratios (0.6 to 0.9) are significantly lower than the ratio of 3.6 and 14.5 reported by Boardman and Thorne (11) and Boardman et al. (38), respectively. We could not compare our ratios with those obtained by Kok and Rurainski (39) because the latter did not correct their spectra for the response of the spectrofluorometer. The SI Chl-P is small (M.W. 150-160xl0 3 ) in size and has 20 Chi molecules per complex (23); thus, reabsorption of fluorescence should be minimal here. Since the pigments are bound within the protein subunits of the complex and must be quite close to each other, therefore, a loss of ability of energy transfer among the different forms of pigments present in the complex is not expected. Perhaps, the emission spectrum of the dilute sample of SI Chl-P is the true emission spectrum of system I. At 77°K this spectrum shows an emission band at 685 nm which is approximately as intense (or even more) as the F735 band. A less dilute sample of SI Chl-P exhibits a F735 band 4 to 10 times stronger than the F685 and F695 bands—and then the spectrum looks similar to the previously published spectra. The exact value for the ratio of these two bands (F735/F685) is difficult to estimate and may vary from plant to plant, but it may be emphasized that system I does not lack—but instead has quite a bit of—the F685 and F695 bands. The Chi a-protein complex used in this study, however, shows (from absorption and excitation spectra not included here) that it is fairly rich in the long-wavelength forms of Chi a. This complex as well as the other pigment protein complex obtained by Thornber and Olson (40) from higher plants exhibit the in vivo characteristics associated with pigment system I of photosynthesis. This suggests that there is no impairment of any functional Chi a forms in the isolated complexes. We, therefore, reemphasize that the emission spectra presented in this paper (Fig. 2 (B) and Fig. 4 (A) ) may very well represent the true emission spectra of photosystem I. The ratio of F735 to F685 in system II The system II particles of Huzisige et al. (24) are by far the purest system II particles isolated from higher plants and, thus, it is felt that Fig. 3 represents the true emission spectrum for photosystem II. The ratio of F735/F685 for our preparation is 0.43; this ratio is fairly close to 0.37 reported by Brown (37) for Chlamydomonas system II particles prepared by the French press fractionation method;
Downloaded from http://pcp.oxfordjournals.org at University of Illinois at Urbana-Champaign on July 7, 2010
wavelength to that at the short wavelength. Boardman and Thorne (11) claimed that the ratio of the F730 to the F685 band remained fairly constant with the decrease in the size of the fragments. In these fragments, Chi ajb ratio remained constant which probably indicates that there may not be any preferential loss of any of the major forms of Chi a. The F730/F685 ratios, as estimated from their published emission spectra, however, varied from 3.6 to 2.1 which might be due to different rates of cooling. These high ratios indicate to us that their samples had a large reabsorption of Chi a fluorescence. The reason for this result is not clear; perhaps, the percent absorption in the frozen sample in their system is large.
Characteristics of System I and System II Emission
89
it is not too different from 0.6 reported by Cederstrand and Govindjee (10; also see ref. 37) for system II prepared by the digitonin treatment method. These ratios (0.4 to 0.7) are significantly lower than the ratio of 2.1 reported by Boardman and Thorne (11). The value of 0.92 found by Boardman et al. (38) is, however, intermediate but still higher than 0.43 obtained here. The emission spectrum in Fig. 3, representing the true emission from system II, shows the most pronounced F695 we have seen5; it is almost equal in height to F685, but the F740 is very low.
The results reported above indicate that both pigment systems I and II contain forms of Chi a that give rise to emission bands at 685 nm, at 695 nm and at 740 nm, and that a particular emission peak is not characteristic of any photosystem, but what is characteristic is the relative ratios between the emission peaks. There is a larger amount (about twice) of the long-wavelength fluorescence in system I than in system II. As noted above, the F695 does not originate entirely from system II, but the ratio of F695 to F685 is higher in system II than in system I. These conclusions are in agreement with those recently obtained by Cho and Govindjee (7, 13) from their studies with intact algal cells. This may mean that the SI Chl-P and system II preparations used in this work have not significantly changed from their in vivo state. We thank Dr. T. Brock for a gift of culture of Cyanidium and Dr. W. E. Dietrich for his help in the preparation of Sl-Chl P. We are grateful to NSF for financial support and to NASA for a fellowship to one of us (BZB).
References ( / ) Smith, J. H. C. and C. S. French: The major and accessory pigments in photosynthesis. Ann. Rev. Plant Physiol. 14: 181-224 (1963). ( 2) Boardman, N. K.: Physical separation of the photosynthetic photochemical systems, ibid. 21: 115-137 (1970). ( 3) Govindjee, G. Papageorgiou and E. Rabinowitch: Chlorophyllfluorescenceand photosynthesis. In Fluorescence Instrumentation and Practice. Edited by G. G. Guilbaut. Marcel Dekker Inc., N. Y., p.511-564. 1967. ( 4 ) Goedheer, J. C.: Fluorescence action spectra of algae and bean leaves at room and at liquid nitrogen temperatures. Biochim. Biophys. Acta 102: 73-89 (1965). ( 5) Govindjee and L. Yang: Structure of the red fluorescence band in chloroplasts. J. Gen. Physiol. 49: 763-780 (1966). (6") Murata, N., M. Nishimura and A. Takamiya: Fluorescence of chlorophyll in photosynthetic systems III. Emission and action spectra offluorescence-threeemission bands of chlorophyll a and the energy transfer between two pigment systems. Biochim. Biophys. Acta 126: 234-243 (1966). ( 7 ) Cho, F. and Govindjee: Low-temperature (4—77°K) spectroscopy of Chlorella; temperature dependence of energy transfer efficiency, ibid. 216: 139-150 (1970). 6
Boardman, N. K. (Personal communication to one of us (G)) has suggested that the F695 may have been exaggerated as Huzisige et al.'s method (as used by us) takes about 8hr. We suggest that the above work should be repeated with preparations that take shorter time.
Downloaded from http://pcp.oxfordjournals.org at University of Illinois at Urbana-Champaign on July 7, 2010
General remarks
90
P. Mohanty, B. Z. Braun, Govindjee and J. P. Thornber
(20) Rabinowitch, E.: Photosynthesis. Aim. Rev. Plant Physiol. 3: 229-264 (1952). (21) Butler, W. L. and J. E. Baker: Low-temperature spectra of chloroplast fragments. Biochim. Biophys. Acta 66: 206-211 (1963). (22) Brody, S. S., M. Brody and J. H. Levine: Change of fluorescence spectrum as a function of size of chloroplast fragments, ibid. 94: 310-312 (1965). (23) Thornber, J. P.: Comparison of a chlorophyll «-protein complex isolated from a blue-green alga with chlorophyll-protein complexes obtained from green bacteria and higher plants, ibid. 172: 230-241 (1969). (24) Huzisige, H., H. Usiyama, T. Kikuti and T. Azi: Purification and properties of the photoactive particle corresponding to photosystem II. Plant & Cell Physiol. 10: 441-455 (1969). (25) Dietrich, W. E. and J. P. Thornber: The P70o-Chlorophyll a-protein of a blue green alga. Biochim. Biophys. Ada 245: 482-493 (1971). (26) Thornber, J. P.: Chlorophyll a-protein complex of blue green algae. In Methods in Enzymology. Edited by S. P. Colowick and N. O. Kaplan. Academic Press, New York, 23: 682. 1971. (27) Allen, M. B.: Studies with Cyanidium caldarium, an anomalously pigmented chlorophyte. Arch. Mikrobiol. 32: 270-277 (1959). (28) Shimony, C , J. Spencer and Govindjee: Spectral characteristics of Anacystis particles. Phntosynthetica 1: 113-125 (1969). (29) Govindjee: Fluorescence studies on algae, chloroplasts and chloroplast fragments. In Currents in Photosynthesis. Edited by J. B. Thomas and J. H. C. Goedheer. Ad. Donker Publishers, Rotterdam, p. 93-103. 1966. (30) Cho, F. and Govindjee: Low-temperature (4—77°K) spectroscopy of Anacystis; Temperature dependence of energy transfer efficiency. Biochim. Biophys. Ada 216: 151-161 (1970). (31) Bergeron, J. A.: Studies of the localization, physiochemical properties, and action of phycocyanin in Anacystis nidulans. In Photosynthetic Mechanisms of Green Plants. Edited by B. Kok and A. T. Jagendorf. Natl. Acad. Sci. -Natl. Res. Council Publ. 1145: p. 527-536. 1963.
Downloaded from http://pcp.oxfordjournals.org at University of Illinois at Urbana-Champaign on July 7, 2010
( 8) Krey, A. and Govindjee: Fluorescence changes in Porphyridium exposed to green light of different intensity: a new emission band at 693 nm and its significance to photosynthesis. Proc. Nail. Acad. Sci., U.S. 52: 1568-1572 (1964). ( 9) Krey, A. and Govindjee: Fluorescence studies on a red alga, Porphyridium cruentum. Biochim. Biophys. Ada 120: 1-18 (1966). (10) Cederstrand, C. N. and Govindjee: Some properites of spinach chloroplast fractions obtained by digitonin solubilization. ibid. 120: 177-180 (1966). (11) Boardman, N. K. and S. W. Thome: Fluorescence properties of fragments from sonicated spinach chloroplasts. ibid. 189: 294-297 (1969). (12) Ke, B. and L. P. Vernon: Fluorescence of the subchloroplast particles. Biochemistry 6: 22212226 (1967). (13) Cho, F. and Govindjee: Fluorescence spectra of Chlorella in the 295-77°K range. Biochim. Biophys. Ada 205: 371-378 (1970). (14) Cederstrand, C. N., E. Rabinowitch and Govindjee: Absorption and fluorescence spectra of spinach chloroplasts fractions obtained by solvent extraction, ibid. 120: 247-258 (1966). (15) Mohanty, P., T. Mar and Govindjee: Action of hydroxylamine on the red alga Porphyridium cruentum.. ibid. 253: 213-221 (1971). (16) Nathanson, B. and M. Brody: Changes in fluorescence spectra of chloroplasts induced by naturally occurring factor. Photochem. Photobiol. 12: 469-479 (1971). (17) Murata, N.: Control of excitation transfer in photosynthesis I. Light-induced change of chlorophyll a fluorescence in Porphyridium cruentum. Biochim. Biophys. Ada 172: 242-251 (1969). (18) Murata, N.: Control of excitation transfer in photosynthesis II. Magnesium ion dependent distribution of excitation energy between two pigment systems in spinach chloroplasts. ibid. 189: 171-181 (1969). (19) Mohanty, P., G. Papageorgiou and Govindjee: Fluorescence induction in red alga Porphyridium cruentum. Photochem. Photobiol. 14: 667-682 (1971).
Characteristics of System I and System II Emission
91
Downloaded from http://pcp.oxfordjournals.org at University of Illinois at Urbana-Champaign on July 7, 2010
(32) Govindjee: Emerson enhancement effect and two light reactions of photosynthesis. In Photosynthetic Mechanism of Green Plants. Edited by B. Kok and A. T. Jagendorf. Natl. Acad. Sci. -Natl. Res. Council Publ. 1145: p. 318-334. 1963. (33) Kok, B.: Fluorescence studies. In Photosynthctic Mechanisms of Green Plants. Edited by B. Kok and A. T. jagendorC Natl. Acad. Sci. -Natl. Res. Council Publ. 1145: p. 45-55. 1963. (34) Papageorgiou, G. and Govindjee: Changes in intensity and spectral distribution of fluorescence; effect of light treatment on normal and DCMU-poisoned Anacyslis nidulans. Biophysic. J. 7: 375-390 (1967). (35) Briantais,J. M.: Separation physique et arrangement mutuel des deux systemes photochimiques des chloroplastes. Physiol. Veg. 1: 135-180 (1969). (36) Das, M. and Govindjee: A long-wave absorbing form of chlorophyll a responsible for the "red drop" in fluorescence at 298°K and the F723 band at 77°K. Biochim. Biophys. Ada 143: 570-576 (1967). (37) Brown, J.: Absorption and fluorescence of chlorophyll a in particle fractions from different plants. Biophys. J. 19: 1542-1552 (1969). (38) Boardman, N. K., S. W. Thorne and J. M. Anderson: Fluorescence properties of particles obtained by digitonin fragmentation of spinach chloroplasts. Proc. Natl. Acad. Science, U. S. 56: 586-593 (1966). (39) Kok, B. and H. J. Rurainski: Long-wave absorption and emission bands in chloroplast fragments. Biochim. Biophys. Ada 126: 584-587 (1966). (40) Thornber, J. P. and J. M. Olson: Chlorophyll-proteins and reaction center preparations from photosynthetic bacteria, algae and higher plants. Photochem. Photobiol. 14: 329-341 (1971).