Acta Pharm. 63 (2013) 159–173
Original research paper
DOI: 10.2478/acph-2013-0015
Chemometrically assissted optimization and validation of RP-HPLC method for the analysis of itraconazole and its impurities IRENA KASAGI] VUJANOVI]1 AN\ELIJA MALENOVI]2* MARKO JOVANOVI]2 TIJANA RAKI]2 BILJANA JAN^I] STOJANOVI]2 DARKO IVANOVI]2 1
University of Banja Luka Medical Faculty, Department of Drug Analysis Banja Luka, Republic of Srpska
2
University of Belgrade Faculty of Pharmacy Department of Drug Analysis Belgrade, Serbia
Accepted January 11, 2013
This paper presents the chemometrically assisted optimization and validation of the RP-HPLC method intended for the quantitative analysis of itraconazole and its impurities in pharmaceutical dosage forms. To reach the desired chromatographic resolution with a limited number of experiments in a minimum amount of time, Box-Behnken design was used to simultaneously optimize some important chromatographic parameters, such as the acetonitrile content in the mobile phase, pH of the aqueous phase and the column temperature. Separation between itraconazole and impurity F was identified as critical and selected as a response during the optimization. The set optimal mobile phase composition was acetonitrile/water pH 2.5 adjusted with o-phosphoric acid (50:50, V/V). Separations were performed on a Zorbax Eclipse XDB-C18, 4.6 ´ 150 mm, 5 mm particle size column with the flow rate 1 mL min–1, column temperature set at 30 °C and UV detection at 256 nm. The established method was then subjected to method validation and the required validation parameters were tested. For the robustness evaluation, fractional factorial 24–1 design was utilized and factors that might significantly affect the system performance were defined. As other validation parameters were also found to be suitable, the possibility to apply the proposed method for the determination of itraconazole, its impurities B and F in any laboratory under different circumstances has been proven. Keywords: itraconazole, itraconazole impurities, high performance liquid chromatography, Box-Behnken design, fractional factorial design
Selection of the most appropriate experimental conditions for a particular analysis can be a very tedious and time consuming process. Researchers are abandoning the old-fashioned, classical approach one-factor-at-a-time and substituting it with modern, ad* Correspondence; e-mail:
[email protected]
159
I. Kasagi} Vujanovi} et al.: Chemometrically assissted optimization and validation of RP-HPLC method for the analysis of itraconazole and its impurities, Acta Pharm. 63 (2013) 159–173.
vanced approaches. Namely, for the selection of the region where the response exhibits the optimum, utilization of experimental design gained considerable attention and as the most convenient three-level factorial designs, such as central composite design, Box-Behnken (BBD) design or Doehlert matrix, are usually applied (1-4). Furthermore, experimental design became inevitable in proper planning and conducting of robustness testing (5-8). In this paper, optimization and validation of the reversed-phase high performance liquid chromatographic (RP-HPLC) method, suitable for the separation of itraconazole from its impurities, was supported by the appropriate experimental design: Box-Behnken design was employed at the optimization step, while in the robustness evaluation of fractional factorial design enabled anticipation of the system behaviour under real operational conditions. Chemical structures and chemical names of the analyzed substances are given in Fig. 1. Although, impurities B and F are process related impurities of itraconazole, they are specified by formulation manufacturers as the impurities to be analyzed during shelf life.
N
a)
N
N O Cl
Cl
O
O
N
N
N
N N
O
N
b)
N
N O Cl
Cl
N
O
O
N
N
N
N
O
c)
N N
N O Cl
Cl
O
N O
N
N
N
N
O
Fig. 1. Chemical structures of: a) itraconazole (2R,4S)-rel-1-(butan-2-yl)-4-{4-[4-(4-{[(2R,4S)-2-(2,4-dichlorophenyl)-2-(1H-1,2,4-triazol-1-ylmethyl)-1,3-dioxolan-4-yl]methoxy}phenyl)piperazin-1-yl]phenyl)4,5-dihydro-1H-1,2,4-triazol-5-one, b) impurity B (2R,4S)-rel-1-{butan-2-yl)-4-{4-[4-(4-{[(2R,4S)-2(2,4-dichlorophenyl)-2-{1H-1,3,4-triazol-1-ylmethyl)1,3-dioxolan-4-yl]methoxy}phenyl)piperazin-1yl]phenyl}-4,5-dihydro-1H-1,2,4-triazol-5-one and c) impurity F (2R,4S)-rel-1-(butan-1-yl)-4-{4-[4(4-{[(2R,4S)-2-(2,4-dichlorophenyl)-2-(1H-1,2,4-triazol-1-ylmethyl)1,3-dioxolan-4-yl]methoxy}phenyl)piperazin-1-yl]phenyl)4,5-dihydro-1H-1,2,4-triazol-5-one. 160
I. Kasagi} Vujanovi} et al.: Chemometrically assissted optimization and validation of RP-HPLC method for the analysis of itraconazole and its impurities, Acta Pharm. 63 (2013) 159–173.
In order to support the defined aim, a literature survey was done. The official method, given in Eur. Ph. 7 (9) describes the gradient mode RP-HPLC method for the separation of itraconazole and its seven impurities. Then, chromatographic behavior of itraconazole and its twelve impurities was analyzed, on four stationary phases varying the pH of the mobile phase in order to define the linear mathematical models for the prediction of impurities' retention times (10). Many HPLC methods for the analysis of itraconazole and hydroxyitraconazole in serum and plasma with UV detection were described (11-15). For the purpose of bioavailability and bioequivalence studies of itraconazole, HPLC-tandem mass spectrometry (16), as well as HPLC methods employing either UV (17) or fluorescence detection (18) were used. Itraconazole, voriconazole and posaconazole in human plasma were determined by the HPLC method coupled with a single mass detector (19). Also, novel itraconazole-loaded intravenous nanoparticles were evaluated on the basis of itraconazole and hydroxyitraconazole assay by the HPLC method with UV detection (20). For the determination of ketoconazole, tioconazole, econazole, miconazole and itraconazole in cosmetic antidandruff shampoos and lotions, the HPLC method with UV detection was used (21). According to the literature review, the only citations dealing with itraconazole and its impurities are Ph. Eur. 7 (9) and a study done by Dumarey et al. (10). Ph. Eur. 7 presents the gradient elution mode RP-HPLC method for the analysis of impurities only in pharmaceutical substances, with mobile phase comprising tetrabutylammonium hydrogen sulfate. The method given in the Ph. Eur. 7 was developed for the analysis of seven impurities. However, when only two impurities are of interest, a simpler method could be defined in order to shorten the analysis time and to enable utilization of simple mobile phase. The authors set as their goal the development and chemometrically supported optimization and validation of the method adequate for the quantitative analysis of itraconazole and its impurities B and F in pharmaceutical dosage forms, e.g., capsules. Accordingly, a systematic approach was applied; it was started with consideration of the most suitable starting chromatographic conditions.
EXPERIMENTAL
Chemicals Working standards of itraconazole, impurities B and F (Chemo, Quimica Sintética, Spain) were used to prepare solutions for the optimization and validation of the proposed method. All reagents used were of analytical grade. Acetonitrile HPLC grade (ACN) (Sigma, USA) and water – HPLC grade were used to prepare mobile phase, while the o-phosphoric acid (Carlo Erba, Italy) was used to adjust pH of the mobile phase. Working standards (itraconazole, impurity B and impurity F) were of Eur. Ph. quality. The analyzed pharmaceutical dosage form was Omicral® capsules (Medico Uno, Serbia), containing 100 mg of itraconazole.
RP-HPLC conditions The chromatographic system Waters Breeze (USA) consisted of a Waters 1525 Binary HPLC Pump, Waters 2487 UV/VIS dual absorbance detector and Breeze Software Win161
I. Kasagi} Vujanovi} et al.: Chemometrically assissted optimization and validation of RP-HPLC method for the analysis of itraconazole and its impurities, Acta Pharm. 63 (2013) 159–173.
dows XP for data collection. Separations were performed on a Zorbax Eclipse XDB-C18 (4.6 ´ 150 mm), 5 mm particle size column (Agilent Technologies, USA). UV detection was performed at 256 nm. The samples were introduced through a Rheodyne injector (USA) valve with a 20-mL sample loop. Mobile phases for the optimization were prepared according to the plan of experiments set by the Box-Behnken design (Table I). The resulting mobile phases were filtered through a 0.45-mm membrane filter (Alltech, Belgium). The optimal mobile phase composition was: acetonitrile/water pH 2.5 adjusted with o-phosphoric acid (50:50, V/V). Flow rate was 1 mL min–1 and the column temperature was 30 °C.
Standard solutions Stock solutions of itraconazole (1 mg mL–1), impurity B (10 mg mL–1) and impurity F (10 mg mL–1) were prepared in a mixture of methanol/tetrahydrofuran (50:50, V/V). Corresponding stock solutions were diluted with a mixture of acetonitrile/water pH 2.5 adjusted with o-phosphoric acid (50:50, V/V) to prepare a mixture containing 200 mg mL–1 of itraconazole and 1 mg mL–1 of each impurity. To prove the selectivity of the proposed RP-HPLC method, a placebo mixture was prepared in methanol/tetrahydrofuran (50:50, V/V) at the concentration ratio corresponding to the content in capsules. It was treated in the same manner as capsule powder used for the preparation of sample solution. Sample solution containing 200 mg mL–1 of itraconazole was used for selectivity assessment. For linearity testing from the stock solution, six solutions containing itraconazole were prepared in the mobile phase in the concentration range from 20 to 500 mg mL–1. Six solutions containing 0.1 to 2.5 mg mL–1 of each impurity were obtained by diluting stock solutions with the mobile phase.
Sample solution, solutions for estimating precision and accuracy For two different commercially available batches, the mass of the-ten-capsule content was determined. Then the quantity of the capsule powder corresponding to 50 mg of itraconazole was placed into a 50-mL volumetric flask and extracted with the methanol/tetrahydrofuran mixture (50:50 V/V) using an ultrasonic bath during 20 min. After filtration, clear filtrate was diluted with the mobile phase to prepare a series of six solutions containing 200 mg mL-1 of itraconazole. These solutions were used for estimating the precision as well. A laboratory mixture containing placebo (saccharose, maydis starch, purified water, Poloxamer 188 and hypromeloze), itraconazole and its impurities was prepared in the methanol/tetrahydrofuran mixture (50:50, V/V) in the ratio corresponding to the investigated tablets. Laboratory mixture was treated in the same manner as the capsule powder used for the preparation of solutions for estimating the precision. For quantitative analysis of the laboratory mixture, three series of dilutions, calculated as 80, 100 and 120 % of the concentrations corresponding to those in capsules, were prepared, with three solutions for each concentration:
162
I. Kasagi} Vujanovi} et al.: Chemometrically assissted optimization and validation of RP-HPLC method for the analysis of itraconazole and its impurities, Acta Pharm. 63 (2013) 159–173.
mixture (1) contained 160 mg mL–1 of itraconazole and 0.8 mg mL–1 of each impurity (80 %), mixture (2) contained 200 mg mL–1 of itraconazole and 1.0 mg mL–1 of each impurity (100 %), mixture (3) contained 240 mg mL–1 of itraconazole and 1.2 mg mL–1 of each impurity (120 %).
RESULTS AND DISCUSSION
When a new separation problem is faced, starting decisions concerning the type of stationary phase, solvent type and water phase nature should be made. These factors are usually selected based on prior knowledge or screening studies. According to high lipophilic properties of the analyzed substances, acetonitrile was selected as organic modifier in the mobile phase. Moreover, itraconazole and its impurities B and F are basic drugs with minor differences between their structures. At the side chain, itraconazole and impurity F possess butyl, impurity B 1-methylpropyl group and also triazole ring are attached in impurity B to position 1,2,4-triazol-4-yl, whereas in itraconazole and impurity F to position 1,2,4-triazol-1-yl. In order to solve the problem of separation of quite similar substances, a Zorbax Eclipse XDB-C18 column containing extra densely bonded and doubled endcapped stationary phase was chosen. In general, the application of such a stationary phase does not usually demand utilization of ion-pairing reagents or other additives in the mobile phase adjustment of the pH of the aqueous phase.
Method optimization At the next step, readily adjustable factors with a significant effect on selectivity, retention or resolution should be examined in more detail. In RP-HPLC, these factors are usually the concentration of organic solvent, temperature and aqueous phase pH which should be set to optimal values to succeed in separation. The most efficient way of setting the optimal region is to apply one of the available response surface designs. For this purpose, three level designs should be used and the most widely used are central composite design and Box-Behnken design. Three level designs are recommendable as they enable determination of a critical point (maximum, minimum, or saddle) in the response surface. Namely, the resulting polynomial function will contain linear, interactions and quadratic terms and have the following form: y = b0 +
å
k i =1
bi x i +
å
k i =1
bii x i + 2
å
k
b xi xj + e
1£ i £ j ij
(1)
where k is the number of variables, b0 is the constant term, bi represents the coefficients of the linear parameters, bij represents the coefficient of interaction parameters, bii represents the coefficient of quadratic terms, xi represents the variables and e is the residual associated with the experiments. In this study, Box-Behnken design was selected for the estimation of parameters in Eq. (1). It is based on three-level incomplete factorial designs. This design consists of three parts of four runs and replications at the central point. Within each part, two factors 163
I. Kasagi} Vujanovi} et al.: Chemometrically assissted optimization and validation of RP-HPLC method for the analysis of itraconazole and its impurities, Acta Pharm. 63 (2013) 159–173.
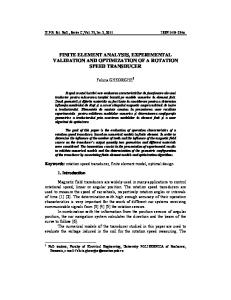
are arranged in a full two-level design, while the level of the third factor is set at zero (22). For three examined factors, this design requires twelve experiments, plus central point replications. Also, BBD is nearly rotable and particularly useful when the points on one or more corners of the cube represent factor-level combinations that are unacceptably expensive or impossible to test due to physical constraints on the experimentation (23). Acetonitrile content, pH of the aqueous phase and column temperature were selected as the independent variables, and qI/impF – q value of itraconazole and impurity F as the dependent variable. The response q value was selected based on the fact that between itraconazole and impurity F, which represent the critical pair, there is a great difference in peak heights. Realistic evaluation of the overall separation of these peaks could not be obtained by calculating RI/impF as the determination of peak width demands the construction of tangents and small variations in the slope imply large variations in the width. q criterion was suggested by Carle (24) who suggested the mathematical equation, which was derived from Kaiser’s equation (25) for the peak-to-valley ratio: qs,l = 1 – ((Hn ´ |tR,l – tR,s |)/(|tR,n – tR,s | ´ (Hl – Hs) + Hs ´ |tR,l – tR,s|))
(2)
where Hs and Hl are peak heights, Hv is the valley height, tR,s and tR,l are the retention times of the peaks, and tR,v is the time position of the valley as it is presented in Fig. 2. qs,l varies between 0, when peaks are completely overlapped, and 1, when peaks are separated at the baseline. At the next step, the experiments were conducted according to the plan of experiments and the obtained data are presented in Table I. Experimental design plan was defined and data analysis and calculations were performed using Design-Expert® 7.0.0. (Stat-Ease Inc., Minneapolis).
Fig. 2. Parameters for the calculation of q criterion from Kaiser’s equation.
164
I. Kasagi} Vujanovi} et al.: Chemometrically assissted optimization and validation of RP-HPLC method for the analysis of itraconazole and its impurities, Acta Pharm. 63 (2013) 159–173.
Table I. Plan of the experiments and obtained results A
B (–1)a
50.00 (–1)
2.50
70.00 (+1)
2.50 (–1)
C
qI/impF
30.00 (0)
1.0000
30.00 (0)
0.0000
50.00 (–1)
4.50 (+1)
30.00 (0)
1.0000
70.00 (+1)
4.50 (+1)
30.00 (0)
0.0000
50.00 (–1)
3.50 (0)
25.00 (–1)
1.0000
70.00 (+1)
3.50 (0)
25.00 (–1)
0.0000
50.00 (–1)
3.50 (0)
35.00 (+1)
1.0000
70.00 (+1)
3.50 (0)
35.00 (+1)
0.0000
60.00 (0)
2.50 (–1)
25.00 (–1)
0.9744
60.00 (0)
4.50 (+1)
25.00 (–1)
0.9973
60.00 (0)
2.50 (–1)
35.00 (+1)
0.9457
60.00 (0)
4.50 (+1)
35.00 (+1)
0.9940
60.00 (0)
3.50 (0)
30.00 (0)
0.9906
60.00 (0)
3.50 (0)
30.00 (0)
0.9865
60.00 (0)
3.50 (0)
30.00 (0)
0.9935
A – concentration of acetonitrile (%); B – pH of the aqueous phase; C – column temperature (°C); qI/impF – q value of itraconazole and impurity F. Coded values for factor levels in parentheses.
Quadratic response model was suggested as the most adequate for the response qI/impF. The calculated coefficients of the response model for coded factor levels are given in Table II. As it was expected, factor A (acetonitrile content) had the largest influence on the responses. The previously mentioned fact about the high lipophilicity of the analytes can easily explain the decrease of response values with the increase in the acetonitrile content in the mobile phase and the minus sign is assigned to the corresponding coefficient (b1). Response qI/impF was not influenced by factors B (pH of the aqueous phase) and C (column temperature) at all. In order to carry out deeper analysis of acetonitrile and pH of the aqueous phase influence, 3D graph was constructed. It was obtained by plotting qI/impF on the z-axis and acetonitrile content on x-axis, while the pH of the aqueous phase was on the y-axis. It was observed that the acetonitrile content should be set at 50 %, as the lowering of the qI/impF value is quite abrupt by its increase. Also, the 3D-surface is dropping very uniformly, confirming the insignificance of the water phase pH influence on the qI/impF value. By analyzing the results from Table II and the 3D-graph in Fig. 3, more than one acceptable condition could be selected. For example experiments 1, 5 and 7 gave the op-
165
I. Kasagi} Vujanovi} et al.: Chemometrically assissted optimization and validation of RP-HPLC method for the analysis of itraconazole and its impurities, Acta Pharm. 63 (2013) 159–173.
Table II. Calculated coefficients of the response modela qI/impF Coefficient
p-value
b0
0.99
< 0.0001b
b1
–0.5
< 0.0001b
b2
0.0088
0.095
b3
0.0038
0.4187 1
b12
0
b13
0
1
b23
0.0075
0.2681
b11
–0.48
< 0.0001b
b22
0.0088
0.2215
b33
0.0088
0.2215
R2
0.9997
adj. R2
0.9993
a
y = b0 + b1A + b2B + b3C + b12AB + b13AC + b23AD + b11A2 + b22B2 + b33C
b
Significance at p < 0.05.
qI/impF – q value of itraconazole and impurity F. adj R2 – the modification of R2 which gives a better estimate since it compensates for the addition of variables to the model.
Fig. 3. 3D graph: qI/impF = f (ACN content in % (V/V), pH of the aqueous phase). 166
I. Kasagi} Vujanovi} et al.: Chemometrically assissted optimization and validation of RP-HPLC method for the analysis of itraconazole and its impurities, Acta Pharm. 63 (2013) 159–173.
Table IIIA. Robustness testing
48
A
B
C
D
PimpB
PI
PimpF
(–1)a
(–1)a
(–1)a
(–1)a
47.656
49.053
9304.350
52 (+1)
2.3
2.3 (–1)
28
28 (–1)
0.9
1.1 (+1)
39.125
7569.500
37.766
48 (–1)
2.7 (+1)
28 (–1)
1.1 (+1)
41.595
7819.900
37.298
52 (+1)
2.7 (+1)
28 (–1)
0.9 (–1)
61.274
9570.850
51.771
48 (–1)
2.3 (–1)
32 (+1)
1.1 (+1)
39.788
7705.070
35.944
52 (+1)
2.3 (–1)
32 (+1)
0.9 (–1)
46.291
9349.400
49.09
48 (–1)
2.7 (+1)
32 (+1)
0.9 (–1)
49.488
9411.690
43.564
52 (+1)
2.7 (+1)
32 (+1)
1.1 (+1)
98.135
8049.720
39.554
50 (0)
2.5 (0)
30 (0)
1.0 (0)
40.467
8340.430
40.514
50 (0)
2.5 (0)
30 (0)
1.0 (0)
40.740
8499.770
41.024
50 (0)
2.5 (0)
30 (0)
1.0 (0)
40.319
8374.580
40.137
Table IIIB. Factor effects and Ecritical Factors
PimpB
PI
PimpF
A
16.23
74.5
3.43
B
19.06
231.5
0.43
C
10.66
63.0
–1.58
D
3.13
–1623.0
–10.38
Ecritical (a = 0.05)
38.015
461.524
6.982
A – concentration of acetonitrile (%); B – pH of the aqueous phase; C – column temperature (°C); D – flow rate (mL min–1); PimpB – peak area of impurity B; PI – peak area of itraconazole, PimpF – peak area of impurity F. Coded values for factor levels in parentheses.
timal value for I/impF. q The 3D graph confirmed that the content of acetonitrile in the mobile phase of 50 % was justified, while pH in the whole investigated region was acceptable, so final selection was made by the experimentator and it was 2.5.
Method validation After establishing the optimal separation conditions, the method was subjected to validation and the robustness, selectivity, linearity, precision, accuracy, limit of detection and limit of quantification were tested. In this paper, the approach proposed by Vander Heyden et al. (6) was applied for the robustness testing. The first step in this approach comprises selection of the factors to be tested. In the given analytical case, pH of the aqueous phase was taken as the quantitative, acetonitrile and column temperature as mixture-related and flow rate as the process variable. Further, factor levels were defined and are presented in Table IIIA. All chosen factors have a lower (–1) and an upper value (+1) and they are defined symmetrically around the nominal level (0). As far as the factor analysis is concerned, fractional factorial 24–1 design was chosen and the plan with 8 experiments was set for the investigation of four factors. In order to evaluate the linea167
I. Kasagi} Vujanovi} et al.: Chemometrically assissted optimization and validation of RP-HPLC method for the analysis of itraconazole and its impurities, Acta Pharm. 63 (2013) 159–173.
Fig. 4. Pareto charts PimpB, PI and PimpF, t-value = 2.44.
rity of the responses in the investigated range, three replications were added. The plan for the conduction of 11 experiments was defined using Design Expert 7.0 software (Table III). This step was followed by the definition of the responses that will facilitate the process of drawing relevant conclusions. The final goal of the proposed method is to quantify the analyzed substances and the authors have chosen responses which characterize quantification: PimpB – peak area of impurity B, PI – peak area of itraconazole and PimpF – peak area of impurity F. The experiments were conducted based on IIIA and the obtained results are presented in the same table. At the next step, effects were calculated using Design Expert 7.0 and the values calculated for factor effects are given in Table IIIB. The impact of the investigated factors on the method’s robustness can be weighted after graphical and statistical evaluation of the calculated factor effects. It is recommendable to use both approaches and compare the obtained results. In this study, first graphical evaluation by Pareto charts (Fig. 4) is presented for the estimation of the effects. Pareto charts estimate factor effects splitting the significant and non-significant ones by statistical t-line. Factor effects that are higher than the t value are significant and the obtained results are presented in Table IV. 168
I. Kasagi} Vujanovi} et al.: Chemometrically assissted optimization and validation of RP-HPLC method for the analysis of itraconazole and its impurities, Acta Pharm. 63 (2013) 159–173.
Table IV. Significance of factor effects
Response
Important effects from Pareto chart
Significant effects at a = 0.05 from Dong’s algorithm
PimpB
–
–
PI
D
D
PimpF
D
D
D – flow rate (mL min–1); PimpB – peak area of impurity B; PI – peak area of itraconazole; PimpF – peak area of impurity F.
After graphical estimation, statistical evaluation, which is considered more precise and allows definition of limits for a certain factor, was employed. In the present study, the authors have chosen evaluation by the algorithm of Dong. This approach is based on initial estimation of the error based on the effect distribution and followed by calculation of the margin of error value (ME). ME corresponds to the critical effect; therefore all effects exceeding ME are considered important. Detailed equations and definitions are
a)
b)
c)
Fig. 5. Representative chromatograms obtained under optimal chromatographic conditions of: a) laboratory mixture containing 200 mg mL–1 of itraconazole (tr = 10.232 min) and 1 mg mL–1 of each impurity (tr = 5.413 min for impurity B and tr = 11.403 min for impurity F); b) placebo mixture; c) sample solution (Omicral® capsules) (itraconazole), tr = 9.910 min and impurity B, tr = 5.305 min. 169
I. Kasagi} Vujanovi} et al.: Chemometrically assissted optimization and validation of RP-HPLC method for the analysis of itraconazole and its impurities, Acta Pharm. 63 (2013) 159–173.
Table V. Important parameters for linearity and accuracy Parameter
Itraconazole
Impurity B
Impurity F
Linearity a
42.63
89.78
59.91
b
41.92
1.05
0.56
R
0.9999
1.0000
1.0000
tb
0.617
3.083
1.726
Accuracy Concentration 1 (µg mL–1)
160
0.8
0.8
Recovery 1 (%)
101.2
98.5
94.3
Concentration 2 (µg mL–1)
200
1.0
1.01
Recovery 2 (%)
104.3
99.9
Concentration 3 (µg mL–1)
240
1.2
96.7 1.2
Recovery 3 (%)
105.1
95.0
97.6
a – slope, b – intercept, R – correlation coefficient; tb – t value for the intercept: ttab. = 22.571 (p = 0.05, n = 5) for itraconazole, and ttab. = 4.03 (p = 0.01, n = 5) for impurities.
given in Vander Heyden et al. (6) and Maskovic et al. (7). The obtained critical effects for the investigated system are presented in Table III. If the factor effect value is lower than Ecritical, the influence of that factor on the method’s performance is not significant. The significance of the effects evaluated statistically is given in Table IV. As it can be seen from Table IV, the most influential factor is D (flow rate), which is an operational factor and its change is not expected due to the utilization of the modern HPLC system. In general, a method could be considered robust if changes of factors in defined ranges do not influence the responses. The next parameter that was tested for the purpose of proper validation was selectivity. In Fig. 5. chromatograms of the laboratory mixture, placebo and analyzed sample are given. From the chromatogram of placebo it is obvious that no significant interfering peaks at the analyzed compounds retention times were observed and therefore the selectivity was proved. Linear relationships of the peak area over the mentioned concentration range for itraconazole and impurities B and F were obtained. All linearity parameters values (Table V) are within the linearity criteria which state R = 0.995 for active ingredients and R = 0.99 for impurities, and both cases tb was less than ttab. Important statistical parameters for the method precision evaluation were also considered. The calculated values of relative standard deviations (RSD) were 0.2 % for itraconazole and B 4.1 % for impurity. The obtained values fulfill suggested criteria (27). To evaluate the model accuracy of the proposed method, the recovery values for laboratory mixtures were calculated. Recovery value for itraconazole was 98–102 % and that for impurities B and F 80–120 % (Table V). 170
I. Kasagi} Vujanovi} et al.: Chemometrically assissted optimization and validation of RP-HPLC method for the analysis of itraconazole and its impurities, Acta Pharm. 63 (2013) 159–173.
Limit of detection and limit of quantification were experimentally determined. The signal-to-noise ratio of 3:1 and 10:1 were taken as LOD and LOQ, respectively, and were further confirmed by taking dilutions from the secondary stock solution till the peak area obtained was 3 (for LOD) and 10 (for LOQ) fold the standard deviation of six determinations. For impurity B LOQ is 0.05 mg mL–1 and LOD is 0.01 mg mL–1, while for the impurity F LOQ is 0.1 mg mL–1 and LOD is 0.05 mg mL–1. In order to prove the applicability of the developed method, sample solutions of two different commercially available batches were prepared and analyzed. In these two batches, the average mass of itraconazole was 10.43 mg per tablet, 0.023 mg per tablet of impurity B which is 0.23 % of the claimed itraconazole content. The content of impurity F was lower than the limit of detection.
CONCLUSIONS
For optimization and validation of the RP-HPLC method, suitable for the determination of itraconazole and its impurities B and F in pharmaceutical preparations, appropriate experimental designs were used. The optimization step was supported by the Box-Behnken design and simultaneous influence of acetonitrile content in the mobile phase, pH of the aqueous phase and the column temperature on the qI/impF was evaluated. At the beginning of method validation, fractional factorial 24–1 design was selected for robustness testing and the flow rate of the mobile phase was identified as a factor that influences the method significantly. Finally, all the other validation parameters were evaluated and the adequacy of the developed method was completely confirmed. Although the method described in this paper is the most appropriate for particular situation, it can be a very useful starting point in a situation when one has to analyze itraconazole and more than the two mentioned impurities. Acknowledgements. – The authors thank the Ministry of Education and Science of the Republic of Serbia for supporting these investigations within Project 172052.
REFERENCES 1. A. M. Siouffi and R. Phan-Tan-Luu, Optimization methods in chromatography and capillary electrophoresis, J. Chromatogr. A 892 (2000) 75–106; DOI: 10.1016/S0021-9673(00)00247-8. 2. A. Malenovi}, Y. Dotsikas, M. Ma{kovi}, B. Jan~i} Stojanovi}, D. Ivanovi} and M. Medenica, Desirability-based optimization and its sensitivity analysis for the perindopril and its impurities analysis in a microemulsion LC system, Microchem. J. 99 (2011) 454–460; DOI: 10.1016/j.microc.2011.06.022. 3. M. A. Bezerra, R. E. Santelli, E. P. Oliveira, L. S. Villar and L. A. Escaleira, Response surface methodology (RSM) as a tool for optimization in analytical chemistry, Talanta 76 (2008) 965–977; DOI: 10.1016/j.talanta.2008.05.019. 4. S. L. C. Ferreira, W. N. L. Dos Santos, C. M. Quintella, B. B. Neto and J. M. Bosque-Sendra, Doehlert matrix: A chemometric tool for analytical chemistry-Review, Talanta 63 (2004) 1061–1067; DOI: 10.1016/j.talanta.2004.01.015.
171
I. Kasagi} Vujanovi} et al.: Chemometrically assissted optimization and validation of RP-HPLC method for the analysis of itraconazole and its impurities, Acta Pharm. 63 (2013) 159–173.
5. Y. Vander Heyden and D. L. Massart, Review of the Use of Robustness and Ruggedness in Analytical Chemistry, in Robustness of Analytical Chemical Methods and Pharmaceutical Technological Products (Eds. M. W. B. Hendriks, J. H. De Boer and A. K. Smilde), Elsevier, Amsterdam 1996. 6. Y. Vander Heyden, A. Nijhuis, J. Smeyers-Verbeke, B. G. M. Vandeginste and D. L. Massart, Guidance for robustness/ruggedness tests in method validation, J. Pharm. Biomed. Anal. 24 (2001) 723–753; DOI: 10.1016/S0731-7085(00)00529-X. 7. M. Ma{kovi}, B. Jan~i}-Stojanovi}, A. Malenovi}, D. Ivanovi} and M. Medenica, Assessment of liquid chromatographic method robustness by use of Plackett-Burman design, Acta Chromatogr. 22 (2010) 281–296; DOI: 10.1556/AChrom.22.2010.2.10. 8. T. Raki}, A. Malenovi}, B. Jan~i}–Stojanovi}, D. Ivanovi} and M. Medenica, Avoiding the false negative results in LC method robustness testing by modifications of the algorithm of Dong and dummy factor effects approach, Chromatographia 75 (2012) 397–401; DOI: 10.1007/s10337-012-2196-6. 9. European Pharmacopeia, 7th ed., Council of Europe, Strasbourg 2011, pp. 2297–2299. 10. M. Dumarey, R. Sneyers, W. Janssens, I. Somers and Y. Vander Heyden, Drug impurity profiling: Method optimization on dissimilar chromatographic systems: Part I: pH optimization of the aqueous phase, Anal. Chim. Acta 656 (2009) 85–92; DOI: 10.1016/j.aca.2009.10.013. 11. D. Compas, D. J. Touw and P. N. F. C. de Goede, Rapid method for the analysis of itraconazole and hydroxyitraconazole in serum by high–performance liquid chromatography, J. Chromatogr. B 687 (1996) 453–456; DOI: 10.1016/S0378-4347(96)00245-9. 12. C. H. W. Koks, R. W. Sparidans, G. Lucassen, K. M. L. Crommentuyn and J. H. Beijnen, Selective high-performance liquid chromatographic assay for itraconazole and hydroxyitraconazole in plasma from human immunodeficiency virus-infected patients, J. Chromatogr. B 767 (2002) 103–110; DOI: 10.1016/S0378-4347(01)00550-3. 13. V. Srivatsan, A. K. Dasgupta, P. Kale, R. R. Datla, D. Soni, M. Patel, R. Patel and C. Mavadhiya, Simultaneous determination of itraconazole and hydroxyitraconazole in human plasma by high-performance liquid chromatography, J. Chromatogr. A 1031 (2004) 307–313; DOI: 10.1016/j.chroma.2003.11.061. 14. T. Uno, M. Shimizu, K. Sugawara and T. Tateishi, Sensitive determination of itraconazole and its active metabolite in human plasma by column-switching high-performance liquid chromatography with ultraviolet detection, Ther. Drug Monit. 28 (2006) 526–531; DOI: 10.1097/00007691200608000-00007. 15. P. Kubalec and E. Brand{teterová, Column-switching chromatographic determination of itraconazole and its metabolite hydroxy-itraconazole in human serum, Pharmazie 56 (2001) 397–400. 16. W. C. Young, D. Nam, H. K. Kyoung, W. H. Kyung, H. H. In, K. C. Byung, M. Yoon and J. Lee, High-performance liquid chromatographic-tandem mass spectrometric determination of itraconazole in human plasma for bioavailability and bioequivalence studies, Bull. Korean Chem. Soc. 27 (2006) 291–294; DOI: 10.5012/bkcs.2006.27.2.291. 17. L. Bai, M. M. Li, C. J. Zhao and T. T. Ma, Determination of itraconazole in human plasma by HPLC and studies of bioequivalence, Chinese Pharmaceut. J. 43 (2008) 1272–1274. 18. J. W. Wong, U. R. Nisar and K. H. Yuen, Liquid chromatographic method for the determination of plasma itraconazole and its hydroxy metabolite in pharmacokinetic/bioavailability studies, J. Chromatogr. B 798 (2003) 355–360; DOI: 10.1016/j.jchromb.2003.09.059. 19. L. Baietto, A. D’Avolio, G. Ventimiglia, F. G. De Rosa, M. Siccardi, M. Simiele, M. Sciandra and G. Di Perri, Development, validation, and routine application of a high-performance liquid chromatography method coupled with a single mass detector for quantification of itraconazole, voriconazole, and posaconazole in human plasma, Antimicrob. Agents Chemother. 54 (2010) 3408–3413; DOI: 10.1128/AAC.01807-09.
172
I. Kasagi} Vujanovi} et al.: Chemometrically assissted optimization and validation of RP-HPLC method for the analysis of itraconazole and its impurities, Acta Pharm. 63 (2013) 159–173.
20. W. Chen, B. Gu, H. Wang, J. Pan,W. Lu and H. Hou. Development and evaluation of novel itraconazole–loaded intravenous nanoparticles, Int. J. Pharm. 362 (2008) 133–140; DOI: 10.1016/j.ijpharm. 2008.05.039. 21. L. Gagliardi, D. De Orsi, P. Chimenti, R. Porra and D. Tonelli, HPLC determiantion of imidazole antimycotics in antidandruff cosmetic products, Anal. Sci. 19 (2003) 11951197; DOI: 10.2116/analsci. 19.1195. 22. S. L. C. Ferreira, R. E. Bruns, E. G. P. da Silva, W. N. L. dos Santos, C. M. Quintella, J. M. Davis, J. B. de Andrade, M. C. Breitkreitz, I. C. S. F. Jardim and B. B. Neto, Statistical designs and response surface techniques for the optimization of chromatographic systems, J. Chromatogr. A 1158 (2007) 2–14; DOI: 10.1016/j.chroma.2007.03.051. 23. R. L. Mason, R. F. Gunst and J. L. Hess, Statistical Design and Analysis of Experiments With Application to Engineering and Science, 2nd ed., Hoboken, New York 2003. 24. G. C. Carle, Determination of chromatographic resolution for peaks of vast concentration differences, Anal. Chem. 44 (1972) 1905–1906. 25. R. E. Kaiser, Gas Chromatographie, Portig, Leipzig 1960, p. 33. 26. F. Dong, On the identification of active contrasts in unreplicated fractional factorials, Stat. Sinica 3 (1993) 209–217. 27. J. B. Crowther, Validation of Pharmaceutical Test Methods, in Handbook of Modern Pharmaceutical Analysis (Eds. S. Ahuja and S. Scypinski), Academic Press, New York 2001, pp. 415–443.
173