Chemical Risk Assessment in the Potable Water Reclamation System in Beaufort West, South Africa Identified contaminants of emerging concern affecting human health Master of Science Thesis in the Master’s programme Infrastructure and Environmental Engineering
DEBORA FALK AND ANNA OHLIN
Department of Civil and Environmental Engineering CHALMERS UNIVERSITY OF TECHNOLOGY Gothenburg, Sweden 2015 Master’s Thesis 2015:131
Chemical Risk Assessment in the Potable Water Reclamation System in Beaufort West, South Africa Identified contaminants of emerging concern affecting human health Master of Science Thesis in the Master’s Programme Infrastructure and Environmental Engineering
DEBORA FALK AND ANNA OHLIN
Department of Civil and Environmental Engineering CHALMERS UNIVERSITY OF TECHNOLOGY Gothenburg, Sweden 2015
Chemical Risk Assessment in the Potable Water Reclamation System in Beaufort West, South Africa - Identified contaminants of emerging concern affecting human health Master of Science Thesis in the Master’s Programme Infrastructure and Environmental Engineering DEBORA FALK AND ANNA OHLIN © DEBORA FALK, ANNA OHLIN, 2015 Examensarbete/Institutionen för bygg- och miljöteknik Chalmers Tekniska Högskola 2015:131
Department of Civil and Environmental Engineering Division of Water Environment Technology Chalmers University of Technology SE-412 96 Göteborg Sweden Telephone: +46 (0)31-7721000
Chemical Risk Assessment in the Potable Water Reclamation System in Beaufort West, South Africa - Identified contaminants of emerging concern affecting human health Master of Science Thesis in the Master’s Programme Infrastructure and Environmental Engineering DEBORA FALK, ANNA OHLIN Department of Civil and Environmental Engineering Division of Water Environment Technology Chalmers University of Technology ABSTRACT Water reclamation can be one of the solutions when trying to solve the global water shortage. In the dry region Beaufort West, South Africa is a water reclamation plant supplying the inhabitants with drinking water, treated from wastewater. It is, however, important to evaluate the risks connected to this technology. The aim of this study was to conduct a chemical risk assessment in order to identify the potential risks in the Beaufort West water reclamation system that may lead to adverse human health effects from identified contaminants of emerging concern, and to suggest countermeasures to reduce the most severe risks. After identifying probabilities and consequences for the hazards and contaminants through interviews and sampling, a risk matrix was established and two increased risks identified. Both the risks were related to a high exposure of the hormone EE2, commonly used in contraceptives. One risk was connected to a long-term consumption of the final water and the other to unintentional ingestion during children’s prohibited bathing in a brine channel. No increased risks related to EE2 in case of possible technical failures were found. Neither was any risk connected to any other of the analysed contaminants found. Possible countermeasures were suggested to decrease the risks of exposure from EE2 and by performing a Multi-Criteria Decision Analysis was a Granulated Activated Carbon process recommended to be implemented. This study has shown that the Beaufort West direct potable water reclamation system results in very low risks of exposure from a large number of chemical contaminants. However, more research about hormones, degradation products and possible treatment technologies are needed. Further risk assessments should also be performed in this water reclamation system that include more contaminants as well as microbiological risks. Key words: Water Reclamation, Wastewater, Drinking Water, Water Treatment, Risk Assessment, Risk Matrix, South Africa, EE2, MCDA, Granulated Activated Carbon
I
Kemisk riskanalys av återvinningssystemet för dricksvatten i Beaufort West, Sydafrika - Utvalda föroreningar med påverkan på människors hälsa Examensarbete inom masterprogrammet Infrastruktur och Miljöteknik DEBORA FALK, ANNA OHLIN Institutionen för bygg- och miljöteknik Avdelningen för Vatten Miljö Teknik Chalmers Tekniska Högskola SAMMANFATTNING Att återvinna vatten är viktigt för att kunna lösa morgondagens stora utmaningar kring global vattenbrist. År 2010 byggdes ett vattenreningssystem där avloppsvatten återvinns till dricksvatten i staden Beaufort West i Sydafrika. Även om anläggningen har tjänat samhället väl i detta torra inland är det viktigt att undersöka vilka risker som finns kopplade till tekniken. Syftet med denna rapport var att göra en kemisk riskanalys för utvalda föroreningar i vattenåtervinningssystemet i Beaufort West som skulle kunna leda till negativa effekter för människors hälsa. Syftet var även att föreslå effektiva åtgärder för att minska de mest allvarliga riskerna. Genom intervjuer och provtagning av vattnet kunde sannolikheten för en fara samt dess konsekvens bli fastställda, vilka användes för att skapa en riskmatris. Två förhöjda risker identifierades, båda relaterade till höga halter av hormonet EE2, den aktiva substansen i bland annat p-piller. Den ena risken var kopplad till en långtidsexponering av EE2 från dricksvattnet och den andra risken skedde då barn från området olagligt badade i en kanal med restprodukter från reningsverket. Eventuella tillfälliga tekniska fel i processerna resulterade inte i förhöjda risker kopplade till EE2. Inte heller identifierades någon ökad risk kopplad till andra av de analyserade föroreningarna. Åtgärder föreslogs för att minska de förhöjda riskerna och dessa utvärderades i en multikriteriebeslutsanalys (MCDA). Resultatet visade att tillägg av granulerat aktivt kol (GAC) är den mest effektiva åtgärden för att minska de båda identifierade riskerna. Den här studien visar att dricksvattenanläggningen i Beaufort West med direkt återvunnet vatten innebär låga risker för ett stort antal kemiska föroreningarna funna i avloppsvatten. Mer forskning behövs dock kring hormoner, dess nedbrytningsprodukter samt möjliga reningstekniker men även en riskbedömning kring de mikrobiologiska riskerna för detta specifika reningsverk föreslås. Nyckelord: Vattenåtervinning, Avloppsvatten, Dricksvatten, Vattenrening, Riskbedömning, Riskmatris, Sydafrika, EE2, MCDA, Granulerat Aktivt Kol
II
TABLE OF CONTENTS 1.
INTRODUCTION ............................................................................................................ 1 Background ............................................................................................................... 1 Aim............................................................................................................................. 1 Research questions ................................................................................................... 2 Delimitations ............................................................................................................. 2
2.
THEORETICAL BACKGROUND ................................................................................ 3 Beaufort West water reclamation system .............................................................. 3 2.1.1. Activated sludge ................................................................................................. 5 2.1.2. Ultrafiltration ...................................................................................................... 5 2.1.3. Reverse osmosis ................................................................................................. 6 2.1.4. Advanced oxidation............................................................................................ 6 Contaminants of emerging concern and equivalent safe doses ............................ 6 Risk matrix................................................................................................................ 7 Multi-Criteria Decision Analysis ............................................................................ 8
3.
METHODLOGY .............................................................................................................. 9 Sampling .................................................................................................................... 9 Creating risk matrix ............................................................................................... 10 3.2.1. Assigning probabilities ..................................................................................... 11 3.2.2. Reference values .............................................................................................. 11 3.2.3. Assigning consequences ................................................................................... 12 3.2.4. Scales and tolerability levels ............................................................................ 13 3.3. Multi-Criteria Decision Analysis .......................................................................... 14
4.
RESULTS ........................................................................................................................ 16 Sampling results ..................................................................................................... 16 Risk matrix.............................................................................................................. 17 4.2.1. Assigned probabilities ...................................................................................... 17 4.2.2. Assigned consequences .................................................................................... 17 4.2.3. Forming risk matrix .......................................................................................... 18 Removal of EE2 ...................................................................................................... 18 Countermeasures .................................................................................................... 19 4.4.1. Risk reduction .................................................................................................. 19 4.4.2. Cost................................................................................................................... 21 Multi-Criteria Decision Analysis .......................................................................... 21
5.
DISCUSSION ................................................................................................................. 24 Assumptions ............................................................................................................ 24 Sampling and analysed contaminants .................................................................. 24 Probabilities and consequences ............................................................................. 25 The countermeasures and MCDA ........................................................................ 26 Further studies........................................................................................................ 27
6.
CONCLUSION ............................................................................................................... 28
BIBLIOGRAPHY .................................................................................................................. 29
III
PREFACE AND ACKNOWLEDGEMENTS This Master’s Thesis was performed during spring and summer 2015 at Chalmers University of Technology, Sweden, in cooperation with Beaufort West Municipality, Chris Swartz Water Utilization Engineers and the Water Research Commission, all in South Africa. It was partly done by gathering data and information during a 10 week long field visit financed by SIDA (Minor Field Study scholarship). Firstly, we would like to thank Ass. Pr. Thomas Pettersson, our supervisor at Chalmers, for all of his support. We also wish to send special gratitude to our South African supervisor, Mr Chris Swartz, for all of his help in our project and for the arrangements during our stay. Other people that have helped us in South Africa whom we want to acknowledge include: Linda van Zyl Magda Pretorius July Jacobs Christopher Wright Bettina Genthe Herman Smith Shawn Chaney Lesley Petrik Goliat Malouw Franklin Jansen Stanley Mjada Richard Nongxaza This project would not have been the same without the help from all these people, thank you. Göteborg, July 2015 Debora Falk and Anna Ohlin
IV
DEFINITIONS Brine stream
Waste stream containing elevated concentrations of total dissolved solids (Asano, et al., 2007).
Equivalent safe dose
The amount of a contaminant acceptable to consume per day per kilogram body weight during a lifetime.
Hazard
A source of potential harm (ISO/IEC, 2002).
Therapeutic dose
The quantity of any substance required to effect the cure of a disease (MediLexicon, 2015).
NOAEL
The highest exposure level with no significant increase in adverse effect and an ingestion of a contaminant of this concentration has not shown to be harmful (US EPA, 2014).
Reference value
The amount of a contaminant per litre acceptable to consume.
Risk
Calculated as the consequence multiplied by the probability.
V
ABBREVIATIONS ADI
Acceptable Daily Intake
EE2
17α-ethinylestradiol
ICEC
Identified Contaminant of Emerging Concern
GAC
Granular Activated Carbon
MCDA
Multi-Criteria Decision Analysis
NOAEL
No Observed Adverse Effect Level
QFS
The company Quality Filtration Systems
RO
Reverse Osmosis
S-ADI
Surrogate Acceptable Daily Intake
TDI
Tolerable Daily Intake
TTC
Threshold of Toxicological Concern
UF
Ultrafiltration
WRC
Water Research Commission
WRP
Water Reclamation Plant
WWTP
Wastewater Treatment Plant
VI
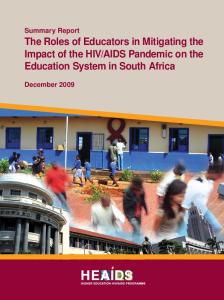
1. INTRODUCTION This introductory chapter includes a background to present a broader context regarding issues connected to water reclamation and contaminants of emerging concern. The aim is presented, as well as the research questions and the delimitations. Background There are approximately 1.1 billion people on earth having physical water scarcity and the available water resources are continuing to shrink (AWWA, 2008). In South Africa, more than 40 per cent of the freshwater systems are in a critical condition and this has created an urgent need for introducing new water sources (WWF, 2012). Wastewater that has been adequately treated can be used as reclaimed water and is therefore considered as a valuable resource in water stressed countries (US EPA, 2012). The microbiological risks of using reclaimed water are significant and are frequently discussed (Hamilton, et al., 2005).The potential health risks associated with exposure to chemicals in reclaimed water are however other challenges that need to be considered (Laws, et al., 2011). The South African Water Research Commission (WRC) was established to promote and generate knowledge about water (WRC, 2015). A project founded by the WRC started in 2014 to address the health impact and risk priorities from emerging contaminants in wastewater for direct potable reuse in South Africa (Swartz, 2014). This master thesis was a part of this WRC project. Beaufort West is located in the dry hinterland of the Southern part of South Africa, see Figure 1 (BWM, 2010). The town has approximately 41 000 inhabitants, all connected to the municipal drinking water system. In Beaufort West, no big industries are present within the municipality (Ivarsson & Olander, 2011). People living in informal settlements are connected to the water and wastewater system, but struggle with poverty and a high infection rate of AIDS (BWM, 2013). The drinking water in town is mainly collected from boreholes and dams, however due to frequent droughts in the past years a direct wastewater reclamation system for drinking water production was constructed in the year 2010 (Ivarsson & Olander, 2011).
Figure 1. Dot indicates the location of Beaufort West in South Africa.
Aim The aim of this project was to identify chemical risks in the Beaufort West water reclamation system that may lead to adverse human health effects for the community from identified contaminants of emerging concern and to suggest countermeasures to reduce the most severe risks. 1
Research questions The following research questions were used to fulfil the aim: What contaminants of emerging concern are present in the water passing the reclamation system? Are the treatment processes in the Beaufort West water reclamation system able to reduce concentration of the identified contaminants of emerging concern originating from the wastewater? What hazards may result in unacceptable exposure from the identified contaminants of emerging concern from the water reclamation system? What risks do these hazards result in? Which are the most feasible countermeasures to reduce the most severe risks? Delimitations The following statements have been used in order to delimit the aim of this study: The study area includes the water reclamation system, from the wastewater inflow to the point where the potable water leaves the system. A constant concentration of the studied contaminants in the inflow is assumed. Only failures leading to contaminants reaching the community will be considered. Thereby, risks related to disruption leading to no distribution of drinking water, such as pump failure, are not included.
2
2. THEORETICAL BACKGROUND The theoretical background includes information about the water reclamation system in Beaufort West and the identified contaminants’ guideline values, together with background information used for the methodology. Beaufort West water reclamation system The water reclamation system in Beaufort West consists of a Wastewater Treatment Plant (WWTP) connecting to a Water Reclamation Plant (WRP), see Figure 2 (Ivarsson & Olander, 2011). The water is fed to a reservoir after the treatment and mixed with water collected from boreholes and surface water that has been treated in a drinking water treatment plant. From the reservoir the mixed water is then distributed to the community. Approximately 30 per cent of the consumed water from the reservoir originates from the WRP. The stormwater is not connected to the wastewater infrastructure.
Figure 2.
The water infrastructure of Beaufort West. The dashed rectangle marks the water reclamation system. DWTP=Drinking Water Treatment Plant.
The WWTP consists of a conventional treatment train, see Figure 3 (Ivarsson & Olander, 2011). The wastewater passes a screening and a grit removal, followed by activated sludge with ferric chlorine addition. The last process in the WWTP is secondary settling.
Figure 3.
Flow chart for the Beaufort West water reclamation system including WWTP and WRP.
The first processes in the WRP consist of a sedimentation basin followed by a rapid sand filtration (Ivarsson & Olander, 2011). The purpose of this pre-treatment is to relieve the pressure of organic and inorganic particles on the membranes to prevent fouling and scaling on the Ultrafiltration (UF) and the Reverse Osmosis (RO). The final treatment consists of advanced oxidation of UV/H2O2 that, together with chlorination, remove and prevent regrowth of
3
pathogens in the distribution system. The RO, UF and the advanced oxidation process are producing brine streams containing the removed organic matter and other contaminants. The brine streams represent approximately 20 per cent of the inflowing water volume to the WRP according to the operator at the WRP1. The water from these streams is led to a channel, see Figure 3 and Figure 4, where it is then pumped away to be used for irrigation of sports fields and a golf course in the area, according to the technical manager at the municipality2. The superintendent of the WWTP 3 claims that children from the nearby community often are bathing in the brine channel on weekends and holidays, although these activities are not allowed. Previously, a fence was used to prevent unauthorised people from reaching the brine channel. This fence has, however repeatedly been stolen.
Figure 4.
Beaufort West water reclamation system (Google earth (July 6, 2015). Beaufort West, South Africa. 32° 22’ 53.5”S, 22° 35’ 08.4”E, AfriGIS (Pty) Ltd, 2015.)
The WRP is remotely monitored and operated by private actors. All processes in the plant apart from the advanced oxidation, are monitored and operated by the company Quality Filtration Systems (QFS) whose office is located in the outskirts of Cape Town, about 500 kilometres southwest of Beaufort West. The status of the plant is controlled online automatically by QFS´s own monitoring system and all actions that could affect the quality of the water have to be approved by them. This include adjusting the flow and the dosage of chemicals among others. According to the director of QFS4 are the processes equipped with alarm systems that will either give a warning or shut down the whole plant automatically in case of any indication of decreased treatment efficiency. This includes parameters like changes in pressure in membranes, changing turbidity or pump failures. The permanent staff members at the WRP on site are responsible for the everyday operation, like filling up chemicals and making sure that
1
Franklin Jansen (Operator, Beaufort West NEWater), interviewed by authors May 26, 2015. Christopher Wright (Manager, Technical Services, Beaufort West Municipality), private email to authors May 12, 2015. 3 July Jacobs (Superintendent, Water and Wastewater, Beaufort West Municipality), interviewed by the authors April 22, 2015. 4 Herman Smit (Director, Quality Filtration Systems), interviewed by the authors May 29, 2015. 2
4
the processes are operating at the right time. The processes are checked by a specialist visiting the site roughly once per week says the director at QFS. The advanced oxidation treatment process is manufactured by the company Hanovia that also is responsible for the monitoring and the operation of this process. They are operating from an office located in Cape Town and Hanovia’s alarm systems as well as their operation are similar to QFS’s. The activated sludge, UF and RO together with the advanced oxidation processes are those processes used in Beaufort West water reclamation system with highest expected removal efficiency of chemical contaminants (NRMMC, 2008). These processes are therefore described in more detail below. 2.1.1.
Activated sludge
Microorganisms are used for degradation of biological matters and contaminants in the activated sludge process, and several parameters affect the efficiency, including retention time, changes of bacterial flora, sewage composition, aeration level and the balance between the available nutrition and mass of microorganisms (Ahansazan, et al., 2014; Esparza, et al., 2006; Gray, 2004). A common problem caused either by too low or too high sludge age is generated foam (Ahansazan, et al., 2014), which can affect later treatment steps and be long lasting (Gray, 2004). Another problem is that several industrial chemicals in wastewater have shown to be toxic to the bacteria in the process, which could lead to the transfer of untreated water before new bacteria can be introduced to the system (Yi, et al., 2006). The system used in Beaufort West is an aerobic process where oxygen is introduced to the water by aerators powered by electricity (Ivarsson & Olander, 2011). This could lead to short periods of less sufficient treatment in case of power failures, which, according to the superintendent at the WWTP1, happens approximately twice per month. 2.1.2.
Ultrafiltration
UF is used to separate molecules and colloids that are larger than the filter diameter, which varies between 1 and 100 nm from the water (Baker, 2012). The pore size used in Beaufort West is 40 nm, and several studies have shown that this type of membrane technology is highly effective at removing emerging contaminants (Adham, et al., 2005). The treatment technology is based on basic separation principals and size exclusion, which results in treated water passing through the membrane and untreated water leaving the process through a brine stream (Ivarsson & Olander, 2011). One big disadvantage with UF is that particles accumulate on the membrane surface leading scaling and fouling causing a higher pressure as well as a decreased flux. Therefore, both backwashing and chemical cleaning are necessary to keep the process efficient. A too high pressure is accordingly problematic and the pressure is therefore monitored and used as the most important indicator of the treatment efficiency according to the director at QFS2. Low pressure may also cause problems, especially rapidly decreasing pressure. This interprets a breakage in the membrane that could lead to leakage of contaminants.
1
July Jacobs (Superintendent, Water and Wastewater, Beaufort West Municipality), interviewed by the authors April 22, 2015. 2 Herman Smit (Director, Quality Filtration Systems), interviewed by the authors May 29, 2015. 5
2.1.3.
Reverse osmosis
In the RO system, dissolved materials are removed from the water under high pressure, separating the treated and untreated water by a membrane (Asano, et al., 2007). The separation is based on applying a pressure larger than the osmotic pressure on the untreated side where the contaminant concentration is higher (Ivarsson & Olander, 2011). This results in reversing the diffusion, called osmosis, that otherwise usually occurs when molecules move from one region of a substance concentration to another through a semi-permeable membrane, striving for equilibrium. From the concentrated side, where water is pressed through the membrane, a brine stream is produced as a waste product. The RO is highly effective for removal of chemicals (NRMMC, 2008), but pre-treatment is essential due to scaling and fouling, leading to shorter life length of the membrane (Asano, et al., 2007). The RO membrane used in the Beaufort West WRP is, according to the director at QFS1, of the type BW30-400 elements used for brackish water (BW) with an active area of 400 square feet. A failure in this process is often revealed when a change of pressure is occurring, similar to the UF. 2.1.4.
Advanced oxidation
By applying hydrogen peroxide (H2O2) in the inflowing water in combination with UV light, the good oxidation agents hydroxyl radicals (·OH) are generated (US EPA, 2015c). The hydroxyl radicals can in many cases effectively destroy contaminants in the water, including pharmaceuticals and personal care products. A high quality of the inflowing water is important though to retain a sufficient system since both organic and inorganic compounds can be degraded and the hydroxyl radicals are non-selective. The degradation is therefore affected by different parameters including the organic matter content, alkalinity and nitrite concentration where these compounds can work as scavengers and consume hydroxyl radicals. This results in less efficient treatment for the intended contaminants. The need for a high quality on the inflowing water makes this process suitable as the final step in a water treatment plant (US EPA, 2015c). The decreasing of UV intensity with time, together with fouling occurring on the lamp are examples of reduced efficiency in the absence of good maintenance. Another concern this treatment process raises is excess of peroxide, which can counteract the removal effect. The Beaufort West WRP uses a low-pressure process for the advanced oxidation, according to the director of QFS1, with a UV dose of around 54 mJ/cm2 and a H2O2 dose around 2 mg/L. Contaminants of emerging concern and equivalent safe doses Genthe et al. (2014) have presented a list of contaminants of emerging concern that are recommended to be prioritised when monitoring reclaimed water in South Africa, see Table 1. This list is a compilation of previous studies on common contaminants in wastewater adapted to the South African context.
1
Herman Smit (Director, Quality Filtration Systems), interviewed by the authors May 29, 2015. 6
Table 1. Prioritised contaminants of emerging concern (Genthe, et al., 2014). Group Industrial Chemicals
Contaminant TDCPP TCEP Lopromide Benzo(a)pyrene
Pesticides, biocides and herbicides
Atrazine Terbutylazine Imidacloprid Simazine
Natural Chemicals
Caffeine 17 β-estradiol
Pharmaceuticals and metabolites
Lamivudine Stavudine Carbamazepine Cinchonidine Cinchonine Paracetamol Triclosan Bisphenol A N-Nitrosodimethylamine
Personal Care products Household chemicals and food additives Transformation products
NRMMC (2008) recommends the use of the following guideline values for contaminants in reclaimed drinking water during long-term exposure:
Acceptable Daily Intake (ADI) and Tolerable Daily Intake (TDI), are usually calculated by applying a safety factor to a concentration corresponding to the No Observed Adverse Effect Level (NOAEL) (WHO, 2011b). Surrogate Acceptable Daily Intake (S-ADI) is used for pharmaceuticals and derived by using the therapeutic dose divided by a safety factor (NRMMC, 2008). Threshold of Toxicological Concern (TTC) is dividing the chemicals into toxicity groups, which gives them a representative dosage and includes a safety factor (NRMMC, 2008).
These dosages can be summarised under the concept equivalent safe dose with the unit µg contaminant/kg body weight/day. Risk matrix When analysing the risks a risk matrix can be used to visualise the severity of several events with the probability scale located at the y-axis and the consequence scale at the x-axis, see Figure 5 (David & Wilkinson, 2009). Each event identified and assessed will then be presented in the risk matrix grid being assigned a risk priority number that is the consequence multiplied by the probability (WHO & IWA, 2009). The highest risk is located in the upper right corner and has, in the example in Figure 5, the risk priority number 25. In addition, the lowest risk is located in the lower left corner and has the risk priority number 1. In order to evaluate risks, the “As Low As Reasonable Practicable” (ALARP) principle can be used (Lindhe, 2010). The risks are then considered to be in one of the three different risktolerability levels; unacceptable, acceptable or in the ALARP region, which means that they are acceptable if it is unreasonable due to technical or economic reasons to reduce them, see Figure 5. 7
Figure 5.
Schematic picture of a risk matrix.
Table 2 shows the levels of consequence and probability used by WHO (2005) and NRMMC (2008). The scales of the axis can be linear or non-linear and can be assigned different weights if the consequence and the probability are considered to contribute differently to the overall risk level (Ivarsson & Olander, 2011). Table 2. Levels of axis used for probability and consequences in the risk matrix. Level
Probability Descriptor
Description (WHO, 2005)
Consequence Descriptor Description (NRMMC, 2008)
5
Almost certain
Once per day
Catastrophic
Major impact for large population
4
Likely
Once per week
Major
Major impact for small population
3
Moderate
Once per month
Moderate
Minor impact for large population
2
Unlikely
Once per year
Minor
Minor impact for small population
1
Rare
Once every five years or has never occurred
Insignificant
Insignificant or not detectable
Multi-Criteria Decision Analysis Multi-Criteria Decision Analysis (MCDA) is a set of decision-making techniques used for ranking countermeasures in a structured way by using a set of criteria (DCLG, 2009). Countermeasures can also be called risk reduction options or similar. In drinking water applications are the criteria of risk reduction and cost of each countermeasure usually used (Lindhe, et al., 2013). The objectives, which in drinking water applications are the suggested countermeasures, are given scores based on how they are expected to perform for each criteria (DCLG, 2009). The criteria are further ranked based on their importance for the result. The risk reduction may for example be considered more important than the cost of a countermeasure. After obtaining the results from the MCDA, a sensitivity analysis should be done to see how the ranking of the criteria affect the final score (DCLG, 2009). This increases the credibility of the MCDA and the most influential criteria can be further evaluated.
8
3. METHODLOGY The methodology used to fulfil the aim is described in this chapter. The contaminants and hazards used in the analysis are presented as well as the method used to assign the consequence and probability in the risk matrix. Finally, the procedures used for the Multi-Criteria Decision Analysis and the sensitivity analysis are explained. Sampling The identified contaminants of emerging concern (ICEC) found in Table 1 were prioritised by Genthe (2014). Those prioritised contaminants that also were possible to analyse with standardised methods are presented in Table 3. The contaminant 17 β-estradiol was not possible to analyse and was therefore substituted by the similar hormone 17α-ethinylestradiol (EE2) (Fredj, et al., 2015). Table 3.
The detected and analysed contaminants as part of the prioritised list of contaminants of emerging concern for monitoring reclaimed water in South Africa (Genthe, et al., 2014).
Group Industrial Chemicals Pesticides, biocides and herbicides
Personal Care products
Contaminant Iopromide Atrazine Terbutylazine Imidacloprid Simazine Caffeine EE2 Lamivudine Stavudine Carbamazepine Cinchonidine Cinchonine Paracetamol Sulfamethoxazole Triclosan
Sampling 1 Detection Not detected Detected Detected Detected Detected Detected Detected Detected Not detected Detected Detected Not detected Detected Detected Detected
Sampling 2 Quantitative Not analysed Analysed Analysed Analysed Analysed Not analysed Analysed Analysed Not analysed Analysed Analysed Not analysed Analysed Analysed Analysed
Household chemicals and food additives
Bisphenol A
Detected
Analysed
Natural Chemicals Pharmaceuticals and metabolites
The first sampling took place in April 22nd 2015 and the analyses were performed by LiquidTech based at the University of the Free State in Bloemfontein, South Africa. Qualitative analyses for each of the contaminants were made on eight sampling points, see Figure 6. Four of these samples were considered more important due to the location of where they were taken. Therefore, new samples were taken in May 25th 2015 at these locations and quantitative analyses were made to obtain concentrations of the contaminants. Caffeine was a prioritised contaminant by Genthe (2014) because of its usage as an indicator of wastewater in unknown water sources. It has a low toxicity though and the presence of wastewater was obviously already known. Caffeine was therefore excluded in the quantitative analysis after discussions with Genthe1. Iopromide, Stavudine and Cinchonine were excluded due to their absence in the qualitative analysis.
1
Bettina Genthe (Senior resercher, CSIR Natrual Resources and the Environment), interviewed by the authors May 28, 2015. 9
Figure 6.
The sampling location for quantitative and qualitative analysis.
All samples were taken in dark tinted bottles of one litre which were filled to the top to prevent air in the bottles. Tin foil was placed on the bottle mouth to additionally prevent air entering before closing the bottle with a screw cap. Double pairs of gloves, which were washed or changed between each sample point, were used during the sampling. The samples from the WWTP were taken with the help of a bucket on a stick and a funnel to fill up the bottles and the bucket and funnel were washed before being reused. The samples from the WRP were taken from taps inside the plant after letting the taps flush for about a minute and rinsing each bottle with sampling water two to three times before taking the actual sample. The samples were sent to the analysing laboratory in a styrofoam box filled with ice packets and ice cubes. Creating risk matrix The following hazards that could lead to health risks caused by exposure from the ICECs were identified: A. Insufficient treatment in the WWTP B. Insufficient treatment in the WRP (excluding advanced oxidation) C. Insufficient treatment in the advanced oxidation process D. Ingestion of water from the brine channel E. Contaminants constantly present in the drinking water Hazards A, B and C are related to occasional technical failures in their corresponding treatment systems. The differentiation between Hazard B and C was made due to the finding in the qualitative analysis that the advanced oxidation contributed in decreasing four of the ICEC´s concentrations under the detection limit. The advanced oxidation process was therefore considered more important for the overall contaminant removal, and the removal efficiency of this single process was evaluated. Hazard D is related to contaminants in the brine channel. It was included since unintentional ingestion also may lead to negative health impacts for the individuals bathing in the channel. These activities are prohibited but they are still considered to be a risk connected to the water reclamation system that may lead to a negative health impact for the individuals in the community. The ICECs that are always present in the effluent and therefore constantly consumed by the population through the drinking water are included in Hazard E. 10
3.2.1.
Assigning probabilities
For the hazards related to insufficient treatment (A, B and C) the probability for any event leading to a decreased water quality was used. The accumulated events sum up to the probability. For instance, if both electrical failure as well as foam building occur in the WWTP, then the probability for both events together will be used in the hazard connected to failure in the WWTP (Hazard A). To estimate the frequency of failures for the different processes information from interviews during field visits were used. The staff at the WRS and at QFS did, during these interviews estimate how often failures occur based on their experience. This, because it was not possible to access to raw data of failures. The probability of unintentional ingestion, Hazard D, was assigned based on how often one person is estimated to be bathing in the brine channel. This data was achieved from interviewing employees at the WWTP. Hazard E was assigned the highest probability due to the constant exposure of ICECs from the drinking water. 3.2.2.
Reference values
When calculating the reference value for long-term exposure from contaminated drinking water a body weight of 70 kg and an intake of two litres of water per day are made according to NRMMC (2008), see Equation (1). The equivalent safe doses used are presented in Table 4.
To calculate the short-term reference value used during failures in the treatment plant, the longterm reference value was multiplied by the safety factors found in Table 4, see Equation (2). Long-term reference value = Short-term reference value × Safety factor
(2)
This was done since it is possible to tolerate a higher concentration during a shorter time. These short-term reference values therefore represent a concentration similar to the therapeutic doses or NOAEL-values. Table 4. Contaminant
Equivalent safe doses, classes and safety factors.
Equivalent safe dose (μg/kg body weight/day) 4.3 x10⁻⁵ EE2 10 Atrazine 50 Bisphenol A 2.8 Carbamazepine 1.6 Cinchonidine 60 Imidacloprid 2 Lamivudine 50 Paracetamol 0.52 Simazine 10 Sulfamethoxazole 2.2 Terbuthylazine 1.5 Triclosan * Calculated from therapeutic dose ** Class III
Class S-ADI ADI TDI S-ADI S-ADI * ADI S-ADI * ADI TDI ADI TDI TTC**
Reference (class) (NRMMC, 2008) (WHO, 2011a) (NRMMC, 2008), (NRMMC, 2008) (Petrik, et al., 2014) (EFSA, 2013) (Petrik, et al., 2014) (NRMMC, 2008), (WHO, 2011a) (NRMMC, 2008) (WHO, 2011a) (NRMMC, 2008)
Safety factor 10 000 100 5 000 1 000 1 000 100 1 000 100 1 000 100 100 100
Reference (safety factor) (NRMMC, 2008) (WHO, 2011a) (EFSA, 2006) (NRMMC, 2008) (Petrik, et al., 2014) (EFSA, 2013) (Petrik, et al., 2014) (EMA, 1999) (WHO, 2011a) (NRA, 2000) (WHO, 2011a) (NRMMC, 2008)
The Australian guidelines for water recycling use the assumption of a body weight of 13 kg for a child (NRMMC, 2008), and this value was used during calculations for the reference value regarding ingestion during bath. The exposure factors handbook from US EPA (2011) recommends the assumption of water ingestion while bathing for children to be 90 mL/event 11
as an exposure factor. This is based on studies with 45 minutes long events for the children bathing and the use of the 97th percentile value. It was also assumed that each child is exposed on average once per week. The equivalent safe dose corresponding to long-term exposure was used due to information indicating that the same children revisit the brine channel and get repeated exposure. The reference value for ingestion during bathing was therefore calculated as shown in Equation (3). (3)
In Table 5 follows the calculated reference values for the contaminants. Table 5. Reference values for long term, short term and ingestion during bath. 1 2 3 4 5 6 7 8 9 10 11 12
3.2.3.
Reference value EE2 Atrazine Bisphenol A Carbamazepine Cinchonidine Imidacloprid Lamivudine Paracetamol Simazine Sulfamethoxazole Terbuthylazine Triclosan
Long-term exposure [μg/L] 0.001505 350 1 750 98 56 2 100 70 1 750 18 350 77 53
Short-term exposure [μg/L] 15 35 000 8 750 000 98 000 56 000 210 000 70 000 175 000 18 200 35 000 7 700 5 250
Ingestion during bath [μg/L] 0.002 482 2 407 135 77 2 889 96 2 407 25 482 106 72
Assigning consequences
To obtain the consequences, the concentration was divided by the reference value corresponding to the hazard, see Equation (4). This means that if the consequence is 2 the consumers ingest double of the amount set as the reference value. A consequence of 1 corresponds to consumption equal to the reference value and so on.
(4) When identifying the concentrations for the hazards connected to insufficient treatment (A, B and C) a conservative approach was used by assuming that no treatment of the ICEC is possible in the corresponding processes during the hazard. For example, a failure in the UF means that Hazard B is occurring. It is then assumed that no treatment of any ICECs is possible in the whole WRP during this failure. The treatment efficiencies obtained from the sampling results were used to calculate the expected removal after the potential failure. The concentrations were then calculated according to Table 6.
12
Table 6. Input for calculation of consequences for the different hazards. Hazard
Reference value Concentration during hazard
A Insufficient treatment in the WWTP
B Insufficient treatment in the WRP (excluding advanced oxidation)
Short-term exposure Concentration in influent times removal efficiency of WRP
Short-term exposure Concentration before WRP times removal efficiency of advanced oxidation
C Insufficient treatment in the advanced oxidation process Short-term exposure Concentration before advanced oxidation
D Ingestion of water from the brine channel Ingestion during bath Removal in WRP times 5
E Contaminants constantly present in the drinking water Long-term exposure Effluent times 0.3
For Hazard D, ingestion was assumed when children from the community used the brine channel for bathing. All contaminants removed from the WRP are assumed to end up in the brine streams where the flow is approximately 1/5 of the total inflowing wastewater. The concentration was therefore calculated as the sum of the removal in the WRP times five, see Table 6. The people connected to the drinking water system are considered to get 30 per cent of their daily intake of water from the water reclamation system, as this is the dilution in Beaufort West through the use of surface water and boreholes. The long-term exposure through drinking water is therefore calculated with the factor 0.3 as seen in Table 6. No dilution is assumed for shortterm exposure, due to the possibility that only water from the WRP is consumed during a failure. 3.2.4.
Scales and tolerability levels
Table 7 shows the probability and consequence scales corresponding to the levels. When assigning the probability to the different hazards the scale by WHO (2005) was used. For the consequence, the levels were based on the description from NRMMC (2008) see Table 2 (page 8) and the final intervals were determined after discussions with Genthe1. Table 7. Probability and consequence scales Probability Scale P Description (WHO, 2005) 16
5
Once per day
Consequence Scale Interval C=c/RV C ≥ 1000 81
8
4
Once per week
27
100 ≤ C < 1000
Major impact for small population
4
3
Once per month
9
10 ≤ C < 100
Minor impact for large population
2
2
Once per year
3
1≤ C < 10
Minor impact for small population
1
1
Once every five years or has never occurred
1
1>C
Insignificant or not detectable
Description (NRMMC, 2008) Major impact for large population
A risk with a higher consequence and lower probability (e.g. air plane crash) is often perceived as more serious than a risk with a lower consequence but higher probability (e.g. car crash). This, even though the total risk often is higher in the second case. The consequence scale does in this risk assessment, due to this reason, increase more for each level compared to the probability. The scales are defined as power functions, see Equation (5) and Equation (6). 𝑆𝑐𝑎𝑙𝑒𝑝𝑟𝑜𝑏𝑎𝑏𝑖𝑙𝑖𝑡𝑦 = 2𝑙𝑒𝑣𝑒𝑙−1 𝑆𝑐𝑎𝑙𝑒𝑐𝑜𝑛𝑐𝑒𝑞𝑢𝑛𝑐𝑒 = 3𝑙𝑒𝑣𝑒𝑙−1
(5) (6)
1
Bettina Genthe (Senior resercher, CSIR Natural Resources and the Environment), interviewed by the authors May 28, 2015. 13
Further, using the ALARP principle (see section 2.3.) the risk-tolerability levels were identified, see Figure 7.
Figure 7.
The Risk Matrix with scales for the consequence and probability.
The risk priority numbers for each risk-tolerability level are presented in Table 8. These levels were chosen after discussions regarding the severity of the combinations of consequences and probabilities. It was for example stated that a risk never can be acceptable if it has a major impact on the population as well as that an insignificant impact always is acceptable independent on how often it is occurring. Table 8. Risk priority numbers in relation to risk-tolerability levels. Risk-tolerability level
Risk profile
Low (R ≤ 20)
Acceptable risk
Medium (20 200)
3.3. Multi-Criteria Decision Analysis By studying the obtained risk matrix, the most severe risks were identified. To minimise these risks, countermeasures were suggested. The impact of each countermeasure led to new probabilities and consequences for the hazards and thereby new risk priority numbers. When an additional treatment step was chosen as a countermeasure its’ expected removal and location in treatment train were found in the literature. These facts were used to introduce the treatment step in the calculations to get the expected final removal with it included. Thereby, new concentrations could be obtained in order to calculate the new consequences. An MCDA was performed to evaluate which countermeasure that was the most suitable. The calculation of the scores of the countermeasures in the MCDA was done in the software WebHIPRE (SAL, 2015). The criteria used in the MCDA were risk reduction and cost, see Figure 8. Risk reduction was ranked three times more important than the cost since the primary aim of the countermeasures is to decrease risks. The risk reductions were also ranked depending on how important it was considered to decrease the specific risk. The cost criteria were divided into the sub criteria of capital cost and maintenance cost, which were ranked as equally important. All the costs were converted into EUR and the maintenance cost was calculated as the cost per year during the first 15 years.
14
MCDA
Risk reduction
Cost
75 %
Risk 1
25 %
Risk 2 X%
Risk 3
Capital X%
Maintenance 50 %
50 %
Risk ... X%
X%
Figure 8. Structure of MCDA.
After obtaining the scores for the different countermeasures, a sensitivity analysis was done by using the software Web-HIPRE and it was possible to see how the ranking of the criteria affected the result. Figure 9 shows an example of a sensitivity diagram. In this example has criteria A been ranked to 75 per cent in relation to criteria B. This ranking is marked by the vertical line in the Figure. Ranking of criteria A vs criteria B 1 0,8 0,6 0,4 0,2 0
Countermeasure 1 Countermeasure 2 0
25 50 75 Percentage ranking of criteria A
100
Countermeasure 3
Figure 9. Sensitivity plot for ranking of criteria A in relation criteria B. Criteria A was ranked to 75 per cent in the MCDA. Ranking of criteria B = 100 – Ranking of criteria A.
A ranking of 75 per cent for criteria A means that criteria B has the ranking of 100 – 75 = 25 per cent. The lines in the diagram refers to the scores the countermeasures receive in the MCDA depending on the ranking of the criteria. It can be seen that if criteria A is ranked as 75 per cent does countermeasure 1 receive the highest score, which in this case is 0.6. It can also be seen that if criteria A and B would have been ranked equally (50 per cent each) all the countermeasures receive the same score in the MCDA which in this case is 0.4.
15
4. RESULTS In the results chapter, the concentrations of the analysed contaminants are presented and used to calculate the consequences. The motivations to the probabilities for the identified hazards are also given and used as input in the risk matrix together with the consequences. The most feasible countermeasures to reduce the most severe risks are evaluated in a MCDA. Sampling results In Table 9 and Figure 10 the results from the quantitative sampling May 25th 2015 are presented. The concentrations are decreasing, for the majority of the contaminants, from the plant intake downstream through the treatment plant, which was expected. Imidacloprid is an exception with a higher concentration in the outflow compared to the inflow, even though this concentration also is close to the detection level. The concentration for sulfamethoxazole and simazine is also increasing along the treatment train. Cinchonidine has a concentration below the detection limit, as well as the majority of the samples for paracetamol. It can be seen that all contaminant concentrations are below their corresponding reference value for long-term exposure except EE2. Table 9. Concentration of chemical contaminants through the WWTP and WRP. ICEC EE2 Atrazine Bisphenol A Carbamazepine Cinchonidine Imidacloprid Lamivudine Paracetamol Simazine Sulfamethoxazole Terbuthylazine Triclosan
Reference value (long-term exposure [μg/L]) 0.001505 350 1 750 98 56 2 100 70 1 750 18 350 77 53
Intake [μg/L] 2.53 0.0003 0.5 0.402