Chattanooga Neighborhood Assessment 2011 Prepared for Community Impact of Chattanooga by Michael Schubert
Community Development Strategies Design by Maria Mariottini
Introduction Background In spring of 2011, Community Development Strategies was asked by Community Impact of Chattanooga to conduct an assessment of thirteen neighborhoods in Chattanooga, Tennessee. This assessment would be an integral part of a larger conversation currently being held in Chattanooga aimed at building a collaborative framework to guide the work of neighborhood revitalization into the future. As such, the assessment is to add value to that discussion by providing members of a working group with information about neighborhood conditions. The purpose of the assessment is to provide a sense of the direction in which the subject neighborhoods are moving; to identify key issues across all neighborhoods; and to make recommendations to the working group about further action. A similar assessment was conducted in 2003 of nineteen Chattanooga neighborhoods at the request of the City of Chattanooga Department of Neighborhood Services, Chattanooga Neighborhood Enterprise (CNE), Community Impact of Chattanooga, and the Lyndhurst Foundation. This assessment informed the decision of Community Impact to expand its revitalization work into three additional neighborhoods: Orchard Knob, Churchville, and Glenwood - from its original four.neighborhoods: ML King, Bushtown, Highland Park, and Southside. Many of the neighborhoods that were part of the assessment in 2003 are included in this assessment. While this new assessment is not meant to compare neighborhood conditions at two different points in time, the earlier assessment does provide a useful baseline against which to consider current neighborhood conditions.
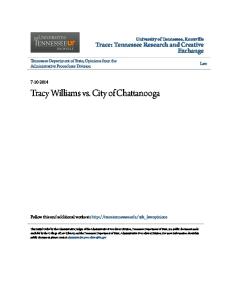
The Scope of the Project This assessment looks at these following neighborhoods: Alton Park Cedar Hill St. Elmo Clifton Hills East Lake Southside Gardens/South Broad Piney Woods Avondale East Chattanooga Eastdale Oak Grove Ridgedale Hill City These neighborhoods are illustrated on Map 1 and represent the core of Chattanooga’s inner city neighborhoods located between “the Ridge and the River”.
Chattanooga Neighborhood Assessment 2011
�
Map 1. Neighboorhoods of Chattanooga
7 6
0
12
3
2 5
13
10
8
1 4 11
�
Chattanooga Neighborhood Assessment 2011
9
1
St Elmo
2
Southside Gardens
3
Ridgedale
4
Piney Woods
5
Oak Grove
6
Hill City
7
East Chattanooga
8
East Lake
9
Eastdale
10
Clifton Hills
11
Cedar Hill
12
Avondale
13
Alton Park
This assessment draws from two sources of information: 1. An analysis of data collected for the subject neighborhoods by the Ochs Center for Metropolitan Studies in Chattanooga, Tennessee. 2. A set of field interviews with neighborhood leaders and stakeholders supplied by the Ochs Center and the City of Chattanooga. The choices made by homeowners, investors, potential home buyers, and other stakeholders are critical to understanding neighborhoods. This assessment is a way of putting those choices in a context so that they can be better understood. Are these neighborhoods attracing investment? Are buyers making choices to move in and be part of the neighborhood? Are grass roots improvement efforts getting stronger? These are the kinds of questions this assessment seeks to answer.
Assessing Neighborhood Change This assessment makes certain assumptions about what is valuable in measuring neighborhood change. There are many ways change can be measured, but in this case accessible data and a sample of interviews were used. As was the case in 2003, data for the assessment was provided by the Ochs Center (then referred to as the Southeast Tennessee Information Service or SETNIS), and this data was supplemented by key person interviews of neighborhood leaders and others familiar with the neighborhoods. Of considerable importance in measuring neighborhood change is an analysis of the workings of the real estate market. In many ways the real estate market represents the capitalization of a neighborhood’s assets and weaknesses – reflecting how it is perceived both by those inside and outside the neighborhood, as well as how various investment behaviors play out. When we look at the real estate market we look at the number of properties selling, how much they sell for, how close the sales price is to the listing price, how long it takes to sell a property – all functions of demand. We also look at the distribution of owner occupied residential parcels against the number and percentage of investor owned residential parcels. Since most of the neighborhoods studied were primarily owner-occupied neighborhoods of smaller residential buildings, increasing numbers of investor owned properties are viewed often by neighbors as a signal of decline. A second important consideration is the amount of social capital and collective efficacy that exists in the neighborhood. These help determine how neighborhoods solve or adjust to negative issues or conditions. Recognizing that neighborhoods are never problem-free, successful neighborhoods are those that can address whatever issues confront them. Social capital recognizes the value of networks and relationships in increasing productivity for individuals and groups. A neighborhood association that has built positive
Chattanooga Neighborhood Assessment 2011
�
relationships with city officials will likely get better responses from local government than a group that has not cultivated those relationships. Social capital is a key component in collective efficacy – a group’s confident expectation that they will achieve their intended goal. In order to gauge the level of social capital present in these neighborhoods two specific components were selected for analysis. The first was voting behaviors, particularly the number of votes cast as a percentage of the number of voters registered. The assumption here was that neighborhoods with higher levels of social capital would have higher voter turnout rates. The second factor considered was calls to the City’s 311 non-emergency number. The City of Chattanooga instituted a 311 calling system for citizens to report various non-emergency issues – things like poorly maintained properties, garbage accumulation, and other city service complaints. The assumption is that the stronger the level of social capital present in a neighborhood, the more likely it is that neighbors would take action by calling 311. Interviews were also conducted with neighborhood leaders to determine how neighborhoods were working as places. Crime levels were assessed in the subject neighborhoods using actual crime incident data collected by the Ochs Center. An additional consideration was an analysis of the subject neighborhoods as a tax base. This is important because despite the age of housing stock and the presence of perceived negative conditions, the neighborhoods represent a significant amount of taxable real estate. We wanted to quantify that value and look at how the tax base is performing, i.e. determining how much of the assessed value is coming in as tax payments. In summary, this assessment looked most closely at four key indicators of neighborhood direction: the performance of the real estate market, the level of social capital exhibited by the neighborhoods in voting and 311 calls, the level of crime, and the level of delinquent assessed value. In order to give the data some context, findings in local neighborhoods were compared to the city of Chattanooga as a whole.
Classifying the Subject Neighborhoods The 2003 assessment presented a neighborhood typology – a way for classifying multiple neighborhoods that have similar characteristics – and the neighborhoods were placed within that classification system. Classification systems have been used in a number of cities to identify neighborhoods with similar characteristics and to match certain policy interventions to those different conditions. In Chattanooga the classification system initially helped provide a way of describing the direction of the Community Impact neighborhoods.
�
Chattanooga Neighborhood Assessment 2011
The classifications, also used in this assessment are described in Charts 1a-d. Each classification has a general description of neighborhood conditions and then more detailed descriptions in four areas: neighborhood image, the local real estate market, physical conditions, and neighborhood management – the capacity of neighbors to address issues.
Chart 1a. Solidly Improving Description
Image
In solidly improving neighborhoods the equilibrium has shifted toward improvement. This neighborhood projects a positive image. It is clearly a neighborhood of choice for financially stable homebuyers and enjoys a civic culture that is effective in protecting the neighborhood against any perceived threats. Because of its market strength and a shared sense that positive changes are predictable, the solidly improving neighborhood attracts both commercial and institutional investment. • Viewed as a solid neighborhood by both residents and outsiders. • Physical signs of neighborhood identity. • High level of positive association by neighbors with the neighborhood.
Market
• Solid and predictable appreciation of sales prices or at least the absence of dramatic decline. • Investor/developer activity aimed at addressing market segments with substantial choice in the marketplace. • Realtors actively promote the neighborhood.
Physical
• Strong standards of maintenance and improvement.
Conditions
• High standards of maintenance and improvement in commercial properties and in public infrastructure. • Strong exterior maintenance standards – trimmed hedges, flowers, cut lawns • Pride of place strongly evident.
Neighborhood
• Strong patterns of neighborhood management and problem solving are evident.
Management
• High levels of neighboring. • Neighborhood association with broad membership.
Chart 1b. Stable/Improving Description
Image
The stable, improving neighborhood looks like a stable, well managed place. When owner occupied homes are placed up for sale, they are generally purchased by another homeowner who maintains or improves the property. The neighborhood, while it may experiences problems, has sufficient capacity to address those problems • Viewed by outsiders as a generally stable neighborhood. • Growing signs of neighborhood identity.
Market
• Appreciation on a par with the city as a whole. • Investor properties are generally well maintained. Investors improve properties, seeing a potential for appreciation and the possibility of reaching a more stable renter market. • Owner occupied for sale properties generally sell to new owner occupants at similar or slightly higher income levels and are financed conventionally. • Certain realtors are familiar with and effectively market the neighborhood. Properties are typically advertised for homeowners.
Physical
• Houses and other properties are generally well maintained to a commonly accepted standard.
Conditions
• Exterior maintenance standards on yards, driveways, and landscaping are generally high throughout the neighborhood. • Public infrastructure is generally well cared for and public investment is evident.
Neighborhood
• Generally strong and growing associational life either in neighborhood associations or in informal networks.
Management
• Solid patterns of neighboring expressed in formal or informal ways. • The neighborhood has an increasing strong coping mechanism. When neighbors act collectively, there is generally a positive resolution..
Chattanooga Neighborhood Assessment 2011
�
This classification model recognizes that neighborhoods are always changing. Neighborhoods are either continuously improving, are stable and either getting better or are showing signs of decline, or are clearly declining. This model assumes an equilibrium point from which neighborhoods either shift in a positive direction or fall into decline. The middle categories assume a level of stability that, depending on circumstances, can either move the neighborhood in a positive or negative direction. Chart 1c. Stable/Declining Description
Image
The stable but declining neighborhood is experiencing a decline in homeownership, a weakening of maintenance standards, less active neighborhood groups and associations, and an image that is weakening. The neighborhood is having difficulty attracting home buyers who qualify for conventional financing. Associational ties are weakening and the neighborhood is less resilient in responding to threats. While the neighborhood may look fairly stable, the equilibrium has begun to shift in a downward fashion. • The neighborhood is perceived as a declining place. • Neighborhood conditions begin to reinforce a negative image.
Market
• Homeownership base is beginning to slip. Sales prices appreciate at a lower rate than for the city as a whole. • Homes for sale are more likely to be purchased by investors than homeowners and converted to rentals. Note period after rentals Investors are usually less than professional in property management and tenant screening. • Realtors begin to market properties toward investor purchase. • Vacant properties begin to appear.
Physical Conditions
• Physical conditions on residential properties, while generally decent, begin to show decline as owners begin to defer investment or make shoddier improvements. • Exterior conditions of yards and driveways begin to show signs of slipping. • Reduced expenditures on capital improvements.
Neighborhood
• Neighborhood association is not growing in membership.
Management
• Uncivil behaviors, while rare in the past, grow in frequency and increasingly remain unchecked. • Coping mechanism of the neighborhood is weaker.
Chart 1d. Declining Description
Image
In the declining neighborhood the equilibrium has clearly shifted in a downward direction. The neighborhood leadership is unable to effectively address issues that threaten neighborhood confidence. Uncivil behaviors predominate and physical conditions reinforce an image of decline. • The neighborhood is perceived as a problem place by outsiders. • The image of the neighborhood projects is one of chaos, disorder, and decline.
Market
• Growing conversion of owner occupied property to poorly managed rental by less than professional investors. • Very little home purchase activity by new homeowners. Home purchases, when they do occur, are heavily subsidized and draw marginal homebuyers with few other choices. • Property is marketed as investor grade. • High number of vacant and abandoned properties. Higher rates of tax delinquency and foreclosure.
Physical
• Significant decline in physical conditions. Clear decline in basic home repair and maintenance standards.
Conditions
• Exterior conditions of properties – yards, porches, landscaping, driveways – are in clear decline. • Weak public infrastructure
Neighborhood
• Neighborhood association dominated by a hard core of long time active residents with no growth. Weak levels of social capital.
Management
• Little enforcement of civil behavior norms. Criminal activity is commonplace and remains unchecked. • Very little positive neighboring occurring. People with civil behaviors begin to withdraw from neighborhood life.
�
Chattanooga Neighborhood Assessment 2011
Assessing The Subject Neighborhoods Housing Market Conditions Any discussion of the local real estate market has to take into account the substantial changes in market conditions throughout the nation over the last several years. There was a substantial decline in house prices in 2009 and a rising tide of foreclosures. While Chattanooga did not experience the same high level of foreclosures as some other cities and only a slight loss in property values in 2009, many of the subject neighborhoods lost substantial amounts of housing value.
Chart 2. Rates of Property Value Gain/Loss Neighborhood
% Gain/Loss
Neighborhood
% Gain/Loss
Southside Gardens
226%
Avondale
(48%)
Hill City
24%
East Lake
(49%)
St. Elmo
6%
Eastdale
(54%)
City of Chattanooga
(.4%)
Piney Woods
(61%)
Cedar Hill
(12%)
Clifton Hills
(62%)
Ridgedale
(37%)
Oak Grove
(63%)
East Chattanooga
(44%)
Alton Park
(76%)
Map 2. Rates of Property Value Gain/Loss
Property values as reflected by sales prices have dramatically declined in most of the subject neighborhoods over the study period.
6
Analysis of the process of appreciation and depreciation for the city of Chattanooga shows steady growth through 2008 with an approximate 18% decline in 2009 and modest appreciation in 2010
0
12
3 2 5
The rates of property value gain and loss, ranked from highest to lowest, for the period 2004-2010 are illustrated on Chart As the chart indicates there has been a substantial decline of more than thirty percent in sales prices in nine of the thirteen neighborhoods, compared to a decline of less than 1% for Chattanooga as a whole.
9
Key Gain Loss 0-20% Loss 21-40% Loss 41-60% Loss 61-80 %
Ten of the subject neighborhoods lost housing value over the period 2004 to 2010, ranging from a loss of 12% in Cedar Hill to a loss of 76% in Alton Park. The rate of value loss for Chattanooga over the same period was only 0.4%. Three neighborhoods actually gained value over this period: St. Elmo, Southside Gardens/Broad Street, with a minimal number of housing units, and Hill City. This finding is based on average sale prices for residential properties from the Multiple Listing Service(MLS).
2 and Map 2.
7
13
10 8
1 4 11
1
St Elmo
2
Southside Gardens
3
Ridgedale
4
Piney Woods
5
Oak Grove
6
Hill City
7
East Chattanooga
8
East Lake
9
Eastdale
10 Clifton Hills 11 Cedar Hill 12 Avondale 13 Alton Park
Chattanooga Neighborhood Assessment 2011
�
of 4.6%. Most of the subject neighborhoods followed a different path. Many began a decline earlier and almost all failed to move forward in 2010. What does it mean when sales prices decline by 30% in a neighborhood? As the 2003 study pointed out many of the neighborhoods studied were becoming increasingly investor owned. If an investor bought a house for $43,000 in 2004 and it is worth only 25,000 in 2010, there is little incentive to maintain and/or improve the house or even to maintain real estate tax payments – a factor that will be discussed later in this report. The strategies that make the most economic sense defer costs in order to maximize short term revenue - since the value of the asset has greatly declined, or to take a loss and sell it to another investor. In much the same way declining sales prices provide a disincentive for potential new homebuyers and existing owners. New homebuyers may be reluctant to buy into a neighborhood with declining sales prices, recognizing they might lose whatever equity they bring. Homeowners recognize that they may not be able to recapture the value of any improvements – so they withhold those improvements. In a neighborhood with a generalized withholding of improvements, it is hard for one homeowner to go counter to what they see happening around them. Homeownership rates in the neighborhoods continue to decline. Higher rates of homeownership are generally seen as a marker for neighborhood stability. This is particularly true for cities that have a large percentage of small homes and that have had historically high homeownership rates. Based on the data provided by the Ochs Center, the homeownership rate in Chattanooga has substantially grown since 2002 – going from a rate of 55.0% to a high rate of 72.4% in 2004 and experiencing a decline in 2010 to 69.0%. Even with this decline the homeownership rate in Chattanooga remains higher than the national rate in 2010 of 67.2% This positive trend is not present in the neighborhoods studied. Given there was a general loss in homeownership in 2009, in order to define normal we look at the rate of change from 2004 to 2010 for the city of Chattanooga as a way of developing a standard. The homeownership rate is calculated by dividing the number of homeowner parcels by the number of all residential parcels. Chattanooga’s homeownership rate declined by 3.4% over the period 2004 -2010, so neighborhoods experiencing a loss of homeownership less than 3.4% are viewed as performing well. Neighborhoods with losses higher than 3.4% are viewed as performing poorly. lays out a ranking by change in homeownership rates over the period 20042010. We look where possible at changes reported in the 2003 assessment as a baseline and rank neighborhoods according to the rate of change from 2004 – 2010. Chart 3
As the chart indicates, in 1997 eleven of the thirteen neighborhoods had homeownership rates higher than 50%. By 2004 that number had dropped to six, and by 2010 only three of the neighborhoods had homeownership rates in excess of 50%.
10
Chattanooga Neighborhood Assessment 2011
This dramatic shift was first pointed out in the 2003 study. While gradual, it has been steady and has serious implications for the future.. There is a legitimate question of whether homeownership can be restored in some of these neighborhoods. If these neighborhoods are going to be primarily rental neighborhoods, how can they be successful rental neighborhoods? Are there parts within these neighborhoods that are still generally homeownership that can be built upon and expanded? Are there quality landlords operating in these markets that are interested in longer term appreciation and can these landlords be organized to work in concert with other neighbors? These are important questions that need to be discussed by policy makers in Chattanooga.
Chart 3. Homeownership Loss Neighborhood
1997
2002
% loss
2004
2010
% Loss
Southside Gardens
37.3%
31.2%
6.1%
30.0%
36.2%
+6.2%
St. Elmo
n/a
n/a
n/a
67.1%
66.8%
.3%
Alton Park
52.5%
51.2%
1.3%
47.1%
44.5%
2.6%
Chattanooga
n/a
55.0%
n/a
72.4%
69.0%
3.4%
Clifton Hills
53.3%
51.3%
2.0%
47.9%
44.0%
3.9%
Hill City
62.3%
58.2%
4.1%
51.7%
46.9%
4.3%
Oak Grove
44.4%
37.3%
7.1%
37.5%
32.1%
5.4%
Ridgedale
52.9%
50.7%
2.2%
42.4%
37.6%
5.3%
Cedar Hill
54.7%
49.3%
5.4%
45.9%
40.0%
5.9%
Eastdale
84.1%
83.1%
1.0%
80.7%
73.9%
6.8%
Piney Woods
69.5%
63.2%
6.3%
61.6%
54.6%
7.0%
East Lake
56.8%
53.8%
3.0%
51.1%
42.6%
8.5%
East Chattanooga
59.4%
57.6%
1.8%
56.0%
47.1%
8.9%
Avondale
52.7%
50.5%
2.2%
52.2%
40.4%
11.8%
Map 3. Homeownership Loss 2004-2010
illustrates homeownership loss over the time period of the first assessment (1997-2002) and compares that to homeownership loss over the time period of this assessment (2004 -2010). The chart also ranks neighborhoods by homeownership loss over the latter assessment period. Chart 3
6
Key Gain Loss less then 1% Loss 2-5% Loss 6-9% Loss 10-12%
This Data is illustrated on Map 3. Foreclosure, while not as significant a problem in Chattanooga as in some cities, has negatively impacted the subject neighborhoods. Foreclosures have greatly accelerated in the last four years..
9
12
0
3 2 5
While Chattanooga has not been as negatively impacted by high foreclosure rates as some other cities, there has been a significant rise in foreclosures over the last few years, a trend consistent with the national crisis of foreclosure. The foreclosure data gathered by the Ochs Center is drawn from the Hamilton County Registrar of Deeds and represents actual foreclosures. In order to make this data meaningful and allow comparison between neighborhoods and
7
1 St Elmo 2 Southside Gardens 3 Ridgedale
13
4 Piney Woods
10 8
5 Oak Grove 6 Hill City 7 East Chattanooga
1
8 East Lake
4 11
9 Eastdale 10 Clifton Hills 11 Cedar Hill 12 Avondale 13 Alton Park Chattanooga Neighborhood Assessment 2011
11
Chart 4. Neighborhood Foreclosure Rate Neighborhood
Foreclosure Rate
Neighborhood
Foreclosure Rate
St. Elmo
0.9%
Alton Park
1.8%
Hill City
1.1%
East Chattanooga
1.9%
City of Chattanooga
1.1%
Cedar Hil
2.2%
Piney Woods
1.3%
Oak Grove
2.2%
East Lake
1.4%
Southside Gardens
2.3%
Clifton Hills
1.5%
Ridgedale
2.3%
Eastdale
1.6%
Avondale
2.3%
with the city of Chattanooga, the data is reported out by number of foreclosures per 100 residential parcels. So for example, if the foreclosure rate was 2.2 in Oak Gove it means that for every 100 residential parcels there were a little more than two homes foreclosed. This number provides a standard unit for comparative purposes. ranks the average annual foreclosure rates for the subject neighborhoods and for the city of Chattanooga. As the chart shows, almost all of the subject neighborhoods are experiencing higher foreclosure rates than that for the city as a whole, with five neighborhoods (Cedar Hills, Oak Grove, Southside Gardens, Ridgedale, and Avondale) experiencing rates double or more than that of the city. Chart 4
Map 4. Average Foreclosure Rate 2004 -2010
6
7
9
0
Key
12
Less then 1.0% 1.0%-1.4% 1.5%-1.9% 2.0%-2.5%
Much of this foreclosure activity has occurred in the last few years. If we compare foreclosures over the entire study period (2004-2010) to the period 2007-2010, we find dramatic increases in those recent years.
3 5
1 2 3
13
4
10 8
5 Oak Grove
8
4 11
Foreclosures in the subject neighborhoods represent 29.7% of all foreclosures East Chattanooga in Chattanooga over the period 2004East Lake 2010 and 28.6% over the period 20072010. This means that over 70 percent of Eastdale foreclosures in Chattanooga are happenClifton Hills ing outside the subject neighborhoods. Cedar Hill Within the neighborhoods, however, the Avondale foreclosure rate has dramatically accelerAlton Park ated in the last four years of the assessment period.
6 Hill City 7
1
illustrates the total number of foreclosures over the period 2004-2010 St Elmo for each neighborhood and the number Southside Gardens of foreclosures over the last four years, Ridgedale both for the neighborhoods and for the Piney Woods city of Chattanooga as a whole. Chart 5
2
9 10 11 12 13
There are two questions this foreclosure data doesn’t answer. The first is about who is being foreclosed on – investors or owner occupants. In neighborhoods with such high rates of absentee ownership,
12
Chattanooga Neighborhood Assessment 2011
it can be suggested that foreclosures are taking place among investors. Given the declining property values and significant amounts of tax delinquency, it is possible that investors are abandoning properties. A closer look at a sample of foreclosures could shed some light on this question. A second important question is what happens to properties after they are foreclosed upon. One person interviewed in Oak Grove indicated vacant properties were being occupied by squatters and used by prostitutes – a problematic outcome for the neighborhood. Understanding more about the disposition of foreclosed properties and how this process can be less of a negative for the neighborhoods is important to maintaining some level of stability in these neighborhoods.
Chart 5. Neighborhood Foreclosure Rate 2007-2010 Neighborhood
Total number of Fore-
Foreclosure 2007-
closure 2004-2010
2010
St. Elmo
69
47
68.1%
Southside Gardens
9
9
100.0%
Ridgedale
105
69
65.7%
Piney Woods
29
20
68.9%
Hill City
34
24
70.5%
Alton Park
75
48
64.0%
Avondale
209
142
67.9%
Cedar Hil
60
36
60.0%
Clifton Hills
34
17
50.0%
Eastdale
61
41
67.6%
East Lake
225
141
62.6%
Oak Grove
60
31
51.6%
East Chattanooga
159
95
59.7%
Totals
1129
720
59.7%
City of Chattanooga
3789
2510
66.2%
Map 5. Number of foreclosures 2007 – 2010
Property tax delinquency rates are extremely high in the subject neighborhoods. The average property tax delinquency in the subject neighborhoods in 2010 was 20.6% versus 7.7% for the city as a whole. All neighborhoods have a rate of delinquency higher than 7.7%
6
7
9
Key Less then 20 21-50 51-80 81-110 111-150
One key indicator of neighborhood health is the rate of payment on property taxes. If neighborhoods are healthy, owners – both owner occupants and investors - generally pay their property taxes because they value their property as an asset. If neighborhoods are perceived as being in decline, owners are more often likely to make the choice to withhold payment of property taxes. Data on property tax delinquency was gathered by the Ochs Center using data from the Hamilton County Assessor’s Office. The delinquency rate for 2010 was calculated based on the assessed value of delinquent residential parcels divided by the total assessed value of all the residential parcels in the neighborhood, according to data provided by the Ochs Center.
Percentage of Total
12
0
3 2 5
1 St Elmo 2 Southside Gardens 3 Ridgedale
13
4 Piney Woods
10 8
5 Oak Grove 6 Hill City 7 East Chattanooga
1
8 East Lake
4 11
9 Eastdale 10 Clifton Hills 11 Cedar Hill 12 Avondale 13 Alton Park Chattanooga Neighborhood Assessment 2011
13
Chart 6. Tax Delinquency and homeownership rates 2010 Neighborhood
Assessed Value Delinquent
Homeownership Rate
Alton Park
22.6%
44.6%
Avondale
25.8%
40.4%
Cedar Hills
20.8%
40.0%
Clifton Hills
18.4%
44.0%
East Chattanooga
20.6%
47.1%
East Lake
11.7%
42.6%
Hill City
16.4%
46.9%
Oak Grove
28.2%
32.1%
Piney Woods
24.9%
54.6%
Ridgedale
20.3%
37.6%
Southside Gardens
32.1%
36.2%
St. Elmo
10.7%
66.8%
In analyzing this table it is worth noting that those neighborhoods that have a homeownership rate of less than 45% have an average tax delinquency rate of 22.5% - almost three times that for the city as a whole.
Average
20.6%
N/A
Map 6
Chattanooga
7.7%
N/A
The average delinquency rate for all the subject neighborhoods is 20.6% - almost three times that of the rate for the city as a whole.
Map 6. Neighborhoods with Rate of Tax Delinquency above 20% and Home Ownership Rate below 45%
6
7
0
12
3 2 5
1 2 3
13
4
10 8
1
5 6 7
9
11
9 Eastdale 10 Clifton Hills 11 Cedar Hill 12 Avondale 13 Alton Park
Chattanooga Neighborhood Assessment 2011
illustrates those neighborhoods with a real estate tax delinquency rate greater than 20% and a homeownership rate of less than 45%. There are a number of questions this data does not answer. First it is unclear the extent of the delinquency – is it one year or more than one year? We also do not know which specific properties are tax delinquent. Are these owner-occupied properties with elderly or low-income owners, or are they investor owned properties? We also do not know the monetary value of the tax delinquency, that is, how much actual tax is owed.
Answering these questions is an important next step. A sample of tax delinquent properties in several of the neighborhoods with higher rates could tell us more about the nature of this tax delinquency, i.e. if this is a homeowner St Elmo problem or an investor problem. The fact Southside Gardens that high delinquency rates are found in Ridgedale neighborhoods with less than 50% homPiney Woods eownership suggests that investor owners Oak Grove might be withholding tax payments – a Hill City clear signal of a downward trend for the East Chattanooga neighborhood.
8 East Lake
4
14
The data on tax delinquency by neighborhood is summarized in Chart 6. This chart also provides the 2010 homeownership rate for each neighborhood as a means of comparison.
A second consideration is the amount of revenue lost to the city and other taxing bodies by this delinquency and the need for investment in these neighborhoods. If the delinquency rate in these neighbor-
hoods was reduced by a certain percentage, e.g. 30% - what kind of revenue stream could be created and how could that revenue stream be reinvested into the neighborhoods? Many of these neighborhoods need infrastructure improvements – sidewalks, street repairs, demolition of certain properties, lighting – items that could be addressed through general obligation bonds that could be paid for with additional tax revenue.
Chart 7. Permits Neighborhood
Permits per 100 Residential Parcels 2004-2011
Southside Gardens
6.6
Alton Park
5.6
Hill City
4.8
Oak Grove
4.7
Building permit activity is an indicator of neighborhood investment. It usually does not capture all repair and improvement activity and, as a result, it can have limitations as an indicator.
Ridgedale
4.6
St. Elmo
3.7
Cedar Hills
3.7
The information on building permits collected by the Ochs Center reflects the following categories of activity: new construction, alteration, repair, and demolition. In order to make the data more meaningful, an index of number of permits per 100 residential parcels was created and neighborhoods were ranked by this variable on Chart 7.
Piney Woods
3.5
Avondale
3.0
City of Chattanooga
2.9
East Lake
2.8
Clifton Hills
2.2
East Chattanooga
1.8
Eastdale
1.5
In eight of the subject neighborhoods building permit activity has been happening at a greater rate than for the city of Chattanooga.
Despite what may seem to be a positive trend, it is difficult to observe much repair or alteration in many of the neighborhoods. Alton Park has seen some new construction during this period. Southside Gardens has few residential structures, and both Ridgedale and St. Elmo have seen some renovations during this time period. But it is difficult to see much rehab activity in Oak Grove, Avondale, or Cedar Hill. A substantial number of properties are for sale at very low prices and sales prices continue to be low. According to research conducted on Zillow.com there are currently an estimated 761 properties for sale in the subject neighborhoods and sales of approximately 645 in the last year. A substantial amount of these for sale and sold properties are priced below $30,000. In reviewing for sale properties in several zip codes where the subject neighborhoods are located, there were 226 properties listed for $20,000 and under and sales recorded for under $20,000 for another 265 properties. In terms of sales activity, a sample was taken of two areas – one which included East Lake, Cedar Hills, and Clifton Hills- and the other that included Avondale and East Chattanooga. Sales over the last year were reviewed and are summarized in Chart 8. As the table shows more than half the sales were for under $30,000 in these neighborhoods. How does this sales activity compare with previous years? Are there more sales than in the past or less? In 2004 there were 352 sales recorded in the thirteen subject neighborhoods, according to the Multiple Listing Service Data provided by the Ochs Center. In 2009 that sales volume decreased by 38% to 217. Sales volume for all of Chattanooga declined by 28%. So it appears that sales volume is beginning to increase.
Chart 8. Sales Transactions in Two Neighborhoods June 2010-June 2011 East Lake, Clifton Hills, Cedar hills
Avondale, East Chattanooga
Number of transactions
30
28
Average Sales Price
$31,700
$26,300
Less than $15,000
7
5
$15,000 - $30,000
10
10
$31,000 - $50,000
10
9
$51,000 - $70,000
2
3
$71,000 - $80,000
1
1
Highest Sales Price
$72,000
$80,000
Lowest Sales Price
$10,000
$10,000
Chattanooga Neighborhood Assessment 2011
15
What are the implications of this? There is no specific data that answers the question of whether homeowners or investors are buying these properties. Based on the experience of other cities it is most likely these are investor purchases, with investors buying for conversion to rental. A look at the listing notices of many of these properties makes it clear they are being marketed as rental investment stock. This was a trend identified in the 2003 study and it appears to be continuing. Every sales transaction represents potential change, and the changes recent transactions seem to represent are likely to continue to erode neighborhood confidence. At one level it is possible to conclude that most of the subject neighborhoods suffer from weak demand, particularly homebuyer demand. Declining sales prices, lots of homes on the market, loss of owner-occupancy – all signal a weakening of demand. On the other hand, houses are being purchased, most likely by investors in the neighborhoods, representing some level of demand. The issue is not only demand but the right kind of demand. It is unrealistic to think that these neighborhoods can all be re-populated with homeowners. But it is not unrealistic to think that greater homebuyer demand could be generated and targeted to stronger sub-neighborhoods within these areas. Nor is it unrealistic to believe that among the investor class there may be investors that see long term benefit in reinvesting in properties versus short term cash flow considerations – investors who could actually be assets for the neighborhood. In summary, it appears that most of the market trends observed in the earlier 2003 study have continued with, of course, the added negative of foreclosure. In general, the neighborhoods have lost homeownership, lost market value, seen higher rates of foreclosure than that for the city, and continue to see their housing stock converted to lower grade rental. Any serious conversation about the future of neighborhood intervention has to address these market realities.
Social Conditions While analyzing the workings of the real estate market is an important consideration, it is not the only consideration. Successful neighborhoods are those that are resilient and have enough social capital to weather changes in the market. This social capital keeps the equilibrium from shifting towards the direction of decline. So how can we assess the level of social capital and various social conditions in the neighborhoods? We start by making some assumptions about how neighborhoods behave when they are healthy.
16
Chattanooga Neighborhood Assessment 2011
When neighborhoods are healthy we are likely to see these things: • Residents who take action around problem solving. In troubled neighborhoods there is often a belief that taking action will yield little in the way of results. Problems are ignored and then tolerated. In more successful neighborhoods people believe their actions will have some impact. • Residents who vote.Voting patterns have been used by social scientists as an indicator of neighborhood social capital. In successful neighborhoods people are engaged enough that they will take the time to vote. • Higher levels of civic participation. In successful neighborhoods there are both formal organizations and informal networks that provide people with relationships and provide vehicles for all kinds of what might be called neighboring activities. • Crime will be decreasing. This is fairly obvious and in many ways is the result of the presence of the above three qualities. In the previous section of this report, confidence in the neighborhood as expressed by actions in the market was discussed. But neighborhood confidence is more than market confidence, although in many ways it is an investment decision. People are more likely to invest their time and energy when they think it will have a positive impact on them and on their situation. People will invest the time and energy in calling 311, or going to vote, or baking a cake for the neighborhood association bake sale if they believe there will be a positive outcome. The data from the Ochs Center as well as interviews conducted with neighborhood leaders provides a picture, albeit limited, of how these neighborhoods work as social places. 311 Calls If people want the City to address a specific neighborhood maintenance problem they call 311. Many cities have adopted the 311 system to better address citizen complaints and to reduce the dependence on Chart 9. Calls to 311 2006-2010 the 911 emergency numbers. The 311 call information was gathered from the City of Chattanooga by the Ochs Center. It includes complaints on abandoned and inoperable vehicles, housing complaints, illegal dumping, litter, overgrowth on vacant and occupied buildings and vacant lots. Chart 9 summarizes
this information. It reports the total of all complaints by neighborhood for the period of 20062010. 2006 was used as the starting point because that was the first year data for all neighborhoods was available.The chart also provides an average number of complaints for each neighborhood. In order to compare the activities within the
Neighborhood
Total 311 Calls
Average per Year
Calls per 100 Residents 2010
East Chattanooga
2972
594
12.1
Oak Grove
1307
261
11.6
Eastdale
375
75
11.2
Hill City
688
137
10.2
Avondale
2961
592
9.5
Ridgedale
1473
295
9.1
Piney Woods
378
76
8.1
Alton Park
1473
294
7.6
Cedar Hills
881
176
6.7
Clifton Hills
662
132
5.9
East Lake
2948
589
5.0
South Side Gardens
142
28
4.8
St. Elmo
835
167
3.6
Total
17,095
City of Chattanooga
40,582
8116
4.2
Chattanooga Neighborhood Assessment 2011
17
neighborhoods, an index of 311 calls per 100 residents for the year 2010 was created for each neighborhood and for the city as a whole. A few comments on this table: • There have been a lot of complaints to the 311 number from the subject neighborhoods. Approximately 42% of the calls in Chattanooga have come from these neighborhoods. • The fact that many of these calls are coming from neighborhoods with significant other issues seems to indicate there is a core of active neighbors who are calling out issues of neighborhood maintenance. • The number of 311 calls in some of the neighborhoods with the heaviest calling rates has been decreasing over the last several years. These neighborhoods include Avondale, East Lake, Ridgedale, Eastdale, and Cedar Hills. These high rates of complaints are troubling because clearly there have been and remain many issues of concern in these neighborhoods around basic neighborhood maintenance and code enforcement. What is not reported here is the extent to which complaints are resolved. Voting Patterns The following Chart 10 looks at voting behaviors in the subject neighborhoods compared with the city of Chattanooga in the 2008 and 2010 elections. From the data provided by the Ochs Center, voter participation was calculated by the amount of actual voters divided by the number of registered voters. Chart 10. Voting Patterns
18
Neighborhood/ Location
2008 Voter Turnout
2010 Voter Turnout
Alton Park
55.9%
26.5%
Avondale
54.7%
37.2%
Cedar Hill
42.7%
23.1%
Clifton Hills
44.7%
22.5%
East Chattanooga
57.1%
29.2%
Eastdale
66.7%
46.2%
East Lake
41.8%
21.0%
Hill City
49.8%
27.2%
Oak Grove
47.2%
22.0%
Piney Woods
54.6%
32.7%
Ridgedale
51.1%
30.8%
South Side Gardens
39.1%
19.7%
St. Elmo
57.0%
32.7%
City of Chattanooga
60.1%
38.1%
State of Tennessee
57.0%
34.4%
United States
61.6%
41.6%
Chattanooga Neighborhood Assessment 2011
To put these numbers in context the voter turnout nationally in the 2008 election was 61.6%. In Tennessee the turnout was 57.0%. In 2010, turnout rates were lower across the board. In the nation the turnout rate was 41.6% and in Tennessee the rate was 34.4%. As the table indicates, only one neighborhood – Eastdale – exceeded turnout rates for Chattanooga, Tennessee, and the United States in both the 2008 and 2010 elections. Only six other neighborhoods had turnout rates that exceeded 50% in 2008. None exceeded 50% in 2010. Looking closer to home, an overview of recent mayoral elections also indicate low voter turnout in general and even lower turnout in these neighborhoods. In the 2009 mayoral election voter turnout was only 19%. A review of those voting districts that bore the names of the subject neighborhoods showed an average voter turnout rate of 8.4%. These seem like incredibly low turnout rates for an election that could have some bearing on the outcomes that concern many neighbors.
Crime. The data on crime provided by the Ochs Center focused on three things: drug-related incidents; property crime incidents; and incidences of violence.
Chart 11. Crime Neighborhood
Crimes per 100 Residents
St. Elmo
1.6
South Side Gardens
3.8
Hill City
4.2
Clifton Hills
4.3
Cedar Hills
4.7
An index was developed in order to put this crime data in some kind of context. The index reflects all crime in 2010 for each neighborhood per 100 residents. This is illustrated in Chart 11.
East Lake
5.3
Alton Park
5.7
East Chattanooga
6.4
Interviews with Neighborhood Leaders In order to get a better understanding of neighborhood life,iInterviews were conducted with neighborhood leaders in Alton Park, Avondale, Cedar Hills, Clifton Hills, East Chattanooga, East Lake, Hill City, Oak Grove, Ridgedale, South Side Gardens, and St. Elmo. From these interviews a set of observations emerged. These are summarized below:
Oak Grove
6.4
Ridgedale
6.9
Avondale
8.9
Piney Woods
6.9
Eastdale
20.2
Analysis of the data showed few examples of crime trends clearly moving up or down in a clear direction. In most neighborhoods it was difficult to discern a clear trend. The only exceptions were St. Elmo and Clifton Hills, where criminal activities of all sorts seem to be in decline and Alton Park, Cedar Hill, Eastdale, and East Chattanooga, where criminal activities seemed to be on an increase.
• There are some impressive neighborhood leaders emerging in Alton Park, Clifton Hills, East Lake, Hill City, and Saint Elmo. These organizations appear stronger than they did in the earlier study. These leaders have strong attachment to their neighborhoods, tend to be more prone to partnering with other neighborhoods, and have more perspective on how their neighborhood fits into the larger context of the city. • At the same time there continues to be a very narrow focus on crime, and to some extent city services, as the driving issue around which to bring people together. This was a similar finding in the earlier study. While crime is an issue for people, too much of a focus on “crime and grime” can define the neighborhood as a negative place and undermine neighborhood confidence. • A pattern of change as described by many of the residents is consistent with the activities in the market.” Older people die or move away, kids sell, investors buy, and lease to bad tenants” was how one crime watch leader described the change process, a description echoed by several others. However, other leaders, particularly in East Lake, Hill City, Clifton Hills, and St. Elmo saw younger Caucasian families and individuals as well as Hispanic families buying and making improvements. Those who described this trend saw this as a positive, although they were, in some cases, worried about the neighborhood losing diversity. • The key issues identified by these residents are not surprising: crime; disorder and a growing tolerance of disorder; bad landlords and bad tenants; poorly maintained or vacant buildings; weak participation of neighbors in the neighborhood association. • Several leaders talked about the need to integrate immigrants into the neighborhood and the neighborhood association. While many spoke of greater numbers of Hispanic families moving into the neighborhood, the settlement of Burundi refugees into Hill City was also noted.
Chattanooga Neighborhood Assessment 2011
19
• It was clear that in several neighborhoods there were interesting partnership opportunities that emerged – at least speculatively. Building a neighborhood revitalization approach around a group of individuals being worked with by a faith based initiative in East Chattanooga was one such speculative opportunity. Building a grass roots engagement strategy in Avondale focused around actual or potential redevelopment sites being considered by the 28th Legislative District CDC was another. Building around a positive investor in Ridgedale to reach more investors was a third. While these may not be traditional neighborhood revitalization interventions with a very targeted geography and approach, they might be ways to gain footholds in parts of neighborhoods and to create some impact. Much of the neighborhood association conversation seemed to be focused on crime and city service complaints, and less on how neighborhoods can use their assets to grow and develop. Perhaps because the City of Chattanooga provides staff support, small grants, and leadership training to these organizations there is a tendency to focus on those things the City does. In some ways, however, this can reinforce a dependency on municipal government that can impede the development of these organizations. The City of Chattanooga deserves a lot of credit for its effort to strengthen neighborhood identity and support local organizations. But such efforts can be easily undermined unless there is greater coordination with other entities to bring more resources to bear in these neighborhoods. In summary, with few exceptions, these neighborhoods are severely challenged. Changes in the real estate market, i.e. loss of owner occupancy over a period longer than the time frame of this study, has hurt the ability of these neighborhoods to be resilient in the face of current issues like foreclosure and disorder. The old model of neighborhood associations with a handful of homeowners and limited participation will need to be re-thought by those concerned about the future of these neighborhoods. New concerns, like how to build demand for homeownership, how to engage more neighbors in small projects that can demonstrate their pride, how to promote a positive neighborhood image, how to effectively communicate with neighbors – have to be in the forefront for leaders if these neighborhoods are going to survive.
20
Chattanooga Neighborhood Assessment 2011
Classifying Neighborhoods Community Impact of Chattanooga used a classification system to place the neighborhoods in which it worked on a continuum to monitor progress and change.
Chart 12. Classification chart Solidly Improving Neighborhoods
St. Elmo
Stable/ Improving Neighborhoods
South Side Gardens, Clifton Hills, Hill City, Alton Park
Stable/ Declining Neighborhoods
Ridgedale, Piney Woods, East Lake, Eastdale, East
The thirteen subject neighborhoods of Chattanooga, Cedar Hills this assessment were analyzed and placed on this continuum. It is a very subjective Oak Grove, Avondale Declining Neighborhoods assessment and is not based on any objective scoring system. The author takes full responsibility for the classification decisions. A brief discussion of each neighborhood follows Chart 12. St. Elmo is clearly at the top of the list. It has generally maintained value, kept its owner-occupancy base, has a fairly strong core of neighbors as well as a broader level of participation from rank and file neighbors. It has begun to partner with other adjacent neighborhood associations. Crime rates are low. Certain realtors specialize in marketing the neighborhood. South Side Gardens is difficult to categorize because it has so few residential units. It is categorized the way it is because there is a generalized expectation among local business and community leaders that the neighborhood will continue to develop. Alton Park, while it has many problematic indicators, has changed fairly dramatically in the last few years with the development of mixed-income housing. There are a number of organizations in Alton Park and, while there may be issues around how they work together, this can be an asset for the neighborhood. Clifton Hills has a decent neighborhood association, and some great neighborhood assets, including a produce farm within the neighborhood. Hill City is another neighborhood, given its location to strong growing commercial and residential area, which can be expected to improve. The stable declining neighborhoods are places where parts of the neighborhood may be intact, but other parts are clearly in decline. East Lake, Ridgedale, East Chattanooga, Piney Woods, Eastdale, and Cedar Hills all have many positives but unless these neighborhoods strengthen their housing markets and the social connections within them, they will be vulnerable to further decline. Oak Grove and Avondale are clearly in decline. Lost owner occupancy, diminished property value, higher crime and perceptions of crime, weak housing stock, diminished civic participation – all these factors are present here in these neighborhoods. This does not mean they are hopeless – even these neighborhoods have some strength within them that could be built upon.
Chattanooga Neighborhood Assessment 2011
21
Conclusions and Recommendations The 2010 assessed value of all residential properties in the thirteen neighborhoods studied here is approximately $131.4 million, and represents about 9% of all the residential assessed value in the city of Chattanooga. The assessed value of these neighborhoods has risen over the seven year period of this study by 38%, an increase higher than that of the city, where assessed values increased over the same period by 32%.Clearly these neighborhoods represent a significant investment At the end of the day when the numbers are collected and analyzed the fact remains that these neighborhoods, for the most part are in trouble. The same negative dynamics identified in the 2003 study are still in place, except that in 2003 the overall economy was stronger as was the local real estate market. Most of these neighborhoods continue to lose home owners, continue to attract low-quality investors, and have seen their actual property values erode. They have higher rates of crime and substantial infrastructure problems. Now these neighborhoods also are confronting the problem of foreclosure and the social capital of neighborhood leaders is getting depleted. But not in all places. In some of the neighborhoods there are some new energies emerging - new leaders, new families buying homes. The challenge is to expand and align the system of resources to support those efforts and grow others. The following recommendations are offered to address what needs to be done to strengthen these neighborhoods. It is important to recognize that there needs to be a citywide policy framework that drives neighborhood interventions. Simply picking a few neighborhoods and focusing even expanded resources in them is not enough. At the same time, interventions in the larger system need local strategies that can create neighborhood impact.
City-Wide Interventions The following are three important components in a citywide policy framework aimed at the revitalization of neighborhoods. Build demand and market neighborhoods. The overall direction of housing policy needs to be about more than increasing the supply of affordable housing. Housing policy needs to focus on building demand as well. Chattanooga has many great neighborhoods, including some of the ones addressed in this assessment, but no organized system to market them and get people excited about them. Entities that market neighborhoods exist in Cleveland, Baltimore, Milwaukee, and other cities, and such an effort should be developed in Chattanooga. Organize responsible investor owners. As neighborhoods shift from owner occupied to investor owned, it is important to identify and support those investors who are looking for long term appreciation and whose buildings add value to the neighborhood. Bad investors threaten the investment of these good investors. Here the self-interests of neighbors coalesce with those good investors.
22
Chattanooga Neighborhood Assessment 2011
There have been more private real estate developers involved in neighborhood development in Chattanooga in recent years. This might provide a base of people from which to work. Engaging more investors who have capacity with other neighborhood revitalization interventions could have a positive impact. Right now the bar is set pretty low for rental houses in neighborhoods regarding property management and maintenance. If neighborhoods are going to improve that bar needs to be raised. Address the regulatory framework that impacts neighborhoods. There are a whole range of issues around the disposition of vacant properties that are even more serious than they were in 2003. The City needs to examine the work that is being done in land banking in other cities as a vehicle for bringing more predictability to the disposition process. At the same time the issues around property tax delinquency need to be examined more closely to determine how that delinquency can be reduced. Reducing tax delinquency creates more revenue for the City, revenue which, at least in theory, could be reinvested in neighborhoods to finance infrastructure and to capitalize additional improvement efforts.
Neighborhood Interventions Rather than list a menu of possible programs I want to state a few basic principles to maximize neighborhood impact. Build a climate around neighborhood strategy. This means an orientation towards the neighborhood and what’s working and not working about that place. All too often interventions are driven by the programs that exist rather than by the conditions in the neighborhoods. This limits the ability to effectively address neighborhood change. If one starts with the neighborhood one is likely to find more opportunities for partnership and action. Plan to do and not plan to plan. Plans need to be done around how to use resources in a way that will build neighborhood confidence. Several of the neighborhoods have plans but they don’t seem to have an implementation component that guides local decision making. The plan itself is not the outcome. Neighborhood improvement needs to be the outcome. Build on strengths and do things people can see and understand. Even in the most troubled neighborhoods there are areas of strength that can be built upon, and small things can often inspire more confidence at the neighborhood level than large complex projects. Small projects helped Community Impact gain a foothold in neighborhoods and got neighbors involved.
Chattanooga Neighborhood Assessment 2011
23
Small efforts that engage neighbors can also help develop resident leaders. Leaders are more likely to emerge around accomplishments that are doable and understandable. Measure neighborhood change dynamics. This is a fairly straightforward principle. Along with the performance measurements used by Community Impact, more emphasis needs to be placed on efforts to measure neighborhood change. Such measurement needs to be a part of any new neighborhood revitalization framework in order to better align strategies on the ground with revitalization outcomes.
Conclusion This is a critical time for the work of neighborhood development in Chattanooga. While the city as a whole has grown, many of the neighborhoods studied in this assessment have been stagnant. Many of them showed signs of distress in the earlier assessment, conducted before the current period of economic decline. They have only gotten worse as the general condition of the economy has worsened. The path forward must recognize the importance of building neighborhood confidence, so that people can believe in a positive future for their communities. It must address directly the realities of a depressed housing market and focus on building demand. Finally, the path forward must focus its energy on engaging and developing neighborhood leaders. There are great neighborhoods in Chattanooga but they need concentrated, thoughtful reinvestment if they are going to survive as decent places.
24
Chattanooga Neighborhood Assessment 2011
List of Persons Interviewed
The following is a list of those residents and other stakeholders who were interviewed as part of this project. The author wishes to thank them for their time and the insight they shared. Alton Park Rosemary Porter Avondale Tangela Woodruff,Lawanda Graves, Joe Wheeler, Melba Lucas, Doris Baker, Russell Catron, Mamie Smith Cedar Hills Ruby Greene, Lee Tripp Clifton Hills Amanda Stofan East Chattanooga Paul Greene, James Moreland East Lake Lora Salter, Kenneth Strickland, Linda Richard, Cecily Roman Hill City Rachel Gammon Oak Grove Deborah Collier Ridgedale Gary Ball, Theresa Ivy Southside Gardens Mike Harrell St. Elmo Rebehkah Marr, Mike Feeley Choose Chattanooga Linda Bennett Ochs Center David Eichenthal, Elizabeth Crews Regional Planning Commission John Bridger City of Chattanooga Beverly Johnson, Debbie Johnson,Vanessa Jackson
Chattanooga Neighborhood Assessment 2011
25