CHAPTER TWO REVIEW OF LITERATURE This chapter reviews the literature in 4 main areas: (1) Overview of Wall’s and Nestle Ice Cream Business in Thailand, (2) Theory of Customer Satisfaction, (3) Theory of the Analysis of Consumer Markets and Buyer Behavior, and (4) Previous Similar Studies. 2.1
OVERVIEW OF WALL’S AND NESTLE ICE CREAM BUSINESS IN
THAILAND Among several brands of mass ice cream, Wall’s and Nestle can be considered the top two well-known brands in the market. According to Wall’s and Nestle’s market share information, (“
,”
, in 2004, Wall’s market share was
estimated at 43-44% while Nestle’s market share was estimated at 40%. Both brands entered the Thai market at different times. Wall’s ice cream was first launched into the Thai market by Unilever in 1989 after it purchased the ice cream business from Foremost. Those who like eating Foremost ice cream would be familiar with Wall’s ice cream because their recipe is the same. Nestle ice cream was launched by Nestle (Thai) Co., Ltd which started its business in Thailand 7 years later than Unilever. Although entering the market many years later than Wall’s, Nestle has now become one of the most popular brands in the mass ice cream market. It has enjoyed increasing market share and has strengthened its position every year due to its huge budget for developing new products, implementing marketing strategies and expanding its distribution channels. However, when mentioning about the entering period of each brand, Wall’s ice cream seems to be more advantaged than Nestle ice cream because it is the pioneer brand or the initial brand entering the mass ice cream market. Wilasinee Pimpaiboon (2001, p.59) referred to the statement of Alpert et al. that the pioneer brand is superior to the follower brand because the pioneer brand can create good perception of its consumers in terms of good quality of products, specialization in production and reliability of the products. This perception can make
10
consumers have good attitude with the pioneer brand, leading them to purchase the products of the pioneer brand more than the follower brand. In addition, the pioneer brand creates a good image for its brand since it makes consumers feel that they purchase original products. There is intense competition between both companies in this market because they have tried very hard to be the market leader. Actually, their potential to be market leader is not much different. In terms of investment budget, both brands are supported by their oversea based headquarters. Wall’s ice cream is supported by Unilever headquarters situated in UK and Netherlands. It has many affiliates in different parts of the world such as Asia, Europe and America. Nestle ice cream is not inferior in terms of its investment budget because its Swiss headquarters consists of several affiliates around the world. In addition, the marketing strategies including product, price, distribution channel and promotion are quite similar. In terms of product, both companies have divided ice cream into 3 types; impulse ice cream, take home ice cream and scoop ice cream. 1. Impulse ice cream is an individual unit in a form of stick, cup, cone, tube and bar. Consumers will buy it as an impulse purchase through the availability of point of sales. The examples of Wall’s impulse ice cream are Cornetto Royal, Pop Teen, Paddle Pop, Eskimo, Wall’s More, etc. The examples of Nestle’s impulse ice cream include Extream Load, Superchocpop, Thai Time-Cup, Thai Time stick, Mega, Hello Kitty etc. The flavors are various according to each type of ice cream. 2. Take Home ice cream is a bulk product in tub or box, i.e. take home, slicing, multi pack. Consumers will buy take home products from several hypermarkets and major supermarkets and consume at home. The examples of Wall’s take home ice cream are Wall’s Classic, Wall’s Sunday, Wall’s Selection, etc. The examples of Nestle’s take home ice cream are Standard Range and Supreme. 3. Scoop ice cream is a bulk product packed in big tub with high volume content, i.e. 3.8 liters. Scooping products are sold through restaurants, canteens and schools. Customers can sell it on sugar cone or in a cup. Both companies offer various sizes of ice cream scoop and several flavors of toppings such as chocolate, strawberry, caramel, etc.
11
In terms of price, since the ice cream ingredient can be found locally, their ice cream price is not high. In addition, their pricing strategy is quite similar. Table 3 shows an example of price comparison between Wall’s and Nestle well-known ice creams. Table 3. Examples of Price Comparison Between Wall’s and Nestle Ice Cream Wall’s Ice Cream Name Paddle Pop Wall’s More stick Cornetto Royal Pop Teen Wall’s Asian Delight Wall’s Cup Magnum Cornetto Cup
Nestle Ice Cream
Impulse Price (THB) Name 5-8 Eskimo 12 Milo stick 22 Extreme Load 10-12 Superchocpop 12 Thaitime Stick 12 Thaitime Cup 35 Mega 25 Wonder Cup
Price (THB) 7-9 10 23 12 12 12 35 30
Take Home Classic (420 grams) Sunday (430 gram) Selection Minicone
59 69 99 89
Standard Range (480 grams) Supreme (550 grams) -
59 79 -
In terms of distribution channel, both companies have tried hard to expand it as much as possible because that will help increase their sales opportunity. At present, the distribution channels of both companies are divided into 3 channels: modern trade, convenience store and traditional trade. Modern trade channel consists of main supermarkets in several big department stores and hypermarkets such as Big C, Carrefour, and Tesco Lotus. They have to strengthen the business relationship with these customers because modern trade is one of the most important distribution channels for ice cream products. The second channel is convenience stores. Convenience stores of Wall’s distribution include 7-Eleven which has about 2,000 shops around the country and Family Mart which was Nestlé’s distribution channel last year. Convenient stores of Nestle’s distribution consist of gas stations such as Star Mart, Bangjak and Petronas while Esso gas station is the channel where both Wall’s
12
and Nestle ice cream can be displayed. For the convenience store channel, Wall’s has better advantage because it has two big business alliances with 7-Eleven and Family Mart which have many branches around the country. The last distribution channel is traditional trade including traditional shops, restaurants, schools and hotels. Through this channel, each company sells their products by displaying them in the freezers placed in different points around the country. Now, Wall’s has about 50,000 freezers while Nestle has about 13,000 freezers. Furthermore, both of them have tried to reach their target group as much as possible by using tricycles. At present, the number of Nestle tricycle is higher than Wall’s; Nestle has more than 50,000 tricycles while Wall’s has about 35,000 tricycles. For marketing strategies, both companies have continuously launched several marketing campaigns in order to attract customers to buy their products. In terms of promotion, for instance, Wall’s customers can get special internet package from True Corporation PLC. The promotion is that those who have 2 Cornetto ice cream wrappers can apply for True Hi Speed internet package with free 2,000 BHT application fee. Nestle has also offered several attractive promotions. For example, when buying Extreme ice cream, customers have a chance to win several prizes such as Samsung mobile phone as the first prize, one free Eskimo ice cream as the second prize and 50% discount for ice cream purchase as the third prize. Furthermore, both companies have arranged corporate social activities and road shows touring to many places around the country. For instance, the project of Wall’s ice cream is called “More Rider”, the project giving bicycles to children living in rural areas. For Nestle, it uses the concept of “Edutainment Marketing” focusing on the activity giving both entertainment and knowledge to people. For instance, its plan is to enter more than 50 schools around the country in order to arrange school activities such as essay competition or ice cream stick collection to exchange for educational equipment. In terms of advertising, both companies have customized their advertising according to their target group. For example, for ice cream marketed towards teenagers, the idea or story of the advertising reflects the teenagers’ characteristics such as modern, out of box thinking and freedom. Nestle’s TV advertising of ice cream marketed towards teenagers, “Extreme Load”, focuses on the concept of extremity. It encourages teenagers to try new things they like and to think out of the box by communicating
13
through a 45 second TV spot. The advertising told the story of one male teenager student who was afraid to rollerblade with his friends. However, after trying Extreme Load ice cream, he had enough courage to do it with them. Furthermore, both companies sometimes use a famous actor as the presenter in order to interest the target group. For example, the presenter of Wall’s Cornetto ice cream which is an ice cream marketed towards teenagers, is Mr. Nichakun Horavejchakun, a famous teenage actor and model. 2.2
THEORY OF CUSTOMER SATISFACTION The companies which desire to win customers and outperform competitors
have to do a better job of meeting and satisfying customer needs. Frank A. Olsoon, Chairman and C.E.O. of the Hertz Corporation, stresses that it is considered the most critical success factor in any business. Without it, one cannot achieve the benefits of customer loyalty – repeat business, referrals, and reduced marketing costs. 2.2.1
Definition Liu (2000, p.3) stated that “Customer satisfaction is a function of
performance relative to the customer’s expectations”. If performance falls short of expectations, the customer is dissatisfied. In contrast, if performance matches or exceeds expectations, the customer is satisfied or highly satisfied. Walaya Rajitwattana (2003, p.6) referred to the statement of Kotler (1994) who explained that buyers form their expectation according to their buying past experiences, statements made by friends and associates, and marketer and competitor information and promises. If marketers raise expectations too high, the buyer is likely to be disappointed. 2.2.2
Process Structure of Total Customer Satisfaction Service System To meet customer’s expectations and desires, companies should apply
the process structure of total customer satisfaction service system as a checking list for customer service quality or as blue print to rebuild the customer service system.
14
2.2.2.1 Develop Customer Service Satisfaction Concept and Policy One of the most important jobs as top manager is to have a philosophical commitment to customer service. The mark of a total customer service satisfaction system is management’s readiness to commit resources and moral support to customer service for creating competitive advantage. 2.2.2.2 Market Research and Customer Needs Analysis The market is not only the customer but also includes supply chain, merchant partners, intermediary customers and end users. Therefore, it is necessary to survey one’s customers frequently, systematically, directly and personally in order for their demands to be met more directly and profitably. 2.2.2.3 Customization of Product and Services Planning Marketers should survey customer’s opinions, ideas, feelings, likes and dislikes about products or services before new concept and plans for products and services are developed in order to meet their demands. 2.2.2.4 Marketing and Selling of Products and Services Marketing strategies such as competitive price, advertising and promotion should be established. Moreover, employees should be trained and developed as an integral system for processing orders tailored to customers’ need. 2.2.2.5 Delivery Customization Delivery systems to fit the needs of core customers should be customized, in particular by creating channels of communication and service offerings to meet their demands. 2.2.2.6 Provide Customers Service Satisfaction Employees should meet customers’ needs personally and promptly. Also, cross functional cooperation by training employees to understand and enhance the entire customer experience should be built, holding them responsible for customer satisfaction. 2.2.2.7 Collection and Analysis of Customer Satisfaction Information Customer profiles should be created using a common database to track customer information. Service information should be established by studying how customers use products and services. Customer performance and satisfaction should be
15
measured through both internal measures such as sales growth and revenues, and external measures such as industry analyses and customer satisfaction surveys. These measures will allow companies to know how satisfied customers are with products and services and how well the service process is working, know where to make change to create improvements, if changes are needed; and determine if the changes led to improvement. This process structure can be a useful guide for any company expecting to gain customer satisfaction. Some of these processes have been applied by the ice cream companies like Nestle and Unilever as well. For example, Nestle has a Research Department which investigates the preference, trend and demand of customers for each product, including ice cream, in order to develop their products to meet the customers’ demand and satisfaction. Moreover, both companies have implemented many marketing strategies in order to increase sales volume and customer’s satisfaction such as buy 1 get 1 free promotion, competitive price establishment and different channels of ice cream advertising. In addition, sales representatives of each company are trained by internal and external sales and marketing specialists in order to enhance their knowledge and skill to understand the customers’ needs. 2.2.3
Customer Satisfaction Surveys There are various measures used to indicate the factors and level of
customer satisfaction. Firstly, a questionnaire can be created to measure how satisfied customers are with service A on the following scale: highly dissatisfied, dissatisfied, indifferent, satisfied and highly satisfied. Another method is to create an open-ended questionnaire to ask customers to list any problems they have had with the products or services and also the suggestions for improvement. This method can help companies get detailed information and will be helpful for analysis. Lastly, companies can use importance/performance ratings to rate various elements of the offer in terms of the importance of each element and how well the organization performed each element.
16
2.3
THEORY OF THE ANALYSIS OF CONSUMER MARKETS AND BUYER BEHAVIOR One of the most important strategies to satisfy customers’ needs and desires is
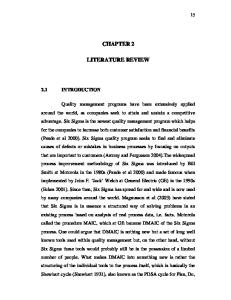
to understand consumer behavior because it can show companies how individuals, groups and organizations select, buy, use and dispose of goods, services, ideas, or experiences. How and why consumers buy? Kotler (2001, p.88) mentioned that consumer buying behavior can be explained by the stimulus response model in Figure 1. The buyers’ characteristics and decision process lead to purchasing decisions after the stimuli enter the buyers’ consciousness. Marketers should understand what happens in the buyers’ consciousness between the outside stimuli and their purchasing decisions. As this model indicates, a consumer’s buying behavior is influenced by cultural, social, personal, and psychological factors. Figure 1. Model of consumer buyer behavior Marketing Stimuli Product Price
Other Stimuli Economic Technological
Buyer' s characteristics Cultural Social
Place Promotion
Political Cultural
Personal Psychological
2.3.1
Buyer' s decision process Problem recognition Information search Evaluation of alternatives Purchase decision Postpurchase behavior
Buyer' s decision Product choice Brand choice Dealer choice Purchase timing Purchase amount
Factors Influencing Consumer Behavior Factors influencing consumer behavior can be categorized into four
types: cultural factors, social factors, personal factors and psychological factors. Cultural factors include culture, subculture and social class. Social factors include reference groups, family, roles and statuses. Personal factors include buyer’s age, stage in the life cycle, occupation, economic circumstances, lifestyle, personality and self-concept. Psychological factors include motivation, perception, learning, beliefs and attitudes. It is necessary to research all of these factors because they can provide clues as to how to reach and serve consumers more effectively. In terms of social class, for example, people from different social classes have different brand preferences and
17
distinct products. Therefore, companies should focus their efforts on one social class. Neiman Marcus, for instance, focuses on the upper classes, offering top-quality merchandise in upscale stores with many personal services adapted to their customers’ needs. For Nestle and Wall’s ice cream, both companies focus on the middle classes more than upper classes so the ice cream price is not high and the products can be found in any convenience store in Bangkok and in rural areas. On the contrary, other premium ice cream brands such as Haagen-daaz, Swensen’s and Baskin Robbins, focus on the upper classes more than middle classes or low classes. Therefore, these companies sell their products at a high price and customers can buy them only in the big shopping complexes in every big city. In terms of personality and self-concept, marketers need to know that people from different ages have their own personality and preference. They should know the importance of these factors so that they can apply the appropriate marketing strategy to influence their purchasing behavior. For example, teenagers like trying new things and like doing exciting things. Furthermore, they prefer to be accepted as a part of the group and like to be admired by their friends. Any company which would like them to purchase their products should be concerned about these personalities. For instance, TV advertising of Nestle’ ice cream that is marketed to teenagers, “Extreme Load”, which is the new cookies & cream and cappuccino cone ice cream, focuses on the concept of extremity. It encourages teenagers to try new things they like and to think out of the box by communicating it through a 45 second TV spot where the main actors of the story are teenagers. The advertising tells the story of one male teenager student who was afraid to rollerblade with his friends. However, after trying Extreme Load ice cream, he had enough courage to do it with his friends. The company tried to reach the target customers by considering these factors. In terms of occupation, Kotler (2001) stated that occupation also influences a person’s consumption pattern. For example, a blue-collar worker will buy work clothes and lunchboxes, while a company president will buy expensive suits and a country club membership. For this reason, companies should identify the occupational group that are more interested in their products and services and consider specializing their products for certain occupations.
18
2.3.2
Buying Behaviour According to Kotler (2001, pp.88-96), buying behaviour can be divided
into four types based on the degree of buyer involvement and the degree of differences among brands. 2.3.2.1 Complex Buying Behaviour applies to high-involvement products which are expensive, risky and self expressive such as personal computers. Consumers will do research since they don’t know what attributes should be considered. 2.3.2.2 Dissonance-Reducing Buying Behaviour applies to highinvolvement products such as carpeting. Carpeting is expensive and self-expressive, yet the buyer may consider most brands offering the same price range. After buying, buyers may change the brand if they find certain disquieting features or hear favorable things of other brands. As a result, marketers should supply beliefs that help consumers feel good about their choice. 2.3.2.3 Habitual Buying Behaviour applies to low-involvement products such as salt. Consumers keep buying the same brand out of habit, not due to strong brand loyalty. They make decisions based on brand familiarity. Therefore, marketers of these product types can use price and sales promotions to attract new customers. 2.3.2.4 Variety-Seeking
Buying
Behaviour
applies
to
low-
involvement products such as cookies. Consumers change brands for the sake of variety rather than dissatisfaction. Therefore, marketers will try to encourage habitual buying behavior by dominating shelf space, keeping shelves stocked, and running frequent reminder ads. The buying behavior of ice cream consumers can be categorized as habitual buying behavior and variety-seeking buying behavior because ice cream is a low-involvement product. Some people buy ice cream according to brand familiarity. For example, some people know Wall’s ice cream more than Nestle ice cream because Wall’s ice cream entered the market many years before Nestle ice cream and it uses the same recipe as Foremost ice cream. The older generation who loved Foremost ice cream like Wall’s ice cream as well. However, teenage consumers switch brands if other brands launch new products that the brand they are currently consuming does not
19
have. Therefore, many ice cream companies have tried to encourage habitual buying behavior by applying many marketing strategies. For example, Nestle’s ice cream that is marketed to teenagers, “Extreme Load”, was launched again with 360 degree marketing plan including ice cream repackaging, new coffee taste, new music freezer and mini concert in order to attract its competitors’ customers. Unilever distributing Wall’s ice cream has also tried to expand their target customers by increasing their distribution channels. For example, at present Family Mart, which used to be an exclusive distribution channel of Nestle ice cream now belongs to Wall’s ice cream. This has caused Nestle to lose sales opportunities because Family Mart, which offers 50,000 freezers around the country, is the specialist in modern trade distribution channel. Moreover, Unilever launches new promotions regularly. For instance, the join promotion of Unilever and True Corporation PLC. is that those who have 2 Cornetto ice cream wrappers can apply for True Hi Speed Internet package offering free 2,000 BHT application fee. 2.3.3
Stages of the Buying Decision Process This process starts with the problem recognition stage. It occurs when a
buyer recognizes a problem or need which can be triggered by internal stimuli such as feeling hunger and external stimuli such as seeing advertising. Then, the buyer will be inclined to search for more information, which is the second stage of the process. The buyer can search for information from personal sources such as family, friends, acquaintances; commercial sources such as advertising, websites, dealers; public sources such as mass media, consumer-rating organizations; and experimental sources such as examining or using the product. After the buyer conducts an information search, he/she will enter into the third stage which is the evaluation of alternatives. The buyer will form judgements largely on a conscious and rational basis. He/she will select the product which can deliver the benefits satisfying his/her needs the most. Then the buyer makes a decision to purchase the product. This stage is called the purchase decision process. However, two factors can intervene the purchase intention and the purchase decision. The factors are attitude of others and unanticipated situational factors. The extent to which another person’s attitude reduces one’s preferred alternative depends on two things: the intensity of the other person’s negative attitude toward the consumer’s preferred alternative, and the buyer’s
20
motivation to comply with the other person’s wishes. The unanticipated situational factors may erupt to change the purchase intention. For example, losing a job can make some purchases become more urgent. The last stage is the post purchase behaviour. In this stage, the buyer experiences some level of satisfaction or dissatisfaction which influences subsequent behavior. A satisfied buyer will be more likely to purchase the product again. On the other hand, a dissatisfied buyer may abandon or return the product; seek information that confirms its high value; take public action by complaining to the company, etc. Therefore, it is very important for companies to meet customers’ needs and desires. Ice cream consumers also follow the above steps when making a decision to purchase ice cream. A consumer’s desire can be triggered by internal or external stimuli, which is the first step of the process. For example a consumer would like to buy ice cream because the weather is so hot and he/she would like to feel fresh and relaxed. Then, he/she enters into the second stage by searching information about the products such as type and flavour of ice cream, price of ice cream, place to buy ice cream, promotion of ice cream. Then he/she selects the ice cream brand which can satisfy his/her needs most. For instance, he/she may like cookies & cream cone ice cream, which only Nestle and Haagen-daaz provide. However, Haagen-daaz ice cream is sold only at shopping complexes so he/she has to take a bus or a taxi to buy it and the price is quite high. If he/she would like to save his/her time and money, he/she will make a decision to purchase Nestle’s cookies & cream cone ice cream because he/she can purchase at the nearby convenience stores and the price is affordable. This is the fourth stage of the process. For the last stage, which is post purchase behaviour, if he/she is not satisfied with the taste of Nestle ice cream, he/she will stop buying it in the future. Nevertheless, if he/she is satisfied with its taste, he/she is more likely to purchase it again next time. 2.4
PREVIOUS SIMILAR STUDIES According to the research study of Noppawan Arunplungsunti (2003, pp.84-
86), it was found that good taste of ice cream was the most influential factor for people when deciding to purchase their products (30.3%), followed by cleanliness (11.2%),
21
various flavors and products (9.3%), price (8.6%) and beautiful packaging (7.6%). The most favorite flavor was chocolate (24.45%), followed by vanilla (17.72%) and coffee (11.80%). The most popular ice cream style was ice cream cone (56.33%), followed by ice cream scoop (50.00%) and ice cream cup (46.39%). Regarding brand awareness, Wall’s and Nestle had the highest score which was 100% and 95%, followed by Magnolia (43%) and Dairy Bell (18%). However, the brand that people consumed most often was Wall’s (59%), and Swensens (52%). For the people’s opinion about the ice cream price, Nestle’s price was considered most reasonable (78%), followed by Wall’s (70%) and Dairy Queen (57%). Moreover, the researcher stated that discount was the most attractive promotion strategy in the purchasing decision (72.59%), followed by free ice cream products (14.76%) and free premiums (9.94%). According to the study, the most interesting new product was ice cream mixed with almond macadamia (21.79%), followed by ice cream mixed with chocolate or jelly (17.47%) and ice cream mixed with baked desserts like cookies, brownies or biscuits (14.96%). Considering the relationship between new products and the age of consumers, the researcher found that Ice cream mixed with chocolate was less popular according to the increasing age of consumers. Herb ice cream was most popular among consumers who were more than 30 years old. Yogurt ice cram mixed with fruits was popular among people at every age. Prim Phisolayabutra (1997) referred to the Thai Farmers Research Center’s results of how people eat ice cream. The poll revealed that Bangkokkians spent approximately 100 THB each week on their favourite ice cream. Moreover, 35.1% liked ice cream bars and cones the most while 32.9% liked scoops and 32% preferred ice cream in cups or boxes. These results were the same as the results of Noppawan Arunplungsunti (2003), in A Survey of Consumers’ Attitude and Behavior Towards Ice Cream in Bangkok, in terms of ice cream style. Regarding the brand of ice cream, 28.3% of respondents said they were not interested in ice cream brand and 28.3% could not remember the brand-names. This study shows the similarity with what Nestle (Thai) Ltd. mentioned about brand royalty . It was stated that ice cream consumers have low brand royalty so branding strategy is not appropriate for ice
22
cream business. As a result, Nestle (Thai) Ltd. has focused on new flavor innovation and continual increase of marketing promotion instead (“
,”
).
At an international level, “Sales of ice cream in US in 2000 were about $20 billion. Approximately two-thirds of this was sold in scoop shops, restaurants, retail outlets, etc and eaten out of the home. One-third was sold in supermarkets, grocery shops, etc., mostly as half gallon (2.21) tubs. More than half of the sales were premium ice cream; frozen yogurt and sherbet accounting for smaller (< 10%) but significant proportions of the market. Vanilla was the most popular flavour, accounting for about a quarter of sales, followed by chocolate. Ice cream with pieces of other components (known as inclusions), such as cookie dough, marshmallow, fruit chunks, nuts, chocolate, toffee or fudge, was becoming increasingly popular, and accounted for nearly a quarter of sales” (‘The Story,” 2007). This study was intended to find the answers to the problems concerning the degrees of teenagers’ satisfaction with Wall’s and Nestle ice cream and the key factors that make students’ satisfied with Wall’s and Nestle ice cream. Therefore, the next chapter will describe the research methodology which can help the researcher to find the answers to the above problems.