Chapter 4 Precipitation
Introduction
Overview
Precipitation is applied to a drainage area to calculate runoff with the Sacramento method. Precipitation data is most often in the form of design storms. Alternatives to the use of design storms are historic storms and continuous simulation.
Design Storms
The design storm is the most frequently used form of precipitation data for rainfall-runoff simulation. Design storms are developed from a statistical analysis of local precipitation records. The design storm concept assumes a precipitation event of a particular frequency will produce a runoff event of the same frequency. Design storms are widely used because they: • • • •
Historic Storms
require minimal resources in terms of time and money can give conservative results are generally accepted in practice have the advantage of consistency of methodology
The use of design storms limits facility design to a narrow range of the possible precipitation patterns and durations. For the planning and design of facilities which are highly dependent on the temporal distribution and volume of precipitation, such as detention facilities, the use of historic storms may be more appropriate. In special cases the City or County may require the use of historic storms to determine runoff volumes. The February 1986 storm has been adopted by the County as the design precipitation event for the analysis of the Beach-Stone Lakes area. Other historic storms may be selected for special cases within the City and County. Additionally, the City or County may require the reconstitution of historic storms to calibrate HEC-1 models. Point precipitation records at gages have been used in the past, but radar imagery is beginning to be used as well.
City and County of Sacramento Drainage Manual
Volume 2: Hydrology Standards December 1996
4-1
Part 2 - The Sacramento Method
Chapter 4 - Precipitation
Introduction (continued)
Continuous Simulation
Continuous simulation involves the use of historical, long-term precipitation records rather than a single design storm or historic storm. Continuous simulation can sometimes provide a better approximation of drainage facility reliability and for an analysis of economics versus reliability of design. Continuous simulation is becoming more widely used with the development of computer programs and the increasing capacity to handle greater amounts of data.
City and County of Sacramento Drainage Manual
Volume 2: Hydrology Standards December 1996
4-2
Part 2 - The Sacramento Method
Chapter 4 - Precipitation
Design Storms
Overview
A design storm statistically represents the variability of precipitation depth, and temporal and areal distribution occurring in nature. The design storm is a distribution of rainfall depths over a time increment for a given storm duration and frequency.
Elements of Design Storms
The principle elements of design storms are: Depth: the depth of precipitation occurring during a specified storm duration. Statistical analyses of historical precipitation data are used to find the maximum rainfall depth for given durations and frequencies. Duration: the period of time over which precipitation occurs. The duration of a design storm is dependent on the objective of the hydrologic analysis. Design storms are classified as short-duration storms (less than or equal to 24 hours) and long-duration storms (greater than 24 hours). Frequency: the frequency in which a specified precipitation depth is equaled or exceeded within a specified time. The frequency is often expressed in terms of the return period. The statistical concept of return period or recurrence interval aids in assigning a probabilistic meaning to a precipitation event. Temporal distribution: the time-related distribution of the precipitation depth within the duration of the design storm. Temporal distribution patterns of design storms are based on the storm duration. The temporal distribution pattern for short-duration storms represents a single cloudburst and is based on rainfall statistics. The temporal distribution for long-duration storms resembles multiple events and is patterned after historic events. Spatial distribution: the aerial distribution of the precipitation depth over the watershed. This is typically disregarded for small watersheds but is included for larger watersheds or for major structure design by using storm centering techniques.
City and County of Sacramento Drainage Manual
Volume 2: Hydrology Standards December 1996
4-3
Part 2 - The Sacramento Method
Chapter 4 - Precipitation
Sacramento Method Design Storms
Overview
The Sacramento method includes two types of design storms, short- and longduration. The design storm used is dependent on whether peak flow or total volume of runoff is analyzed. Features of the two storm types are summarized below. Storm Type Feature
Short-Duration Storms
Short-Duration
Long-Duration
Application
Peak Flow and Volume Analysis
Volume Analysis
Duration
6-, 12-, 24-hour
36-hour, 5- and 10-day
Frequency
2-, 5-, 10-, 25-, 50-, 100-, 200-, 500-year
2-, 5-, 10-, 25-, 50-, 100-, 200-, 500-year
Temporal Distribution
Single Cloudburst
Multiple Event
Short-duration storms have durations of 6, 12 and 24 hours, representing single cloudburst events with high intensity precipitation in the middle of the storm. The high intensity precipitation produces the peak runoff for which most stormwater and other facilities are designed. Examples of facilities which are designed with short duration storms include: • • • •
open channel and bridge/culvert facilities detention basins designed to reduce peak flow in a channel pumping facilities where design is governed by short-duration storms special case storm and street drainage
The storm duration should be greater than the time required for the hydrograph peak to reach the point of interest, such as a structure, outlet or spillway. The storm duration selected should also produce the critical, i.e. worst case, peak flow or maximum volume for the facility being considered.
Continued on next page...
City and County of Sacramento Drainage Manual
Volume 2: Hydrology Standards December 1996
4-4
Part 2 - The Sacramento Method
Chapter 4 - Precipitation
Sacramento Method Design Storms (continued)
Long-Duration Storms
Long-duration storms have durations of 36 hours, and 5 and 10 days, representing multiple precipitation events which occur over the selected duration. These storms are used when the volume of runoff over a period of time, rather than the peak discharge, is important. Examples of cases where runoff volume is important include: • • •
pumping facilities where long-duration storms govern delineating flooded areas behind levees quantifying increases in runoff volume due to development where longduration storms have downstream impacts
The selection of the storm duration is often based on the emptying time of a storage facility. The storm duration selected should produce the critical, i.e. worst case, volume for the facility being considered. Design Storms in SACPRE
Design storms for the Sacramento area can be generated by SACPRE, the HEC-1 preprocessor, included with this volume. The preprocessor can generate design storms for the following frequencies and durations: •
frequencies: 2-, 5-, 10-, 25-, 50-, 100-, 200-, and 500-year recurrence.
•
durations: 6-, 12-, 24-hour (short-duration), and 36-hour, 5- and 10-day (long-duration).
City and County of Sacramento Drainage Manual
Volume 2: Hydrology Standards December 1996
4-5
Part 2 - The Sacramento Method
Chapter 4 - Precipitation
Depth-Duration-Frequency Relationships
Overview
Depth-Duration-Frequency (DDF) relationships are used to develop design storms. The relationships are derived from a statistical analysis of historical precipitation records. Given a long history of rainfall data, a reasonable statistical interpretation can determine estimates of maximum rainfall depths as a function of storm duration and return frequency. Continued on next page...
City and County of Sacramento Drainage Manual
Volume 2: Hydrology Standards December 1996
4-6
Part 2 - The Sacramento Method
Chapter 4 - Precipitation
Depth-Duration-Frequency Relationships (continued)
Statistical Analysis
DDF relationships in Sacramento County are based on an annual maximum analysis of 88 years of continuous rainfall record (extended to 121 years with daily record) from the National Weather Service (NWS) downtown Sacramento gage. The precipitation records were analyzed to determine the annual maximum rainfall depth over various durations from 5 minutes to several days. The rainfall depth corresponding to each return period was then determined. The resulting DDF relationships are listed in Table 4-1. Gage IntensityDuration-Frequency (IDF) information derived from the DDF relationships is given in Table 4-2. Table 4-1. Depth-Duration-Frequency Relationships (inches) Frequency, years Duration
2
5
10
25
50
5 min
0.13
0.20
0.25
0.32
0.38
0.44
0.49
0.58
10 min
0.19
0.29
0.36
0.46
0.54
0.62
0.70
0.82
15 min
0.23
0.35
0.43
0.55
0.64
0.73
0.82
0.96
30 min
0.32
0.47
0.57
0.72
0.83
0.94
1.04
1.22
1 hour
0.45
0.64
0.77
0.94
1.07
1.21
1.33
1.53
2 hours
0.64
0.88
1.04
1.26
1.42
1.59
1.76
2.00
3 hours
0.77
1.04
1.23
1.47
1.66
1.85
2.03
2.31
6 hours
1.06
1.40
1.65
1.95
2.22
2.50
2.75
3.10
12 hours
1.43
1.91
2.25
2.67
3.00
3.30
3.60
4.00
24 hours
1.90
2.50
2.98
3.46
3.85
4.25
4.60
5.20
36 hours
2.25
3.02
3.54
4.15
4.60
5.09
5.53
6.24
2 days
2.51
3.40
3.95
4.65
5.15
5.70
6.20
7.00
3 days
3.00
4.07
4.65
5.50
6.20
6.80
7.50
8.40
5 days
3.61
4.91
5.76
6.85
7.63
8.42
9.20
10.29
10 days
4.73
6.44
7.54
8.96
9.97
11.01
11.95
13.45
City and County of Sacramento Drainage Manual
100
200
500
Volume 2: Hydrology Standards December 1996
4-7
Part 2 - The Sacramento Method
Chapter 4 - Precipitation
Depth-Duration-Frequency Relationships (continued)
Statistical Analysis (Cont.)
Table 4-2. Intensity-Duration-Frequency Relationships (inches/hour) Frequency, years Duration
2
5
10
25
50
100
200
5 min
1.56
2.40
3.00
3.84
4.56
5.28
5.88
6.96
10 min
1.14
1.74
2.16
2.76
3.24
3.72
4.20
4.92
15 min
0.92
1.40
1.72
2.20
2.56
2.92
3.28
3.84
30 min
0.64
0.94
1.14
1.44
1.66
1.88
2.08
2.44
1 hour
0.45
0.64
0.77
0.94
1.07
1.21
1.33
1.53
2 hours
0.32
0.44
0.52
0.63
0.71
0.80
0.88
1.00
3 hours
0.26
0.35
0.41
0.49
0.55
0.62
0.68
0.77
6 hours
0.18
0.23
0.28
0.33
0.37
0.42
0.46
0.52
12 hours
0.12
0.16
0.19
0.22
0.25
0.28
0.30
0.33
24 hours
0.08
0.10
0.12
0.14
0.16
0.18
0.19
0.22
36 hours
0.06
0.08
0.10
0.12
0.13
0.14
0.15
0.17
2 days
0.05
0.07
0.08
0.10
0.11
0.12
0.13
0.15
3 days
0.04
0.06
0.06
0.08
0.09
0.09
0.10
0.12
5 days
0.03
0.04
0.05
0.06
0.06
0.07
0.08
0.09
10 days
0.02
0.03
0.03
0.04
0.04
0.05
0.05
0.06
City and County of Sacramento Drainage Manual
500
Volume 2: Hydrology Standards December 1996
4-8
Part 2 - The Sacramento Method
Chapter 4 - Precipitation
Precipitation Depth Adjustments
Overview
The DDF relationships in Table 4-1 represent the characteristics of point rainfall. Adjustments to the DDF information are required for use over large areas, and other locations in the County. The adjustment factors are based on annual maximum analyses of eight gages in Sacramento County and gages in adjacent Placer County. Based on the gage analyses and NWS publications, adjustments to the precipitation depths are required for the following factors: • • •
region - location of basin within the county elevation - average elevation of the drainage basin area - areal extent of the drainage basin.
Regional Adjustments
The statistical analysis of the County precipitation gages for durations of 60 minutes and less indicated greater precipitation in the northeast portion of the county and less precipitation in the southwest portion. To account for this difference, the county was divided into three regional zones and multipliers were assigned to each. The zones and multipliers for durations of 60 minutes and less are shown on Figure 4-1. A larger, more detailed map, is included at the end of this volume. The rainfall zones are different than the hydrologic zones shown on Figure 2-3.
Elevation Adjustments
The precipitation analysis indicated significant rainfall increases occurred at elevations exceeding 100 feet (30.5m). Orographic effects are responsible for this increase from southwest to northeast in Sacramento County, as demonstrated by the average annual precipitation map included with this volume. To account for the increase in precipitation with elevation, the design rainfall depths in Table 4-1 are adjusted for the average elevation of the drainage area by calculating an increase in precipitation using the factors in Table 4-3 (disk). This is done for Rainfall Zone 3 only. Continued on next page...
City and County of Sacramento Drainage Manual
Volume 2: Hydrology Standards December 1996
4-9
Part 2 - The Sacramento Method
Chapter 4 - Precipitation
Precipitation Depth Adjustments (continued)
Area Adjustments
The DDF relationships derived for the NWS downtown Sacramento gage are only representative of an area of a few hundred acres. Multiplication reduction factors have been determined for converting point gage data to area data. These factors are given in Tables 4-4 (disk) and 4-5 (disk). Factors for durations greater than one hour are based on NOAA Atlas 2, Precipitation-Frequency Atlas of the Western United States, Volume XI-California. Factors for durations less than one hour are based on NWS Technical Paper 40.
City and County of Sacramento Drainage Manual
Volume 2: Hydrology Standards December 1996
4-11
Part 2 - The Sacramento Method
Chapter 4 - Precipitation
Temporal Distribution of Design Storms
Overview
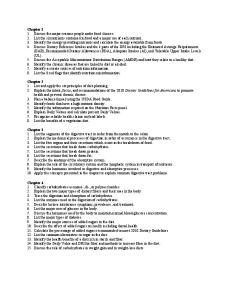
The temporal distribution of rainfall, which varies with storm type, intensity and duration, impacts the characteristics of the runoff hydrograph. There is no typical distribution that is applicable to all precipitation events. For design purposes two different temporal distributions based on the storm duration are included in the Sacramento method. A summary of these storms is given below. Storm
Duration
Distribution
Short-Duration
24 hours
Multiple precipitation event
PRECIPITATION DEPTH
PRECIPITATION DEPTH
Examples of these distributions are shown in the following illustration.
TIME, HOURS
TIME, DAYS
SHORT-DURATION STORM
LONG-DURATION STORM
DESIGN STORM TEMPORAL DISTRIBUTION
Continued on next page...
City and County of Sacramento Drainage Manual
Volume 2: Hydrology Standards December 1996
4-12
Part 2 - The Sacramento Method
Chapter 4 - Precipitation
Temporal Distribution of Design Storms (continued)
Short-Duration Storms
A symmetrical precipitation distribution was selected to represent the short duration storms in Sacramento County. A symmetrical precipitation distribution is constructed such that the depth specified for any duration occurs during the central part of the storm. The design storm pattern consists of critical incremental precipitation depths nested within the storm duration in an alternating pattern with the maximum value in the center and the second highest value to the right of center. For example, the 5-minute depth is subtracted from the 10-minute depth and the 10minute depth is subtracted from the 15-minute depth. The storm pattern is formed by arranging the 5 minute incremental depths such that the maximum 5 minute depth is contained within the maximum 10-minute depth and the maximum 10 minute depth is contained within the maximum 15 minute depth and so forth. With this nested pattern the critical storm depth for all durations less than the total duration of the storm are nested within the storm. This pattern is referred to as a balanced storm. Time increments of 5 minutes are recommended for the calculation of precipitation for design storms in the County.
Long-Duration Storms
Long duration storms in the Sacramento area typically consist of several precipitation events separated by periods of either low intensity precipitation or no precipitation. Precipitation patterns for long duration storms were developed from an analysis of historical storms. The hourly precipitation records for the Downtown Sacramento NWS gage were examined to identify the ten maximum depth storms for durations of 36-hours, 5 days and 10 days. From these storms generalized temporal distributions of precipitation were derived for each 5 duration . The resulting distributions are given in Tables 4-6, 4-7, and 4-8 (disk).
City and County of Sacramento Drainage Manual
Volume 2: Hydrology Standards December 1996
4-13
Part 2 - The Sacramento Method
Chapter 4 - Precipitation
Areal Distribution of Design Storms
Overview
Precipitation depths frequently vary in space over a watershed. Areal variations in design storms are typically disregarded for small watersheds. However, for larger watersheds or major structure designs the areal distribution of the precipitation can be relevant and is included through a technique called storm centering.
Storm Centering
Storm centering situates the design storm over the watershed in such a way that it maximizes the peak discharge at a given point or reach within the watershed. The two storm centering methods in these standards are average uniform depth over an area, and elliptical isohyetal storm patterns.
Average Uniform Depth over Area
Using average uniform rainfall depth over an area is the most common method of varying the areal distribution of precipitation in the City and County of Sacramento. The method is based on the precipitation depth-area adjustments and assumes an average rainfall depth of approximately uniform distribution upstream of a given location. As the size of the watershed increases, the average rainfall depth decreases. The rainfall depths for each individual subbasin (which reflect elevation and rainfall zone) are adjusted using the depth-area reduction factor for the total area specified on the *G record (i.e. the storm centering). The maximum peak discharge at any given location will normally be computed by centering a storm upstream of that point. This is done by substituting the drainage area upstream of the point of interest for the total basin area in precipitation calculations which results in more intense precipitation due to a smaller areal precipitation reduction. For many studies, a single storm centering (a single HEC-1 model) above the most downstream concentration point will give adequate peak discharge results at all the points of interest in the model. Continued on next page...
City and County of Sacramento Drainage Manual
Volume 2: Hydrology Standards December 1996
4-14
Part 2 - The Sacramento Method
Chapter 4 - Precipitation
Areal Distribution of Design Storms (continued)
Average Uniform Depth over Area (Cont.)
As the size of the drainage area increases, or where major tributaries converge, additional storm centerings upstream of specific concentration points may be necessary. As a rule of thumb, if the difference in peak discharge with the storm centered at the upstream point of a reach in a model is 10% greater than the peak discharge with the storm centered at the downstream point of a reach, an additional storm centering is required. Peak discharges for intermediate points along a reach may be determined by interpolation of peak flows based on the contributing area between the two storm centerings. The following illustration shows storm centering using the average uniform depth over an area method.
1
2
3
STORM CENTERING FOR LOCATION 1
STORM CENTERING FOR LOCATION 2
STORM CENTERING FOR LOCATION 3
PRECIPITATION DEPTH - AREA RELATIONSHIP DRAINAGE AREA
PRECIPITATION
10 sq. mi. (16.1 sq. km.) 20 sq. mi. (32.2 sq. km.) 50 sq. mi. (80.5 sq. km.)
1.62 in. (41.1 mm) 1.58 in. (40.1 mm) 1.50 in. (38.1 mm)
STORM CENTERING
Continued on next page...
City and County of Sacramento Drainage Manual
Volume 2: Hydrology Standards December 1996
4-15
Part 2 - The Sacramento Method
Chapter 4 - Precipitation
Areal Distribution of Design Storms (continued)
Elliptical Isohyetal Storm Patterns
Another method of storm centering which varies the areal distribution of precipitation uses an elliptical isohyetal storm pattern. This method can be used for any large watershed, but is also useful for analyzing drainage basins with unusual shapes or marked differences in urbanization or infiltration. With this method, the precipitation is distributed spatially over the basin according to a design isohyetal pattern. Varying precipitation depths are assigned to a set of concentric elliptical isohyets such that the maximum depth occurs at the center of the storm and the precipitation depth decreases towards the outer edges. The precipitation depths are assigned to the isohyets such that the total volume of precipitation over the basin equals the volume of precipitation that would result with the average uniform depth applied over the same storm area. AutoCad files or hardcopy printouts of the isohyetal patterns are available for all design frequencies (2- through 500year). These can be overlain on a watershed map of the same scale to manually determine the rainfall depths of each subbasin for various storm orientations. The Sacramento Design Precipitation program (SDP) automatically performs these calculations and is included in the disk accompanying this volume. The following illustration shows an isohyetal storm pattern over a drainage basin.
City and County of Sacramento Drainage Manual
PRECIPITATION DEPTH
ELLIPTICAL ISOHYETAL STORM PATTERN CENTERED OVER A DRAINAGE BASIN
Volume 2: Hydrology Standards December 1996
4-16
Part 2 - The Sacramento Method
Chapter 4 - Precipitation
Constructing Design Storms
Overview
The short- and long-duration design storms can be derived manually or generated automatically using SACPRE, the HEC-1 preprocessor. Information required to construct short- and long-duration storms includes: • • • • •
design storm duration design storm frequency precipitation zone average elevation total area
Construction of the two types of design storms differs. The steps required to manually construct these storms are described below. Short-Duration Design Storms
Short-duration design storms for the Sacramento method are the 6-, 12-, and 24-hour storms. The procedure for manually constructing a short-duration design storm is described below. Procedure for Manually Constructing Short-Duration Design Storms Step No. 1 2 3 4 5 6
7
Description Determine the precipitation depths for each duration from 5 minutes up to the duration of the required storm. Apply the regional multiplier to precipitation depths of 1hour and less. Add elevation precipitation adjustment to precipit-ation depths for all durations. (Zone 3 only) Apply area multiplier to precipitation depths for durations less than 1 hour. Apply area multiplier to precipitation depths for durations greater than 1 hour. Calculate the incremental depths for the desired time increment, by subtracting the precipitation for each duration from the next longest duration and dividing it into 5-minute increments. Distribute the 5-minute incremental precipitation values with the maximum depth as the central value and progressively lower values alternating to the right and then left of the center of the storm.
Reference Table 4-1 Zone Map Appendix 4-3 4-4 4-5
Continued on next page...
City and County of Sacramento Drainage Manual
Volume 2: Hydrology Standards December 1996
4-17
Part 2 - The Sacramento Method
Chapter 4 - Precipitation
Constructing Design Storms (continued)
Long-Duration Design Storms
Long-duration design storms for the Sacramento method are the 36-hour, 5-day and 10-day storms. The procedure for manually constructing a long-duration design storm is described below. Procedure for Manually Constructing Long-Duration Design Storms Step No.
Design Storms in SACPRE
Description
Reference Table
1
Determine total storm depth for desired storm duration and frequency.
4-1
2
Adjust total storm depth for the average elevation of the basin. (Zone 3 only)
4-3
3
Adjust the total storm depth for the total area of the basin.
4-5
4
Distribute the total rainfall according to the long duration design storm temporal distribution.
4-6 4-7 4-8
Design storms can be constructed with SACPRE, the HEC-1 preprocessor. The preprocessor will adjust the precipitation for the zone, elevation, and total drainage basin area. Design storms for the following frequencies and durations can be generated by SACPRE: •
frequencies: 2-, 5-, 10-, 25-, 50-, 100-, 200-, and 500-year recurrence.
•
durations: 6-, 12-, and 24-hours (short-duration), and the 36-hour and 5and 10-day (long-duration).
City and County of Sacramento Drainage Manual
Volume 2: Hydrology Standards December 1996
4-18