Chapter 1 Introduction to derivatives The emergence of the market for derivative products, most notably forwards, futures and options, can be traced back to the willingness of risk-averse economic agents to guard themselves against uncertainties arising out of fluctuations in asset prices. By their very nature, the financial markets are marked by a very high degree of volatility. Through the use of derivative products, it is possible to partially or fully transfer price risks by locking–in asset prices. As instruments of risk management, these generally do not influence the fluctuations in the underlying asset prices. However, by locking-in asset prices, derivative products minimize the impact of fluctuations in asset prices on the profitability and cash flow situation of risk-averse investors.
1.1
Derivatives defined
Derivative is a product whose value is derived from the value of one or more basic variables, called bases (underlying asset, index, or reference rate), in a contractual manner. The underlying asset can be equity, forex, commodity or any other asset. For example, wheat farmers may wish to sell their harvest at a future date to eliminate the risk of a change in prices by that date. Such a transaction is an example of a derivative. The price of this derivative is driven by the spot price of wheat which is the “underlying”. In the Indian context the Securities Contracts (Regulation) Act, 1956 (SC(R)A) defines “derivative” to include – 1. A security derived from a debt instrument, share, loan whether secured or unsecured, risk instrument or contract for differences or any other form of security. 2. A contract which derives its value from the prices, or index of prices, of underlying securities.
Derivatives are securities under the SC(R)A and hence the trading of derivatives is governed by the regulatory framework under the SC(R)A.
8
1.2
Introduction to derivatives
Products, participants and functions
Derivative contracts have several variants. The most common variants are forwards, futures, options and swaps. The following three broad categories of participants - hedgers, speculators, and arbitrageurs trade in the derivatives market. Hedgers face risk associated with the price of an asset. They use futures or options markets to reduce or eliminate this risk. Speculators wish to bet on future movements in the price of an asset. Futures and options contracts can give them an extra leverage; that is, they can increase both the potential gains and potential losses in a speculative venture. Arbitrageurs are in business to take advantage of a discrepancy between prices in two different markets. If, for example, they see the futures price of an asset getting out of line with the cash price, they will take offsetting positions in the two markets to lock in a profit. The derivatives market performs a number of economic functions. First, prices in an organized derivatives market reflect the perception of market participants about the future and lead the prices of underlying to the perceived future level. The prices of derivatives converge with the prices of the underlying at the expiration of the derivative contract. Thus derivatives help in discovery of future as well as current prices. Second, the derivatives market helps to transfer risks from those who have them but may not like them to those who have an appetite for them. Third, derivatives, due to their inherent nature, are linked to the underlying cash markets. With the introduction of derivatives, the underlying market witnesses higher trading volumes because of participation by more players who would not otherwise participate for lack of an arrangement to transfer risk. Fourth, speculative trades shift to a more controlled environment of derivatives market. In the absence of an organized derivatives market, speculators trade in the underlying cash markets. Margining, monitoring and surveillance of the activities of various participants become extremely difficult in these kind of mixed markets. Fifth, an important incidental benefit that flows from derivatives trading is that it acts as a catalyst for new entrepreneurial activity. The derivatives have a history of attracting many bright, creative, well-educated people with an entrepreneurial attitude. They often energize others to create new businesses, new products and new employment opportunities, the benefit of which are immense. Finally, derivatives markets help increase savings and investment in the long run. Transfer of risk enables market participants to expand their volume of activity.
1.3
Types of derivatives
The most commonly used derivatives contracts are forwards, futures and options which we shall discuss in detail later. Here we take a brief look at various derivatives contracts that have come to be used. Forwards: A forward contract is a customized contract between two entities, where settlement takes place on a specifi c date in the future at today’s pre-agreed price. Futures: A futures contract is an agreement between two parties to buy or sell an asset at a certain time in the future at a certain price. Futures contracts are special types of forward contracts in the sense that the former are standardized exchange-traded contracts.
1.3 Types of derivatives
9
Derivative products initially emerged as hedging devices against fluctuations in commodity prices, and commodity-linked derivatives remained the sole form of such products for almost three hundred years. Financial derivatives came into spotlight in the post-1970 period due to growing instability in the fi nancial markets. However, since their emergence, these products have become very popular and by 1990s, they accounted for about two-thirds of total transactions in derivative products. In recent years, the market for fi nancial derivatives has grown tremendously in terms of variety of instruments available, their complexity and also turnover. In the class of equity derivatives the world over, futures and options on stock indices have gained more popularity than on individual stocks, especially among institutional investors, who are major users of index-linked derivatives. Even small investors fi nd these useful due to high correlation of the popular indexes with various portfolios and ease of use. The lower costs associated with index derivatives vis–a–vis derivative products based on individual securities is another reason for their growing use.
Box 1.1: Emergence of financial derivative products
Options: Options are of two types - calls and puts. Calls give the buyer the right but not the obligation to buy a given quantity of the underlying asset, at a given price on or before a given future date. Puts give the buyer the right, but not the obligation to sell a given quantity of the underlying asset at a given price on or before a given date. Warrants: Options generally have lives of upto one year, the majority of options traded on options exchanges having a maximum maturity of nine months. Longer-dated options are called warrants and are generally traded over-the-counter. LEAPS: The acronym LEAPS means Long-Term Equity Anticipation Securities. These are options having a maturity of upto three years. Baskets: Basket options are options on portfolios of underlying assets. The underlying asset is usually a moving average of a basket of assets. Equity index options are a form of basket options. Swaps: Swaps are private agreements between two parties to exchange cash flows in the future according to a prearranged formula. They can be regarded as portfolios of forward contracts. The two commonly used swaps are :
Interest rate swaps: These entail swapping only the interest related cash flows between the parties in the same currency. Currency swaps: These entail swapping both principal and interest between the parties, with the cashflows in one direction being in a different currency than those in the opposite direction. Swaptions: Swaptions are options to buy or sell a swap that will become operative at the expiry of the options. Thus a swaption is an option on a forward swap. Rather than have calls and puts, the swaptions market has receiver swaptions and payer swaptions. A receiver swaption is an option to receive fi xed and pay floating. A payer swaption is an option to pay fi xed and receive floating.
10
Introduction to derivatives
Early forward contracts in the US addressed merchants’ concerns about ensuring that there were buyers and sellers for commodities. However “credit risk” remained a serious problem. To deal with this problem, a group of Chicago businessmen formed the Chicago Board of Trade (CBOT) in 1848. The primary intention of the CBOT was to provide a centralized location known in advance for buyers and sellers to negotiate forward contracts. In 1865, the CBOT went one step further and listed the fi rst “exchange traded” derivatives contract in the US, these contracts were called “futures contracts”. In 1919, Chicago Butter and Egg Board, a spin-off of CBOT, was reorganized to allow futures trading. Its name was changed to Chicago Mercantile Exchange (CME). The CBOT and the CME remain the two largest organized futures exchanges, indeed the two largest “fi nancial” exchanges of any kind in the world today. The fi rst stock index futures contract was traded at Kansas City Board of Trade. Currently the most popular stock index futures contract in the world is based on S&P 500 index, traded on Chicago Mercantile Exchange. During the mid eighties, fi nancial futures became the most active derivative instruments generating volumes many times more than the commodity futures. Index futures, futures on T-bills and Euro-Dollar futures are the three most popular futures contracts traded today. Other popular international exchanges that trade derivatives are LIFFE in England, DTB in Germany, SGX in Singapore, TIFFE in Japan, MATIF in France, Eurex etc.
Box 1.2: History of derivatives markets
1.4
Development of exchange-traded derivatives
Derivatives have probably been around for as long as people have been trading with one another. Forward contracting dates back at least to the 12th century, and may well have been around before then. Merchants entered into contracts with one another for future delivery of specified amount of commodities at specified price. A primary motivation for pre-arranging a buyer or seller for a stock of commodities in early forward contracts was to lessen the possibility that large swings would inhibit marketing the commodity after a harvest. The following factors have been driving the growth of financial derivatives: 1. Increased volatility in asset prices in fi nancial markets, 2. Increased integration of national fi nancial markets with the international markets, 3. Marked improvement in communication facilities and sharp decline in their costs, 4. Development of more sophisticated risk management tools, providing economic agents a wider choice of risk management strategies, and 5. Innovations in the derivatives markets, which optimally combine the risks and returns over a large number of fi nancial assets leading to higher returns, reduced risk as well as transactions costs as compared to individual fi nancial assets.
1.5 Global derivatives markets
11
Table 1.1 The global derivatives industry: Outstanding contracts, (in $ billion) 1995
1996
1997
1998
1999
2000
9283 8618 154 511 17713 16515 1197 -
10018 9257 171 591 25453 23894 1560 -
12403 11221 161 1021 29035 27211 1824 -
13932 12643 81 1208 80317 44259 5948 30110
13522 11669 59 1793 88201 53316 4751 30134
14302 12626 96 1580 95199 58244 5532 31423
Total 26996 35471 Source: Bank for International Settlements
41438
94249
101723
109501
Exchange traded instruments Interest rate futures and options Currency futures and options Stock Index futures and options Some OTC instruments Interest rate swaps and options Currency swaps and options Other instruments
1.5
Global derivatives markets
The derivatives markets have grown manifold in the last two decades. Table 1.1 presents growth of the derivatives industry. According to the Bank for International Settlements(BIS), the approximate size of global derivatives market was US$ 109.5 trillion as at end–December 2000. The total estimated notional amount of outstanding over–the–counter(OTC) contracts stood at US$ 95.2 trillion as at end–December 2000, an increase of 7.9% over end–December 1999. Growth in OTC derivatives market is mainly attributable to the continued rapid expansion of interest rate contracts, which reflected growing corporate bond markets and increased interest rate uncertainty at the end of 2000. The amount outstanding in organized exchange markets increased by 5.8% from US$ 13.5 trillion as at end–December 1999 to US$ 14.3 trillion as at end–December 2000. The turnover data are available only for exchange–traded derivatives contracts. The turnover in derivative contracts traded on exchanges has increased by 9.8% during 2000 to US$ 384 trillion as compared to US$ 350 trillion in 1999(Table 1.2). While interest rate futures and options accounted for nearly 90% of total turnover during 2000, the popularity of stock market index futures and options grew modestly during the year. According to BIS, the turnover in exchange–traded derivative markets rose by a record amount in the first quarter of 2001, while there was some moderation in the OTC volumes.
1.6
Exchange-traded vs. OTC derivatives markets
The OTC derivatives markets have witnessed rather sharp growth over the last few years, which has accompanied the modernization of commercial and investment banking and globalisation of financial activities. The recent developments in information technology have contributed to a great extent to these developments. While both exchange-traded and OTC derivative contracts offer many benefits, the former have rigid structures compared to the latter. It has been widely
12
Introduction to derivatives
Table 1.2 Turnover in derivatives contracts traded on exchanges, (in US$ trillion) 1993
1994
1995
1996
1997
1998
1999
2000
Interest rate futures Interest rate options Currency futures Currency options Stock market index futures Stock market index options
177.3 32.8 2.8 1.4 7.1 6.3
271.9 46.7 3.3 1.4 9.4 8
266.4 43.3 3.2 1.3 10.6 9.3
253.6 41 2.6 1.3 12.9 10.2
247.8 48.6 2.7 0.9 16.4 13.1
296.6 55.8 2.5 0.5 19.6 14.7
263.8 45.6 2.6 0.3 21.7 15.7
292.3 47.5 2.4 0.2 22.7 18.7
Total
227.7
340.7
334.1
321.6
356.5
389.7
349.7
383.8
Source: Bank for International Settlements
discussed that the highly leveraged institutions and their OTC derivative positions were the main cause of turbulence in financial markets in 1998. These episodes of turbulence revealed the risks posed to market stability originating in features of OTC derivative instruments and markets. The OTC derivatives markets have the following features compared to exchange-traded derivatives: 1. The management of counter-party (credit) risk is decentralized and located within individual institutions, 2. There are no formal centralized limits on individual positions, leverage, or margining, 3. There are no formal rules for risk and burden-sharing, 4. There are no formal rules or mechanisms for ensuring market stability and integrity, and for safeguarding the collective interests of market participants, and 5. The OTC contracts are generally not regulated by a regulatory authority and the exchange’s selfregulatory organization, although they are affected indirectly by national legal systems, banking supervision and market surveillance.
Some of the features of OTC derivatives markets embody risks to financial market stability. The following features of OTC derivatives markets can give rise to instability in institutions, markets, and the international financial system: (i) the dynamic nature of gross credit exposures; (ii) information asymmetries; (iii) the effects of OTC derivative activities on available aggregate credit; (iv) the high concentration of OTC derivative activities in major institutions; and (v) the central role of OTC derivatives markets in the global financial system. Instability arises when shocks, such as counter-party credit events and sharp movements in asset prices that underlie derivative contracts occur, which significantly alter the perceptions of current and potential future credit exposures. When asset prices change rapidly, the size and configuration of counter-party exposures can become unsustainably large and provoke a rapid unwinding of positions. There has been some progress in addressing these risks and perceptions. However, the progress has been limited in implementing reforms in risk management, including counterparty, liquidity and operational risks, and OTC derivatives markets continue to pose a threat to
1.7 Derivatives market in India
13
international financial stability. The problem is more acute as heavy reliance on OTC derivatives creates the possibility of systemic financial events, which fall outside the more formal clearing house structures. Moreover, those who provide OTC derivative products, hedge their risks through the use of exchange traded derivatives. In view of the inherent risks associated with OTC derivatives, and their dependence on exchange traded derivatives, Indian law considers them illegal.
1.7 1.7.1
Derivatives market in India Approval for derivatives trading
The first step towards introduction of derivatives trading in India was the promulgation of the Securities Laws(Amendment) Ordinance, 1995, which withdrew the prohibition on options in securities. The market for derivatives, however, did not take off, as there was no regulatory framework to govern trading of derivatives. SEBI set up a 24–member committee under the Chairmanship of Dr.L.C.Gupta on November 18, 1996 to develop appropriate regulatory framework for derivatives trading in India. The committee submitted its report on March 17, 1998 prescribing necessary pre–conditions for introduction of derivatives trading in India. The committee recommended that derivatives should be declared as ‘securities’ so that regulatory framework applicable to trading of ‘securities’ could also govern trading of securities. SEBI also set up a group in June 1998 under the Chairmanship of Prof.J.R.Varma, to recommend measures for risk containment in derivatives market in India. The report, which was submitted in October 1998, worked out the operational details of margining system, methodology for charging initial margins, broker net worth, deposit requirement and real–time monitoring requirements. The SCRA was amended in December 1999 to include derivatives within the ambit of ‘securities’ and the regulatory framework was developed for governing derivatives trading. The act also made it clear that derivatives shall be legal and valid only if such contracts are traded on a recognized stock exchange, thus precluding OTC derivatives. The government also rescinded in March 2000, the three–decade old notification, which prohibited forward trading in securities. Derivatives trading commenced in India in June 2000 after SEBI granted the final approval to this effect in May 2000. SEBI permitted the derivative segments of two stock exchanges, NSE and BSE, and their clearing house/corporation to commence trading and settlement in approved derivatives contracts. To begin with, SEBI approved trading in index futures contracts based on S&P CNX Nifty and BSE–30(Sensex) index. This was followed by approval for trading in options based on these two indexes and options on individual securities. The trading in index options commenced in June 2001 and the trading in options on individual securities commenced in July 2001. Futures contracts on individual stocks were launched in November 2001. Trading and settlement in derivative contracts is done in accordance with the rules, byelaws, and regulations of the respective exchanges and their clearing house/corporation duly approved by SEBI and notified in the official gazette.
14
Introduction to derivatives
1.7.2
Derivatives market at NSE
The derivatives trading on the exchange commenced with S&P CNX Nifty Index futures on June 12, 2000. The trading in index options commenced on June 4, 2001 and trading in options on individual securities commenced on July 2, 2001. Single stock futures were launched on November 9, 2001. The index futures and options contract on NSE are based on S&P CNX Nifty Index. Currently, the futures contracts have a maximum of 3-month expiration cycles. Three contracts are available for trading, with 1 month, 2 months and 3 months expiry. A new contract is introduced on the next trading day following the expiry of the near month contract.
1.7.3
Trading mechanism
The futures and options trading system of NSE, called NEAT-F&O trading system, provides a fully automated screen–based trading for Nifty futures & options and stock futures & options on a nationwide basis and an online monitoring and surveillance mechanism. It supports an anonymous order driven market which provides complete transparency of trading operations and operates on strict price–time priority. It is similar to that of trading of equities in the Cash Market(CM) segment. The NEAT-F&O trading system is accessed by two types of users. The Trading Members(TM) have access to functions such as order entry, order matching, order and trade management. It provides tremendous flexibility to users in terms of kinds of orders that can be placed on the system. Various conditions like Good-till-Day, Good-till-Cancelled, Goodtill-Date, Immediate or Cancel, Limit/Market price, Stop loss, etc. can be built into an order. The Clearing Members(CM) use the trader workstation for the purpose of monitoring the trading member(s) for whom they clear the trades. Additionally, they can enter and set limits to positions, which a trading member can take.
1.7.4
Membership criteria
NSE admits members on its derivatives segment in accordance with the rules and regulations of the exchange and the norms specified by SEBI. NSE follows 2–tier membership structure stipulated by SEBI to enable wider participation. Those interested in taking membership on F&O segment are required to take membership of CM and F&O segment or CM, WDM and F&O segment. Trading and clearing members are admitted separately. Essentially, a clearing member(CM) does clearing for all his trading members(TMs), undertakes risk management and performs actual settlement. There are three types of CMs: Self Clearing Member: A SCM clears and settles trades executed by him only either on his own account or on account of his clients. Trading Member Clearing Member: TM–CM is a CM who is also a TM. TM–CM may clear and settle his own proprietary trades and client’s trades as well as clear and settle for other TMs. Professional Clearing Member PCM is a CM who is not a TM. Typically, banks or custodians could become a PCM and clear and settle for TMs.
1.7 Derivatives market in India
15
Table 1.3 Business growth of futures and options market: Turnover(Rs.crore) Month
Index futures
Stock futures
Index options
Stock options
Total
Jun-00 Jul-00 Aug-00 Sep-00 Oct-00 Nov-00 Dec-00 Jan-01 Feb-01 Mar-01 Apr-01 May-01 Jun-01 Jul-01 Aug-01 Sep-01 Oct-01 Nov-01 Dec-01 Jan-02 Feb-02 Mar-02
35 108 90 119 153 247 237 471 524 381 292 230 590 1309 1305 2857 2485 2484 2339 2660 2747 2185
2811 7515 13261 13939 13989
196 326 284 559 559 455 405 338 430 360
396 1107 2012 2433 3010 2660 5089 4499 3957
35 108 90 119 153 247 237 471 524 381 292 230 785 2031 2696 5281 5477 8760 12919 21348 21616 20490
2001-02
21482
51516
3766
25163
101925
Details of the eligibility criteria for membership on the F&O segment are provided in Tables 12.1 and 12.2(Chapter 12). The TM–CM and the PCM are required to bring in additional security deposit in respect of every TM whose trades they undertake to clear and settle. Besides this, trading members are required to have qualified users and sales persons, who have passed a certification programme approved by SEBI.
1.7.5
Turnover
The trading volumes on NSE’s derivatives market has seen a steady increase since the launch of the first derivatives contract, i.e. index futures in June 2000. Table 1.3 gives the value of contracts traded on the NSE from the inception of the market to March 2002. The average daily turnover at NSE now exceeds a 1000 crore. A total of 41,96,873 contracts with a total turnover of Rs.1,01,926 crore was traded during 2001-2002.
16
Introduction to derivatives
1.7.6
Clearing and settlement
NSCCL undertakes clearing and settlement of all deals executed on the NSEs F&O segment. It acts as legal counterparty to all deals on the F&O segment and guarantees settlement. We take a brief look at the clearing and settlement mechanism. Clearing The first step in clearing process is working out open positions or obligations of members. A CM’s open position is arrived at by aggregating the open position of all the TMs and all custodial participants clearing through him, in the contracts in which they have traded. A TM’s open position is arrived at as the summation of his proprietary open position and clients open positions, in the contracts in which they have traded. While entering orders on the trading system, TMs are required to identify the orders, whether proprietary (if they are their own trades) or client (if entered on behalf of clients). Proprietary positions are calculated on net basis (buy-sell) for each contract. Clients’ positions are arrived at by summing together net (buy-sell) positions of each individual client for each contract. A TMs open position is the sum of proprietary open position, client open long position and client open short position. Settlement All futures and options contracts are cash settled, i.e. through exchange of cash. The underlying for index futures/options of the Nifty index cannot be delivered. These contracts, therefore, have to be settled in cash. Futures and options on individual securities can be delivered as in the spot market. However, it has been currently mandated that stock options and futures would also be cash settled. The settlement amount for a CM is netted across all their TMs/clients in respect of MTM, premium and final exercise settlement. For the purpose of settlement, all CMs are required to open a separate bank account with NSCCL designated clearing banks for F&O segment.
1.7.7
Risk management system
The salient features of risk containment measures on the F&O segment are: Anybody interested in taking membership of F&O segment is required to take membership of“CM and F&O”or “CM,WDM and F&O”. An existing member of CM segment can also take membership of F&O segment. The details of the eligibility criteria for membership of F&O segment are given in the chapter on regulations in this book. NSCCL charges an upfront initial margin for all the open positions of a CM upto client level. It follows the VaR based margining system through SPAN system. NSCCL computes the initial margin percentage for each Nifty index futures contract on a daily basis and informs the CMs. The CM in turn collects the initial margin from the TMs and their respective clients. NSCCL’s on-line position monitoring system monitors a CM’s open positions on a real-time basis. Limits are set for each CM based on his base capital and additional capital deposited with NSCCL. The on-line position monitoring system generates alerts whenever a CM reaches a position limit
1.7 Derivatives market in India
17
set up by NSCCL. NSCCL monitors the CMs and TMs for mark to market value violation and for contract-wise position limit violation. CMs are provided with a trading terminal for the purpose of monitoring the open positions of all the TMs clearing and settling through them. A CM may set exposure limits for a TM clearing and settling through him. NSCCL assists the CM to monitor the intra-day exposure limits set up by a CM and whenever a TM exceeds the limits, it withdraws the trading facility provided to such TM. A separate Settlement Guarantee Fund for this segment has been created out of the capital deposited by the members with NSCCL.
Solved Problems Q: Futures trading commenced fi rst on 1. Chicago Board of Trade
3. Chicago Board Options Exchange
2. Chicago Mercantile Exchange
4. London International Financial Futures and Options Exchange
A: The correct answer is number 1. Q: The underlying asset for a derivative contract can be 1. Equity
3. Interest rate
2. Commodities
4. Any of the above
A: The correct answer is number 4 Q: Derivatives fi rst emerged as
products
1. Speculative
3. Volatility
2. Hedging
4. Risky
A: The correct answer is number 2. Q: Who are the participants in the derivatives market? 1. Hedgers
3. Arbitrageurs
2. Speculators
4. All of the above
A: The correct answer is number 4.
18
Introduction to derivatives
Q: The fi rst market to trade fi nancial futures was the 1. CBOT
3. CBOE
2. CME
4. NYSE
A: The correct answer is number 2. Q: Which of the following exchanges offer derivatives trading 1. National Stock Exchange
3. Over The Counter Exchange of India
2. Interconnected Stock Exchange
4. ICICI Securities Limited
A: The correct answer is number 1. Q: The fi rst exchange traded fi nancial derivative in India commenced with the trading of 1. Index futures
3. Stock options
2. Index options
4. Interest rate futures
A: The correct answer is number 1. Q: OTC derivatives are considered risky because 1. There is no formal margining system.
3. They are not settled on a clearing house.
2. They do not follow any formal rules or mechanisms.
4. All of the above
A: The correct answer is number 4. Q: Which of the following does not trade on the NSE’s Futures and Options segment? 1. Index options
3. Currency futures
2. Stock options
4. Index futures
A: The correct answer is number 3. Q: Which of the following is not an example of a derivative on security derivative? 1. Index futures
3. Stock futures
2. Index options
4. Interest rate futures
A: The correct answer is number 4.
Chapter 2 Market index To understand the use and functioning of the index derivatives markets, it is necessary to understand the underlying index. In the following section, we take a look at index related issues. Traditionally, indexes have been used as information sources. By looking at an index, we know how the market is faring. In recent years, indexes have come to the forefront owing to direct applications in finance in the form of index funds and index derivatives. Index derivatives allow people to cheaply alter their risk exposure to an index (hedging) and to implement forecasts about index movements (speculation). Hedging using index derivatives has become a central part of risk management in the modern economy.
2.1
Understanding the index number
An index is a number which measures the change in a set of values over a period of time. A stock index represents the change in value of a set of stocks which constitute the index. More specifically, a stock index number is the current relative value of a weighted average of the prices of a pre-defined group of equities. It is a relative value because it is expressed relative to the weighted average of prices at some arbitrarily chosen starting date or base period. The starting value or base of the index is usually set to a number such as 100 or 1000. For example, the base value of the Nifty was set to 1000 on the start date of November 3, 1995. A good stock market index is one which captures the behavior of the overall equity market. It should represent the market, it should be well diversified and yet highly liquid. Movements of the index should represent the returns obtained by “typical” portfolios in the country. A market index is very important for its use 1. as a barometer for market behavior, 2. as a benchmark portfolio performance, 3. as an underlying in derivative instruments like index futures, and 4. in passive fund management by index funds
20
Market index
2.2
Economic significance of index movements
How do we interpret index movements? What do these movements mean? They reflect the changing expectations of the stock market about future dividends of the corporate sector. The index goes up if the stock market thinks that the prospective dividends in the future will be better than previously thought. When the prospects of dividends in the future becomes pessimistic, the index drops. The ideal index gives us instant readings about how the stock market perceives the future of corporate sector. Every stock price moves for two possible reasons: 1. News about the company (e.g. a product launch, or the closure of a factory) 2. News about the country (e.g. nuclear bombs, or a budget announcement)
The job of an index is to purely capture the second part, the movements of the stock market as a whole (i.e. news about the country). This is achieved by averaging. Each stock contains a mixture of two elements - stock news and index news. When we take an average of returns on many stocks, the individual stock news tends to cancel out and the only thing left is news that is common to all stocks. The news that is common to all stocks is news about the economy. That is what a good index captures. The correct method of averaging is that of taking a weighted average, giving each stock a weight proportional to its market capitalization. Example: Suppose an index contains two stocks, A and B. A has a market capitalization of Rs.1000 crore and B has a market capitalization of Rs.3000 crore. Then we attach a weight of 1/4 to movements in A and 3/4 to movements in B.
2.3
Index construction
A good index is a trade-off between diversification and liquidity. A well diversified index is more representative of the market/economy. However there are diminishing returns to diversification. Going from 10 stocks to 20 stocks gives a sharp reduction in risk. Going from 50 stocks to 100 stocks gives very little reduction in risk. Going beyond 100 stocks gives almost zero reduction in risk. Hence, there is little to gain by diversifying beyond a point. The more serious problem lies in the stocks that we take into an index when it is broadened. If the stock is illiquid, the observed prices yield contaminated information and actually worsen an index.
2.4
Types of indexes
Most of the commonly followed stock market indexes are of the following two types: Market capitalization weighted index or price weighted index. In a market capitalization weighted index, each stock in the index affects the index value in proportion to the market value of all shares outstanding. A price weighted index is one that gives a weight to each stock that is proportional to its stock price. Indexes can also be equally weighted. Recently, major indices in the world like the S&P 500 and the FTSE-100 have shifted to a new method of index calculation called the “Free float” method. We take a look at a few methods of index calculation.
2.4 Types of indexes
21
Table 2.1 Price weighted index calculation In the example below we can see that Grasim Inds and Telco have a similar weightage irrespective of the number of outstanding shares. In a price weighted index, a small capitalization fi rm could have a much higher weightage than a much larger fi rm if the small capitalization fi rm had a high stock price but relatively few outstanding shares. In the present example the base index = 1000 and the index value works out to be 1049.56. �
Index
Company
�
�
�
�
�
�
�
�
�
�
�
�
�
�
�
�
�
�
�
�
�
�
�
�
�
Share price at time 0 (Rs.)
Share price at time 1 (Rs.)
Grasim Inds Telco SBI Wipro Bajaj
351.55 329.10 274.60 1335.25 539.25
340.50 350.30 280.40 1428.75 570.25
Total
2829.75
2970.20
1. Price weighted index: In a price weighted index each stock is given a weight proportional to its stock price. Table 2.1 gives an example of how a price weighted index is calculated. 2. Equally weighted index: As the name suggests, in an equally weighted index all the components have similar weightage irrespective of their price or their market capitalization. Table 2.2 gives an example of how an equally weighted index is calculated. 3. Market capitalization weighted index: In this type of index, the equity price is weighted by the market capitalization of the company (share price * number of outstanding shares). Hence each constituent stock in the index affects the index value in proportion to the market value of all the outstanding shares. Table 2.3 gives an example of how market capitalization weighted index is calculated. In the market capitalization weighted method,
Index �
Current market capitalisation Base market capitalisation �
Base value
where : Current market capitalization = Sum of (current market price * outstanding shares) of all securities in the index. Base market capitalization= Sum of (market price * issue size) of all securities as on base date.
22
Market index
Table 2.2 Equally weighted index calculation In the example below we can see that Grasim Inds and Wipro have a similar weightage irrespective of their share price and number of outstanding shares. In the present example the base index = 1000 and the index value works out to be 1036.21 �
�
�
Index
�
�
�
� �
�
�
�
�
�
�
�
�
�
�
�
�
�
�
�
�
�
�
�
�
�
�
�
�
�
�
�
�
�
�
�
�
�
�
�
�
�
�
�
�
�
�
�
�
!
"
$
�
� �
Company
Share price at Time 0 (Rs.)
Share price at Time 1 (Rs.)
Grasim Inds Telco SBI Wipro Bajaj
351.75 329.10 274.60 1335.25 539.25
340.50 350.30 280.40 1428.75 570.25
Total
2829.75
2970.20
Table 2.3 Market capitalization weighted index calculation In the example below we can see that each stock affects the index value in proportion to the market value of all the outstanding shares. In the present example, the base index = 1000 and the index value works out to be 1002.60 �
Index
'
'
�
2.5
�
�
�
�
�
�
�
'
'
�
Company
�
�
'
�
�
�
�
�
�
�
�
�
�
�
�
�
�
�
Current Market capitalization (Rs.Lakh)
Base Market capitalization (Rs.Lakh)
Grasim Inds Telco SBI Wipro Bajaj
1,668,791.10 872,686.30 1,452,587.65 2,675,613.30 660,887.85
1,654,247.50 860,018.25 1,465,218.80 2,669,339.55 662,559.30
Total
7,330,566.20
7,311,383.40
Desirable attributes of an index
A good market index should have three attributes:
2.6 The S&P CNX Nifty
23
1. It should capture the behavior of a large variety of different portfolios in the market. 2. The stocks included in the index should be highly liquid. 3. It should be professionally maintained.
2.5.1
Capturing behavior of portfolios
A good market index should accurately reflect the behavior of the overall market as well as of different portfolios. This is achieved by diversification in such a manner that a portfolio is not vulnerable to any individual stock or industry risk. A well–diversified index is more representative of the market. However there are diminishing returns from diversification. There is very little gain by diversifying beyond a point. The more serious problem lies in the stocks that are included in the index when it is diversified. We end up including illiquid stocks, which actually worsens the index. Since an illiquid stock does not reflect the current price behavior of the market, its inclusion in index results in an index, which reflects, delayed or stale price behavior rather than current price behavior of the market.
2.5.2
Including liquid stocks
Liquidity is much more than trading frequency. It is about ability to transact at a price, which is very close to the current market price. For example, a stock is considered liquid if one can buy some shares at around Rs.320.05 and sell at around Rs. 319.95, when the market price is ruling at Rs.320. A liquid stock has very tight bid–ask spread.
2.5.3
Maintaining professionally
It is now clear that an index should contain as many stocks with as little impact cost as possible. This necessarily means that the same set of stocks would not satisfy these criteria at all times. A good index methodology must therefore incorporate a steady pace of change in the index set. It is crucial that such changes are made at a steady pace. It is very healthy to make a few changes every year, each of which is small and does not dramatically alter the character of the index. On a regular basis, the index set should be reviewed, and brought in line with the current state of market. To meet the application needs of users, a time series of the index should be available.
2.6
The S&P CNX Nifty
What makes a good stock market index for use in an index futures and index options market? Several issues play a role in terms of the choice of index. We will discuss how the S&P CNX Nifty addresses some of these issues. Diversification As mentioned earlier, a stock market index should be well–diversifi ed, thus ensuring that hedgers or speculators are not vulnerable to individual–company or industry risk.
24
Market index
The S&P CNX Nifty is an index based upon solid economic research. It was designed not only as a barometer of market movement but also to be a foundation of the new world of fi nancial products based on the index like index futures, index options and index funds. A trillion calculations were expended to evolve the rules inside the S&P CNX Nifty index. The results of this work are remarkably simple: (a) the correct size to use is 50, (b) stocks considered for the S&P CNX Nifty must be liquid by the ‘impact cost’ criterion, (c) the largest 50 stocks that meet the criterion go into the index. S&P CNX Nifty is a contrast to the adhoc methods that have gone into index construction in the preceding years, where indexes were made out of intuition and lacked a scientifi c basis. The research that led up to S&P CNX Nifty is well-respected internationally as a pioneering effort in better understanding how to make a stock market index. The Nifty is uniquely equipped as an index for the index derivatives market owing to its (a) low market impact cost and (b) high hedging effectiveness. The good diversifi cation of Nifty generates low initial margin requirement. Finally, Nifty is calculated using NSE prices, the most liquid exchange in India, thus making it easier to do arbitrage for index derivatives.
Box 2.3: The S&P CNX Nifty
Liquidity of the index The index should be easy to trade on the cash market. This is partly related to the choice of stocks in the index. High liquidity of index components implies that the information in the index is less noisy. Operational issues The index should be professionally maintained, with a steady evolution of securities in the index to keep pace with changes in the economy. The calculations involved in the index should be accurate and reliable. When a stock trades at multiple venues, index computation should be done using prices from the most liquid market.
2.6.1
Impact cost
Market impact cost is a measure of the liquidity of the market. It reflects the costs faced when actually trading an index. For a stock to qualify for possible inclusion into the Nifty, it has to have market impact cost of below 1.5% when doing Nifty trades of half a crore rupees. The market impact cost on a trade of Rs.3 million of the full Nifty works out to be about 0.2%. This means that if Nifty is at 1000, a buy order goes through at 1002, i.e.1000+(1000*0.002) and a sell order gets 998, i.e. 1000-(1000*0.002).
2.6.2
Hedging effectiveness
Hedging effectiveness is a measure of the extent to which an index correlates with a portfolio, whatever the portfolio may be. Nifty correlates better with all kinds of portfolios in India as compared to other indexes. This holds good for all kinds of portfolios, not just those that contain index stocks. Nifty is owned, computed and maintained by India Index Services & Products Limited (IISL), a company setup by NSE and CRISIL with technical assistance from Standard & Poor’s.
2.7 Applications of index
25
Figure 2.1 S&P CNX Nifty - The futures index
2.7
Applications of index
Besides serving as a barometer of the economy/market, the index also has other applications in finance.
2.7.1
Index derivatives
Index derivatives are derivative contracts which have the index as the underlying. The most popular index derivatives contracts the world over are index futures and index options. NSE’s market index, the S&P CNX Nifty was scientifically designed to enable the launch of index– based products like index derivatives and index funds. The first derivative contract to be traded on NSE’s market was the index futures contract with the Nifty as the underlying. This was followed by index options.
2.7.2
Index funds
An index fund is a fund that tries to replicate the index returns. It does so by investing in index stocks in the proportions in which these stocks exist in the index. The goal of the index fund is to achieve the same performance as the index it tracks. For instance, a Nifty index fund would seek to get the same return as the Nifty index. Since the Nifty has 50 stocks, the fund would buy all 50 stocks in the proportion in which they exist in the Nifty. Once invested, the fund will track the index, i.e. if the Nifty goes up, the value of the fund will go up to the same extent as the Nifty. If the Nifty falls, the value of the index fund will
26
Market index
Futures markets can be used for creating synthetic index funds. Synthetic index funds created using futures contracts have advantages of simplicity and low costs. The simplicity stems from the fact that index futures automatically track the index. The cost advantages stem from the fact that the costs of establishing and re-balancing the fund are substantially reduced because commissions and bid-ask spreads are lower in the futures markets than in the equity markets. The methodology for creating a synthetic index fund is to combine index futures contracts with bank deposits or treasury bills. The index fund uses part of its money as margin on the futures market and the rest is invested at the risk-free rate of return. This methodology however does require frequent roll-over as futures contracts expire. Index funds can also use the futures market for the purpose of spreading index sales or purchases over a period of time. Take the case of an index fund which has raised Rs.100 crore from the market. To reduce the tracking error, this money must be invested in the index immediately. However large trades face large impact costs. What the fund can do is, the moment it receives the subscriptions it can buy index futures. Then gradually over a period of say a month, it can keep acquiring the underlying index stocks. As it acquires the index stocks, it should unwind its position on the futures market by selling futures to the extent of stock acquired. This should continue till the fund is fully invested in the index.
Box 2.4: Use of futures market by index funds
fall to the same extent as the Nifty. The most useful kind of market index is one where the weight attached to a stock is proportional to its market capitalization, as in the case of Nifty. Index funds are easy to construct for this kind of index since the index fund does not need to trade in response to price fluctuations. Trading is only required in response to issuance of shares, mergers, etc. A few index funds were launched in the recent past to provide a return at par with the index. For example, UTI launched in February 2000 an open ended Nifty Index Fund, which invests in the fifty Nifty stocks in the same weightage as they have in the Nifty with an objective to track the index with minimum error. Other Nifty based funds include Franklin India Index Fund, Franklin India Tax Fund, IDBI Principal Index Fund, IL&FS Index Fund, Prudential ICICI Index fund, Pioneer ITI P/E Ratio Fund, SBI Magnum Index fund. The passive investment approach seems to be catching the fancy of investors.
2.7.3
Exchange Traded Funds
Exchange Traded Funds(ETFs) are innovative products, which first came into existence in the USA in 1993. They have gained prominence over the last few years with over $100 billion invested as of end 2001 in about 200 ETFs globally. About 60% of trading volumes on the American stock exchanges are from ETFs. Among the popular ones are SPDRs(Spiders) based on the S&P 500 Index, QQQs(Cubes) based on the Nasdaq-100 Index, iSHARES based on MSCI Indices and TRAHK(Tracks) based on the Hang Seng Index. ETFs provide exposure to an index or a basket of securities that trade on the exchange like a single stock. They have a number of advantages over traditional open–ended funds as they can be bought and sold on the exchange at prices that are usually close to the actual intra–day NAV of the scheme. They are an innovation to traditional mutual funds as they provide investors a
2.7 Applications of index
27
fund that closely tracks the performance of an index with the ability to buy/sell on an intra–day basis. Unlike listed closed–ended funds, which trade at substantial premia or more frequently at discounts to NAV, ETFs are structured in a manner which allows to create new units and redeem outstanding units directly with the fund, thereby ensuring that ETFs trade close to their actual NAVs. The first ETF in India, “Nifty BeEs”(Nifty Benchmark Exchange Traded Scheme) based on S&P CNX Nifty, was launched in December 2001 by Benchmark Mutual Fund. It is bought and sold like any other stock on NSE and has all characteristics of an index fund. It would provide returns that closely correspond to the total return of stocks included in Nifty.
Solved problems Q: Nifty includes the
most liquid stocks that trade on NSE.
1. 30
3. 100
2. 50
4. 500
A: The correct answer is number 2. Q: The Indian company which provides professional index management services is 1. IISL
3. S&P
2. NSCCL
4. CRISIL
A: The correct answer is number 1. Q: Impact cost measures the 1. Volatility of the stock
3. Return on a stock
2. Liquidity of the stock
4. None of above
A: The correct answer is number 2. Q: Assume that the base value of a market capitalization weighted index were 1000 and the base market capitalization were Rs.35000 crore. If the current market capitalization is Rs.42,000 crore, the index is at 1. 1200
3. 1110
2. 1250
4. 1350
A: The current index value is (42000/35000)*1000. The correct answer is number 1.
28
Market index
Q: The impact cost on a trade of Rs.3 million of the full Nifty works out to be about 0.2%. This means that if Nifty is at 1000, a buy order will go through at roughly 1. 1002
3. 1200
2. 1020
4. None of the above
A: 0.2% of 1000 works out to be 2. Hence a buy order will go through at 1002. The correct answer is number 1.
Q: The market impact cost on a trade of Rs.3 million of the full Nifty works out to be about 0.3%. This means that if Nifty is at 1000, a sell order will go through at roughly 1. 997
3. 979
2. 1003
4. None of the above
A: 0.3% of 1000 works out to be 3. Hence a sell order will go through at 997. The correct answer is number 1.
Q: The S&P CNX Nifty, which is the index underlying futures and options contracts that trade on the NSE, is maintained by 1. NSE
3. CRICIL
2. S&P 500
4. IISL
A: The correct answer is number 4 Q: Index funds are
managed
1. Actively
3. Family
2. Passively
4. None of the above
A: The correct answer is number 2. Q: Which of the following is not an index based product? 1. Index funds
3. Index futures
2. Exchange traded funds
4. Stock futures
A: The correct answer is number 4.
Chapter 3 Introduction to futures and options In recent years, derivatives have become increasingly important in the field of finance. While futures and options are now actively traded on many exchanges, forward contracts are popular on the OTC market. In this chapter we shall study in detail these three derivative contracts.
3.1
Forward contracts
A forward contract is an agreement to buy or sell an asset on a specified date for a specified price. One of the parties to the contract assumes a long position and agrees to buy the underlying asset on a certain specified future date for a certain specified price. The other party assumes a short position and agrees to sell the asset on the same date for the same price. Other contract details like delivery date, price and quantity are negotiated bilaterally by the parties to the contract. The forward contracts are normally traded outside the exchanges. The salient features of forward contracts are: They are bilateral contracts and hence exposed to counter–party risk. Each contract is custom designed, and hence is unique in terms of contract size, expiration date and the asset type and quality. The contract price is generally not available in public domain. On the expiration date, the contract has to be settled by delivery of the asset. If the party wishes to reverse the contract, it has to compulsorily go to the same counterparty, which often results in high prices being charged.
However forward contracts in certain markets have become very standardized, as in the case of foreign exchange, thereby reducing transaction costs and increasing transactions volume. This process of standardization reaches its limit in the organized futures market. Forward contracts are very useful in hedging and speculation. The classic hedging application would be that of an exporter who expects to receive payment in dollars three months later. He is exposed to the risk of exchange rate fluctuations. By using the currency forward market to sell
30
Introduction to futures and options
dollars forward, he can lock on to a rate today and reduce his uncertainty. Similarly an importer who is required to make a payment in dollars two months hence can reduce his exposure to exchange rate fluctuations by buying dollars forward. If a speculator has information or analysis, which forecasts an upturn in a price, then he can go long on the forward market instead of the cash market. The speculator would go long on the forward, wait for the price to rise, and then take a reversing transaction to book profits. Speculators may well be required to deposit a margin upfront. However, this is generally a relatively small proportion of the value of the assets underlying the forward contract. The use of forward markets here supplies leverage to the speculator.
3.2
Limitations of forward markets
Forward markets world-wide are afflicted by several problems: Lack of centralization of trading, Illiquidity, and Counterparty risk
In the first two of these, the basic problem is that of too much flexibility and generality. The forward market is like a real estate market in that any two consenting adults can form contracts against each other. This often makes them design terms of the deal which are very convenient in that specific situation, but makes the contracts non-tradable. Counterparty risk arises from the possibility of default by any one party to the transaction. When one of the two sides to the transaction declares bankruptcy, the other suffers. Even when forward markets trade standardized contracts, and hence avoid the problem of illiquidity, still the counterparty risk remains a very serious issue.
3.3
Introduction to futures
Futures markets were designed to solve the problems that exist in forward markets. A futures contract is an agreement between two parties to buy or sell an asset at a certain time in the future at a certain price. But unlike forward contracts, the futures contracts are standardized and exchange traded. To facilitate liquidity in the futures contracts, the exchange specifies certain standard features of the contract. It is a standardized contract with standard underlying instrument, a standard quantity and quality of the underlying instrument that can be delivered,(or which can be used for reference purposes in settlement) and a standard timing of such settlement. A futures contract may be offset prior to maturity by entering into an equal and opposite transaction. More than 99% of futures transactions are offset this way. The standardized items in a futures contract are: Quantity of the underlying Quality of the underlying
3.4 Distinction between futures and forwards contracts
31
Merton Miller, the 1990 Nobel laureate had said that “fi nancial futures represent the most signifi cant fi nancial innovation of the last twenty years.” The fi rst exchange that traded fi nancial derivatives was launched in Chicago in the year 1972. A division of the Chicago Mercantile Exchange, it was called the International Monetary Market(IMM) and traded currency futures. The brain behind this was a man called Leo Melamed, acknowledged as the “father of fi nancial futures” who was then the Chairman of the Chicago Mercantile Exchange. Before IMM opened in 1972, the Chicago Mercantile Exchange sold contracts whose value was counted in millions. By 1990, the underlying value of all contracts traded at the Chicago Mercantile Exchange totaled 50 trillion dollars. These currency futures paved the way for the successful marketing of a dizzying array of similar products at the Chicago Mercantile Exchange, the Chicago Board of Trade, and the Chicago Board Options Exchange. By the 1990s, these exchanges were trading futures and options on everything from Asian and American stock indexes to interest–rate swaps, and their success transformed Chicago almost overnight into the risk–transfer capital of the world.
Box 3.5: The first financial futures market Table 3.1 Distinction between futures and forwards Futures
Forwards
Trade on an organized exchange Standardized contract terms hence more liquid Requires margin payments Follows daily settlement
OTC in nature Customised contract terms hence less liquid No margin payment Settlement happens at end of period
The date and the month of delivery The units of price quotation and minimum price change Location of settlement
3.4
Distinction between futures and forwards contracts
Forward contracts are often confused with futures contracts. The confusion is primarily because both serve essentially the same economic functions of allocating risk in the presence of future price uncertainty. However futures are a significant improvement over the forward contracts as they eliminate counterparty risk and offer more liquidity. Table 3.1 lists the distinction between the two.
3.5
Futures terminology Spot price: The price at which an asset trades in the spot market. Futures price: The price at which the futures contract trades in the futures market.
32
Introduction to futures and options Contract cycle: The period over which a contract trades. The index futures contracts on the NSE have one-month, two-months and three-months expiry cycles which expire on the last Thursday of the month. Thus a January expiration contract expires on the last Thursday of January and a February expiration contract ceases trading on the last Thursday of February. On the Friday following the last Thursday, a new contract having a three-month expiry is introduced for trading. Expiry date: It is the date specifi ed in the futures contract. This is the last day on which the contract will be traded, at the end of which it will cease to exist. Contract size: The amount of asset that has to be delivered under one contract. For instance, the contract size on NSE’s futures market is 200 Nifties. Basis: In the context of fi nancial futures, basis can be defi ned as the futures price minus the spot price. There will be a different basis for each delivery month for each contract. In a normal market, basis will be positive. This reflects that futures prices normally exceed spot prices. Cost of carry: The relationship between futures prices and spot prices can be summarized in terms of what is known as the cost of carry. This measures the storage cost plus the interest that is paid to fi nance the asset less the income earned on the asset. Initial margin: The amount that must be deposited in the margin account at the time a futures contract is fi rst entered into is known as initial margin. Marking-to-market: In the futures market, at the end of each trading day, the margin account is adjusted to reflect the investor’s gain or loss depending upon the futures closing price. This is called marking–to–market. Maintenance margin: This is somewhat lower than the initial margin. This is set to ensure that the balance in the margin account never becomes negative. If the balance in the margin account falls below the maintenance margin, the investor receives a margin call and is expected to top up the margin account to the initial margin level before trading commences on the next day.
3.6
Introduction to options
In this section, we look at the next derivative product to be traded on the NSE, namely options. Options are fundamentally different from forward and futures contracts. An option gives the holder of the option the right to do something. The holder does not have to exercise this right. In contrast, in a forward or futures contract, the two parties have committed themselves to doing something. Whereas it costs nothing(except margin requirements) to enter into a futures contract, the purchase of an option requires an up–front payment.
3.7
Option terminology Index options: These options have the index as the underlying. Some options are European while others are American. Like index futures contracts, index options contracts are also cash settled.
3.7 Option terminology
33
Although options have existed for a long time, they were traded OTC, without much knowledge of valuation. The fi rst trading in options began in Europe and the US as early as the seventeenth century. It was only in the early 1900s that a group of fi rms set up what was known as the put and call Brokers and Dealers Association with the aim of providing a mechanism for bringing buyers and sellers together. If someone wanted to buy an option, he or she would contact one of the member fi rms. The fi rm would then attempt to fi nd a seller or writer of the option either from its own clients or those of other member fi rms. If no seller could be found, the fi rm would undertake to write the option itself in return for a price. This market however suffered from two defi ciencies. First, there was no secondary market and second, there was no mechanism to guarantee that the writer of the option would honor the contract. In 1973, Black, Merton and Scholes invented the famed Black-Scholes formula. In April 1973, CBOE was set up specifi cally for the purpose of trading options. The market for options developed so rapidly that by early ’80s, the number of shares underlying the option contract sold each day exceeded the daily volume of shares traded on the NYSE. Since then, there has been no looking back.
Box 3.6: History of options
Stock options: Stock options are options on individual stocks. Options currently trade on over 500 stocks in the United States. A contract gives the holder the right to buy or sell shares at the specifi ed price. Buyer of an option: The buyer of an option is the one who by paying the option premium buys the right but not the obligation to exercise his option on the seller/writer. Writer of an option: The writer of a call/put option is the one who receives the option premium and is thereby obliged to sell/buy the asset if the buyer exercises on him.
There are two basic types of options, call options and put options. Call option: A call option gives the holder the right but not the obligation to buy an asset by a certain date for a certain price. Put option: A put option gives the holder the right but not the obligation to sell an asset by a certain date for a certain price. Option price: Option price is the price which the option buyer pays to the option seller. It is also referred to as the option premium. Expiration date: The date specifi ed in the options contract is known as the expiration date, the exercise date, the strike date or the maturity. Strike price: The price specifi ed in the options contract is known as the strike price or the exercise price. American options: American options are options that can be exercised at any time upto the expiration date. Most exchange-traded options are American.
34
Introduction to futures and options European options: European options are options that can be exercised only on the expiration date itself. European options are easier to analyze than American options, and properties of an American option are frequently deduced from those of its European counterpart. In-the-money option: An in-the-money (ITM) option is an option that would lead to a positive cashflow to the holder if it were exercised immediately. A call option on the index is said to be in-the-money when the current index stands at a level higher than the strike price (i.e. spot price strike price). If the index is much higher than the strike price, the call is said to be deep ITM. In the case of a put, the put is ITM if the index is below the strike price. At-the-money option: An at-the-money (ATM) option is an option that would lead to zero cashflow if it were exercised immediately. An option on the index is at-the-money when the current index equals the strike price (i.e. spot price = strike price). Out-of-the-money option: An out-of-the-money (OTM) option is an option that would lead to a negative cashflow it it were exercised immediately. A call option on the index is out-of-the-money when the current index stands at a level which is less than the strike price (i.e. spot price strike price). If the index is much lower than the strike price, the call is said to be deep OTM. In the case of a put, the put is OTM if the index is above the strike price. �
Intrinsic value of an option: The option premium can be broken down into two components - intrinsic value and time value. The intrinsic value of a call is the amount the option is ITM, if it is ITM. If the call is OTM, its intrinsic value is zero. Putting it another way, the intrinsic value of a call is which means the intrinsic value of a call is the greater of 0 or . Similarly, the intrinsic value of a put is ,i.e. the greater of 0 or . K is the strike price and is the spot price. �
�
�
�
�
�
�
�
�
�
�
�
�
�
�
�
�
�
�
�
�
�
�
�
�
�
�
�
�
�
�
Time value of an option: The time value of an option is the difference between its premium and its intrinsic value. Both calls and puts have time value. An option that is OTM or ATM has only time value. Usually, the maximum time value exists when the option is ATM. The longer the time to expiration, the greater is an option’s time value, all else equal. At expiration, an option should have no time value.
3.8
Futures and options
An interesting question to ask at this stage is - when would one use options instead of futures? Options are different from futures in several interesting senses. At a practical level, the option buyer faces an interesting situation. He pays for the option in full at the time it is purchased. After this, he only has an upside. There is no possibility of the options position generating any further losses to him (other than the funds already paid for the option). This is different from futures, which is free to enter into, but can generate very large losses. This characteristic makes options attractive to many occasional market participants, who cannot put in the time to closely monitor their futures positions. Buying put options is buying insurance. To buy a put option on Nifty is to buy insurance which reimburses the full extent to which Nifty drops below the strike price of the put option. This is attractive to many people, and to mutual funds creating “guaranteed return products”.
3.9 Index derivatives
35
Options made their fi rst major mark in fi nancial history during the tulip-bulb mania in seventeenthcentury Holland. It was one of the most spectacular get rich quick binges in history. The fi rst tulip was brought into Holland by a botany professor from Vienna. Over a decade, the tulip became the most popular and expensive item in Dutch gardens. The more popular they became, the more Tulip bulb prices began rising. That was when options came into the picture. They were initially used for hedging. By purchasing a call option on tulip bulbs, a dealer who was committed to a sales contract could be assured of obtaining a fi xed number of bulbs for a set price. Similarly, tulip-bulb growers could assure themselves of selling their bulbs at a set price by purchasing put options. Later, however, options were increasingly used by speculators who found that call options were an effective vehicle for obtaining maximum possible gains on investment. As long as tulip prices continued to skyrocket, a call buyer would realize returns far in excess of those that could be obtained by purchasing tulip bulbs themselves. The writers of the put options also prospered as bulb prices spiralled since writers were able to keep the premiums and the options were never exercised. The tulip-bulb market collapsed in 1636 and a lot of speculators lost huge sums of money. Hardest hit were put writers who were unable to meet their commitments to purchase Tulip bulbs.
Box 3.7: Use of options in the seventeenth-century Table 3.2 Distinction between futures and options Futures Options Exchange traded, with novation Exchange defines the product Price is zero, strike price moves Price is zero Linear payoff Both long and short at risk
Same as futures. Same as futures. Strike price is fixed, price moves. Price is always positive. Nonlinear payoff. Only short at risk.
The Nifty index fund industry will find it very useful to make a bundle of a Nifty index fund and a Nifty put option to create a new kind of a Nifty index fund, which gives the investor protection against extreme drops in Nifty. Selling put options is selling insurance, so anyone who feels like earning revenues by selling insurance can set himself up to do so on the index options market. More generally, options offer “nonlinear payoffs” whereas futures only have “linear payoffs”. By combining futures and options, a wide variety of innovative and useful payoff structures can be created.
3.9
Index derivatives
Index derivatives are derivative contracts which derive their value from an underlying index. The two most popular index derivatives are index futures and index options. Index derivatives have become very popular worldwide. In his report, Dr.L.C.Gupta attributes the popularity of index derivatives to the advantages they offer.
36
Introduction to futures and options Institutional and large equity-holders need portfolio-hedging facility. Index–derivatives are more suited to them and more cost–effective than derivatives based on individual stocks. Pension funds in the US are known to use stock index futures for risk hedging purposes. Index derivatives offer ease of use for hedging any portfolio irrespective of its composition. Stock index is diffi cult to manipulate as compared to individual stock prices, more so in India, and the possibility of cornering is reduced. This is partly because an individual stock has a limited supply, which can be cornered. Stock index, being an average, is much less volatile than individual stock prices. This implies much lower capital adequacy and margin requirements. Index derivatives are cash settled, and hence do not suffer from settlement delays and problems related to bad delivery, forged/fake certifi cates.
The L.C.Gupta committee which was setup for developing a regulatory framework for derivatives trading in India had suggested a phased introduction of derivative products in the following order: 1. Index futures 2. Index options 3. Options on individual stocks
Requirements for an index derivatives market are: 1. Index: The choice of an index is an important factor in determining the extent to which the index derivative can be used for hedging, speculation and arbitrage. A well diversifi ed, liquid index ensures that hedgers and speculators will not be vulnerable to individual or industry risk. 2. Clearing corporation settlement guarantee: The clearing corporation eliminates counterparty risk on futures markets. The clearing corporation interposes itself into every transaction, buying from the seller and selling to the buyer. This insulates a participant from credit risk of another. 3. Strong surveillance mechanism: Derivatives trading brings a whole class of leveraged positions in the economy. Hence the need to have strong surveillance on the market both at the exchange level as well as at the regulator level. 4. Education and certification: The need for education and certifi cation in the derivatives market can never be overemphasized. A critical element of fi nancial sector reforms is the development of a pool of human resources with strong skills and expertise to provide quality intermediation to market participants.
With all the above infrastructure in place, trading of index futures and index options commenced at NSE in June 2000 and June 2001 respectively.
3.10 Payoff for derivatives contracts
37
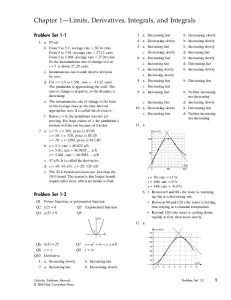
Figure 3.1 Payoff for a buyer of Nifty futures The fi gure shows the profi ts/losses for a long futures position.The investor bought futures when the index was at 1220. If the index goes up, his futures position starts making profi t. If the index falls, his futures position starts showing losses.
Profit
1220 Nifty 0
Loss
3.10
Payoff for derivatives contracts
A payoff is the likely profit/loss that would accrue to a market participant with change in the price of the underlying asset. This is generally depicted in the form of payoff diagrams which show the price of the underlying asset on the X–axis and the profits/losses on the Y–axis. In this section we shall take a look at the payoffs for buyers and sellers of futures and options.
3.11
Payoff for futures
Futures contracts have linear payoffs. In simple words, it means that the losses as well as profits for the buyer and the seller of a futures contract are unlimited. These linear payoffs are fascinating as they can be combined with options and the underlying to generate various complex payoffs.
3.11.1
Payoff for buyer of futures: Long futures
The payoff for a person who buys a futures contract is similar to the payoff for a person who holds an asset. He has a potentially unlimited upside as well as a potentially unlimited downside. Take the case of a speculator who buys a two-month Nifty index futures contract when the Nifty stands at 1220. The underlying asset in this case is the Nifty portfolio. When the index moves up,
38
Introduction to futures and options
Figure 3.2 Payoff for a seller of Nifty futures The fi gure shows the profi ts/losses for a short futures position.The investor sold futures when the index was at 1220. If the index goes down, his futures position starts making profi t. If the index rises, his futures position starts showing losses.
Profit
1220 Nifty 0
Loss
the long futures position starts making profits, and when the index moves down it starts making losses. Figure 3.1 shows the payoff diagram for the buyer of a futures contract.
3.11.2
Payoff for seller of futures: Short futures
The payoff for a person who sells a futures contract is similar to the payoff for a person who shorts an asset. He has a potentially unlimited upside as well as a potentially unlimited downside. Take the case of a speculator who sells a two-month Nifty index futures contract when the Nifty stands at 1220. The underlying asset in this case is the Nifty portfolio. When the index moves down, the short futures position starts making profits, and when the index moves up, it starts making losses. Figure 3.2 shows the payoff diagram for the seller of a futures contract.
3.12
Options payoffs
The optionality characteristic of options results in a non-linear payoff for options. In simple words, it means that the losses for the buyer of an option are limited, however the profits are potentially unlimited. For a writer, the payoff is exactly the opposite. His profits are limited to the option premium, however his losses are potentially unlimited. These non-linear payoffs are fascinating as they lend themselves to be used to generate various payoffs by using combinations of options and the underlying. We look here at the six basic payoffs.
3.12 Options payoffs
39
Figure 3.3 Payoff for investor who went Long Nifty at 1220 The fi gure shows the profi ts/losses from a long position on the index. The investor bought the index at 1220. If the index goes up, he profi ts. If the index falls he looses.
Profit +60
0
1160
1220
1280 Nifty
−60
Loss
Payoff profile of buyer of asset: Long asset In this basic position, an investor buys the underlying asset, Nifty for instance, for 1220, and sells it at a future date at an unknown price, . Once it is purchased, the investor is said to be “long” the asset. Figure 3.3 shows the payoff for a long position on the Nifty. �
Payoff profile for seller of asset: Short asset In this basic position, an investor shorts the underlying asset, Nifty for instance, for 1220, and buys it back at a future date at an unknown price, . Once it is sold, the investor is said to be “short” the asset. Figure 3.4 shows the payoff for a short position on the Nifty. �
3.12.1
Payoff profi le for buyer of call options: Long call
A call option gives the buyer the right to buy the underlying asset at the strike price specified in the option. The profit/loss that the buyer makes on the option depends on the spot price of the underlying. If upon expiration, the spot price exceeds the strike price, he makes a profit. Higher the spot price, more is the profit he makes. If the spot price of the underlying is less than the strike price, he lets his option expire un-exercised. His loss in this case is the premium he paid for buying the option. Figure 3.5 gives the payoff for the buyer of a three month call option (often referred to as long call) with a strike of 1250 bought at a premium of 86.60.
40
Introduction to futures and options
Figure 3.4 Payoff for investor who went Short Nifty at 1220 The fi gure shows the profi ts/losses from a short position on the index. The investor sold the index at 1220. If the index falls, he profi ts. If the index rises, he looses.
Profit +60
0
1160
1220
1280 Nifty
−60
Loss
3.12.2
Payoff profi le for writer of call options: Short call
A call option gives the buyer the right to buy the underlying asset at the strike price specified in the option. For selling the option, the writer of the option charges a premium. The profit/loss that the buyer makes on the option depends on the spot price of the underlying. Whatever is the buyer’s profit is the seller’s loss. If upon expiration, the spot price exceeds the strike price, the buyer will exercise the option on the writer. Hence as the spot price increases the writer of the option starts making losses. Higher the spot price, more is the loss he makes. If upon expiration the spot price of the underlying is less than the strike price, the buyer lets his option expire unexercised and the writer gets to keep the premium. Figure 3.6 gives the payoff for the writer of a three month call option (often referred to as short call) with a strike of 1250 sold at a premium of 86.60.
3.12.3
Payoff profi le for buyer of put options: Long put
A put option gives the buyer the right to sell the underlying asset at the strike price specified in the option. The profit/loss that the buyer makes on the option depends on the spot price of the underlying. If upon expiration, the spot price is below the strike price, he makes a profit. Lower the spot price, more is the profit he makes. If the spot price of the underlying is higher than the strike price, he lets his option expire un-exercised. His loss in this case is the premium he paid for buying the option. Figure 3.7 gives the payoff for the buyer of a three month put option (often
3.12 Options payoffs
41
Figure 3.5 Payoff for buyer of call option The fi gure shows the profi ts/losses for the buyer of a three-month Nifty 1250 call option. As can be seen, as the spot Nifty rises, the call option is in-the-money. If upon expiration, Nifty closes above the strike of 1250, the buyer would exercise his option and profi t to the extent of the difference between the Nifty-close and the strike price. The profi ts possible on this option are potentially unlimited. However if Nifty falls below the strike of 1250, he lets the option expire. His losses are limited to the extent of the premium he paid for buying the option.
Profit
0
1250 Nifty
86.60
Loss
referred to as long put) with a strike of 1250 bought at a premium of 61.70.
3.12.4
Payoff profi le for writer of put options: Short put
A put option gives the buyer the right to sell the underlying asset at the strike price specified in the option. For selling the option, the writer of the option charges a premium. The profit/loss that the buyer makes on the option depends on the spot price of the underlying. Whatever is the buyer’s profit is the seller’s loss. If upon expiration, the spot price happens to be below the strike price, the buyer will exercise the option on the writer. If upon expiration the spot price of the underlying is more than the strike price, the buyer lets his option expire un-exercised and the writer gets to keep the premium. Figure 3.8 gives the payoff for the writer of a three month put option (often referred to as short put) with a strike of 1250 sold at a premium of 61.70.
42
Introduction to futures and options
Figure 3.6 Payoff for writer of call option The fi gure shows the profi ts/losses for the seller of a three-month Nifty 1250 call option. As the spot Nifty rises, the call option is in-the-money and the writer starts making losses . If upon expiration, Nifty closes above the strike of 1250, the buyer would exercise his option on the writer who would suffer a loss to the extent of the difference between the Nifty-close and the strike price. The loss that can be incurred by the writer of the option is potentially unlimited, whereas the maximum profi t is limited to the extent of the up-front option premium of Rs.86.60 charged by him.
Profit
86.60 0
1250 Nifty
Loss
Solved Problems Q: Which of the following cannot be an underlying asset for a fi nancial derivative contract? 1. Equity index
3. Interest rate
2. Commodities
4. Foreign exchange
A: The correct answer is 2
Q: Which of the following exchanges was the fi rst to start trading fi nancial futures? 1. Chicago Board of Trade
3. Chicago Board Options Exchange
2. Chicago Mercantile Exchange
4. London International Financial Futures and Options Exchange
A: The correct answer is 2.
3.12 Options payoffs
43
Figure 3.7 Payoff for buyer of put option The fi gure shows the profi ts/losses for the buyer of a three-month Nifty 1250 put option. As can be seen, as the spot Nifty falls, the put option is in-the-money. If upon expiration, Nifty closes below the strike of 1250, the buyer would exercise his option and profi t to the extent of the difference between the strike price and Nifty-close. The profi ts possible on this option can be as high as the strike price. However if Nifty rises above the strike of 1250, he lets the option expire. His losses are limited to the extent of the premium he paid for buying the option.
Profit
0
1250 Nifty
61.70
Loss
Q: In an options contract, the option lies with the 1. Buyer
3. Both
2. Seller
4. Exchange
A: The option to exercise lies with the buyer. The correct answer is number 1.
Q: The potential returns on a futures position are: 1. Limited
3. a function of the volatility of the index
2. Unlimited
4. None of the above
A: The correct answer is number 2.
44
Introduction to futures and options
Figure 3.8 Payoff for writer of put option The fi gure shows the profi ts/losses for the seller of a three-month Nifty 1250 put option. As the spot Nifty falls, the put option is in-the-money and the writer starts making losses . If upon expiration, Nifty closes below the strike of 1250, the buyer would exercise his option on the writer who would suffer a loss to the extent of the difference between the strike price and Nifty-close. The loss that can be incurred by the writer of the option is a maximum extent of the strike price( Since the worst that can happen is that the asset price can fall to zero) whereas the maximum profi t is limited to the extent of the up-front option premium of Rs.61.70 charged by him.
Profit
61.70 0
1250 Nifty
Loss
Q: Two persons agree to exchange 100 gms of gold three months later at Rs.400/gm. This is an example of a 1. Futures contract
3. Spot contract
2. Forward contract
4. None of the above
A: The correct answer is number 2.
3.12 Options payoffs
45
Q: On 15th January Mr.Arvind Sethi bought a January Nifty futures contract which cost him Rs.269,000. For this he had to pay an initial margin of Rs.21,520 to his broker. Each Nifty futures contract is for delivery of 200 Nifties. On 25th January, the index closed at 1360. How much profi t/loss did he make? 1. + 3000
3. - 3000
2. - 2500
4. + 2500
A: Mr.Sethi bought one futures contract costing him Rs.269,000. At a market lot of 200, this means he paid Rs.1345 per Nifty future. On the futures expiration day, the futures price converges to the spot price. If the index closed at 1360, this must be the futures close price as well. Hence he will have made of profi t of (1360 - 1345)*200. The correct answer is number 1.
Q: Kantaben sold a January Nifty futures contract for Rs.269,000 on 15th January. For this she had to pay an initial margin of Rs.21,520 to her broker. Each Nifty futures contract is for delivery of 200 Nifties. On 25th January, the index closed at 1260. How much profi t/loss did she make? 1. - 17,000
3. - 15,000
2. - 15,000
4. + 17,000
A: Kantaben sold one futures contract costing her Rs.269,000. At a market lot of 200, this works out to be Rs.1345 per Nifty future. On the futures expiration day, the futures price converges to the spot price. If the index closed at 1260, this must be the futures close price as well. Hence she will have made of profi t of (1345 - 1260)*200. The correct answer is number 4.
Q: On 15th January, Nilish Kajaria bought one January Nifty futures contract which cost him Rs.269,000. For this he had to pay an initial margin of Rs.21,520 to his broker. Each Nifty futures contract is for delivery of 200 Nifties. On 25th January, the index closed at 1280. How much profi t/loss did he make? 1. + 13,000
3. - 13,000
2. - 12,500
4. + 12,500
A: Nilesh Kajaria bought one futures contract for Rs.269,000. At a market lot of 200, this means he paid Rs.1345 per Nifty future. On the futures expiration day, the futures price converges to the spot price. If the index closed at 1280, this must be the futures close price as well. Hence he made of loss of (1345 1280)*200. The correct answer is number 3.
46
Introduction to futures and options
Q: Krishna Seth sold one January Nifty futures contract for Rs.269,000 on 15th January. For this he had to pay an initial margin of Rs.21,520 to his broker. Each Nifty futures contract is for delivery of 200 Nifties. On 25th January, the index closed at 1390. How much profi t/loss did he make? 1. - 8,000
3. - 9,500
2. - 9,000
4. + 9,000
A: Krishna Seth sold one futures contract for Rs.269,000. At a market lot of 200, this works out to be Rs.1,345 per Nifty future. On the futures expiration day, the futures price converges to the spot price. If the index closed at 1,390, this must be the futures close price as well. Hence he made of loss of (1,390 1,345)*200. The correct answer is number 2.
Q: A call option at a strike of Rs.176 is selling at a premium of Rs.18. At what price will it break even for the buyer of the option? 1. Rs.196
3. Rs.187
2. Rs.204
4. Rs.194
A: To recover the option premium of Rs.18, the spot will have to rise to 176 + 18. The correct answer is number 4.
Q: Typically option premium is 1. Less than the sum of intrinsic value and time value
3. Equal to the sum of intrinsic value and time value
2. Greater than the sum of intrinsic value and time value
4. Independent of intrinsic value and time value
A: The correct answer is number 3.
Q: Spot value of S&P CNX Nifty is 1200. An investor bought a one-month S&P CNX Nifty 1220 call option for a premium of Rs.10. The options is 1. In-the-money
3. Out-of-money
2. At-the-money
4. None of the above
A: The correct answer is number 3.