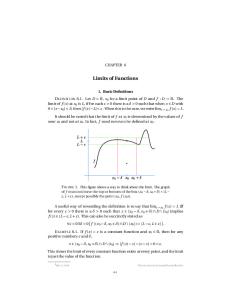
CHAPTER 1: FUNCTIONS AND LIMITS 1. Suppose a function y = f (x) has domain 0 < x < ∞ and g(x) = [f (x)]2 . If you know that limx→∞ g(x) = 4, what can you say about the limit of f (x), as x → ∞? More precisely, which one of the following statements is correct? (Mark one as your answer.) 1. The limit of the function f (x) is 2, i.e., limx→∞ f (x) = 2. 2. The limit of the function f (x) is −2, i.e., limx→∞ f (x) = −2. 3. The limit of the function f (x) is either 2 or −2, i.e., limx→∞ f (x) = ±2. 4. The limit of the function f (x) may be different from 2 and −2. 5. It is possible that f (x) does not have a limit as x → ∞. Remember to mark one correct answer. Give a short (one line) explanation why you think your answer is correct.
1
3. Suppose a continuous function y = f (x) has domain 0 < x < ∞ and its graph consists of intervals where f (x) = 0 and occasional “bumps” where f (x) rapidly grows to 1 and just as rapidly drops back to zero. See the plot. The intervals where f (x) = 0 get longer, so that each interval is twice as long as the previous one. The bumps, on the contrary, get shorter – every bump is twice as short (narrow) as the previous one. What can you say about the limit of f (x), as x → ∞? More precisely, which one of the following statements is correct? (Mark one as your answer.) 1. The limit of the function f (x) is zero, i.e., limx→∞ f (x) = 0. 2. The limit of the function f (x) is one, i.e., limx→∞ f (x) = 1. 3. The limit of the function f (x) is between zero and one, but not exactly zero or one. 4. The limit of the function f (x) does not exist. 5. The function f (x) has more than one limit, as x → ∞. Remember to mark one correct answer. For an extra credit, you can add a short (one line) explanation why you think your answer is correct. y
1 0
x 1
2
3
4
5
2
6
7
8
9
10
4. Suppose a continuous function y = f (x) has domain 0 < x < ∞ and its graph consists of intervals where f (x) = 0 and occasional “bumps” where f (x) rapidly grows to a certain level and just as rapidly drops back to zero. See the plot. The intervals where f (x) = 0 get longer, so that each interval is twice as long as the previous one. The bumps, on the other hand, get taller – every bump goes one step higher than the previous one. What can you say about the limit of f (x), as x → ∞? More precisely, which one of the following statements is correct? (Mark one as your answer.) 1. The limit of the function f (x) is zero, i.e., limx→∞ f (x) = 0. 2. The function f (x) tends to infinity, i.e., limx→∞ f (x) = ∞. 3. The limit of the function f (x) is any positive number. 4. The limit of the function f (x) does not exist. 5. The function f (x) has more than one limit, as x → ∞. Remember to mark one correct answer. For an extra credit, you can add a short (one line) explanation why you think your answer is correct. y 4 3 2 1 0
x 1
2
3
4
5
3
6
7
8
9
10
5. Suppose g(x) = x2 . The graph of a function f (x) is given below. For parts (a) − (c) below, write all real numbers z that make the statement true. If no values of z make the statement true, write “NONE”. You do not need to show your work. y 2 1 x
0 -1 -2
1
2
3
4
(a) f (g(z)) = 1.
(a)
.
(b) g(f (z)) = 0.
(b)
.
(c) f (f (z)) = 0.
(c)
.
5
(d) The function h(x) is given by the formula h(x) = 12 f (x + 2) − 1. on the axes provided below, draw a well labelled graph of h(x). y 2 1 x
0 -1 -2 -2
-1
0
4
1
2
6. The graph of a function f (x) is shown below. The domain of f (x) is −4 ≤ x ≤ 4. y
x
(a) Determine the domain and range of the function l(x) = −3f (x + 2) + 4. Domain:
≤x≤
Range:
≤y≤
. .
(b) On the axes below, draw a graph of the derivative of f (x).
5
y
x
7. A bug crawls on a metal plate along a curve given by x(t) = t + 1, y(t) = t2 + 2. The temperature on the plate is given by T (x, y, t) = 10 + xy + 2xt. How warm is the spot the bug reaches at t = 2 at that time?
8. Let C be the set of US cities with more than 100,000 inhabitants and S the set of US states. Rule 1: To every state s ∈ S we assign the cities in C located there. Rule 2: To every city c ∈ C we assign the state where it is located Which of these rules provides for a function and why?
6
9. Tom rolls a die five times and produces a list recording his rolls in the second row. Does this represent a function? Explain. 1 2 3 4
5
10. Sara works for HelioFun and fills balloons with helium. During the process the radius of balloon increases at the rate of 2cm per second. (a) Express the volume V of the balloon as a function of its radius (assuming it being spherical) (b) Express the radius r and the volume V of the balloon as functions of time. (c) Name the Mathematical operation which combines V and r to give V as a function of time. 11.Suppose g(x) = x2 . The graph of a function f (x) is given below. For parts (a) − (c) below, write all real numbers z that make the statement true. If no values of z make the statement true, write ”NONE”. You do not need to show your work. y 1 x 1
2
3
4
-1
(a) f (g(z)) = 1.
z=
.
(b) g(f (z)) = 0.
z=
. 7
(c) f (f (z)) = 0.
z=
.
(d) The function h(x) is given by the formula h(x) = 12 f (x + 2) − 1. On the axes provided below, draw a well labelled graph of h(x) y 3 2 1 x -1 -2 -3
-2
-1
1
2
3
12. Define a function ( f (x) =
−x3 +5x2 , x−5
k,
x 6= 0, x = 5,
a Find a value of k so that f (x) is a continuous function for all real numbers x.
b For the value of k you found, is f (x) differentiable at x = 5? Briefly explain.
8
13.The following figure shows the graph of y = f (x) for some function f . The dotted line signifies a vertical asymptote. y 5 4 3 2 1 -4
-3
-2
-1
1
2
4
5
6
x
-1 a Using the graph, give the values of each of the following quantities if they exist. Choose your answer in each part from the numbers 0, 1, 2, 3 or the words DOES NOT EXIST. Answers may be used more than once or not at all. i) f (1) =
,
ii) f (2) =
,
iii) f (3) =
,
iv) f 0 (−1) =
,
v) f 0 (1) =
,
vi) f 0 (2) =
, 9
vii) limx→+∞ f (x) =
,
viii) limx→3 f (x) =
,
ix) limx→2 f (x) =
,
x) limx→1 f (x) =
, ,
xi) limx→−1 f (x) = xii) limx→−∞ f (x) =
.
b Still looking at the graph, is f continuous at the following x values? (Yes or No) i) x = 1 ii) x = 2 iii) x = 3 14. Aziza and Zainab are former Math 126 students at a prestigious weather forecasting company near Cloudytown,MI. Each using different meteorological instruments, they’ve recorded the rainfall over Cloudytown during a storm. They’ve let F (t) be the total rainfall, in inches, t hours after the start of the storm. They collected the following data. Aziza’s data: F (0) = 0, Zainab’s data: F 0 (0) = 0.6,
F (1) = 0.3, F 0 (1) = 0.7,
and F (2) = 0.5 and F 0 (2) = 0.3
a Use Aziza’s data (and not Zainab’s data) to estimate how quickly the rain was falling, in inches per hour, at the start of the storm (time t = 0) and after one hour (t = 1). t=1:
t=0:
10
b (True of False) circle T (True) of F (False) for each of the statements below. • Assuming all the data gathered was correct, throughout the second hour of the storm it was raining at a rate of about 0.7 inches per hour. T F • Assuming all the data gathered was correct, during the first hour of the storm rainfall slowed down and later sped up again. T
F
• Either Aziza’s instrument or Zainab’s instrument must be faulty because their measurements give different values for F 0 (0) and F 0 (1). T F • Assuming all the data gathered was correct, since F 0 (0) = 0.6 we know that about 0.6 inches of rain fell in the first hour. T
F
c Give a practical interpretation of F 0 (0) = 0.6 that begins, “During the first five minutes of the storm ...”
11
CHAPTER 2: DERIVATIVES 1. If g(x) is a positive differentiable function, then for x > 0, the derivative ln x of the function g(x) is (circle correct answer and explain your choice) 1 xg(x)
1 xg 0 (x)
g 0 (x) ln x 1 + xg(x) (g(x))2
xg 0 (x)
1
1 g 0 (x) ln x − xg(x) (g(x))2 −
ln x (g(x))2
1 xg 0 (x)
+
ln x (g(x))2
2. The graph of a piecewise function f (x) is given below. Use it to select the correct value of each derivative below. Circle only one answer for each part. Ambiguous marks will receive no credit.
(-3,2) (1,1)
(1.5,-1) (3.5,-2)
a.
d [f (4 cos x)] dx (A) − 12
at x = π4 .
√ (B) 2 √ (C) − 2/2 √ (D) − 2 b.
d [f (f (x))] dx (A) 14
at x = 2.
12
(B) 18 (C) − 41 (D) − 18 c.
d [ef (x) ] dx
(A) (B) (C) (D)
at x = 45 .
−2 −1/2 −4 0
d. f 0 (f (x)) at x = 3. (A) (B) (C) (D)
1/4 1/8 −1/4 −1/2
3. In the following table, both f and g are differentiable functions of x. Answer the following questions. x f(x) f’(x) g(x) g’(x) (a) If h(x) =
f (x) , g(x)
2 7 -2 1 1
find h0 (4).
(b) If k(x) = f (x)g(x), find k 0 (2). (c) If m(x) = f (g(x)), find m0 (3).
13
3 6 1 4 2
4 5 2 9 3 2 7 11 3 2
§2.8 (Linear approximations) 1.
a. Find the local linearization L(x) of the function p(x) = (1 + x)k near x = 0, where k is a positive constant b. Suppose √ you want to use L(x) to find an approximation of the number 1.1. What number should k be, and what number should x be? √ c. Approximate 1.1 using L(x).
2.
a. Find the tangent line approximation of the function p(x) = 1 + xk near x = 1, where k is a positive constant. b. Suppose you want √ to use your tangent line from (a) to approximate the number 1 + 0.95. What values of k and x would you plug in to you answer from (a)? √ c. Approximate 1 + 0.95 using your tangent line from (a).
The figure below shows the graph of a function k(x) and its tangent line at a point (a,2). The average rate of change of k(x) between x = a and x = 6 is 61 . y
(6,3) k(x) (6,b) (a,2)
1 x 0 Find exact numerical values for the following. If it is not possible to find a value, write ”NP”. You do not need to show your work. 14
(a)
(a) =
.
(b)
(b) =
.
(c) k 0 (2) =
.
(c) k 0 (a) =
.
(c) k 0 (6) =
.
√ Suppose h(x) = (x − 1) x. (a) Using the limit definition of the derivative, write an explicit expression for h0 (3). Your expression should not contain the letter h. Do not try to evaluate your expression. h0 (3) = The derivative of h(x) is h0 (x) =
3√ x 2
. −
1 √ . 2 x
(b) Using the given formula for h0 (x), write an equation for the tangent line to the graph of h0 (x) at x = 2.
(c) Write an equation for the tangent line to the graph of h(x) at x = a where a is an unknown constant.
15
(d) Using your answer from (c), find a value of a so that the tangent line to the graph of h(x) at x = a passes through the origin.
The graph of a function g(x) is given below. y
4 3 2 1 x 0 -1 -2 -3
-2
-1
1
2
3
4
(a) List all x− values with −4 < x < 4 where g(x) is not continuous. If there are none, write NONE.
(b) List all x− values with −4 < x < 4 where g(x) is not differentiable. If there are none, write NONE.
16
(c) On the axes provided, carefully draw a graph of g 0 (x). Be sure to label important points or features on your graph. y
4 3 2 1 x -1 -2 -3
-2
-1
Define a function
1
( f (x) =
9−x2 , x−3
m,
2
3
4
x 6= 3, x=3
(a) Find the value of m so that f (x) is a continous function for all real numbers x.
(b) For the value of m you found, is f (x) differentiable at x = 3? Briefly explain. 17
Use the limit definition of the derivative to write an explicit expression for s0 (2) where s(t) = (t + 3)5t . Do not simplify or evaluate the limit. Your answer should not include the letter s. . s0 (2) =
[7 points] For which value(s) of a is the following function continuous? Show all your work. ( 2 x −5x , x 6= 5 x−5 f (x) = 2 ax − 2x − 10, x = 5. Given below is a graph of a function f (x) and a table for a function g(x). f (x) 2
3
5
7
x
-2
x g(x) g 0 (x)
0 1 4 3 -2 - 25
2 1 1 2
3 4 2 20 3 3 − 13
Give answers for the following or write DOES NOT EXIST. No partial credit will be given. 18
i)
ii)
d f (g(x)) dx
at x = 0
d [f (x)g(x)] dx
iii)
d f (x) [ ] dx g(x)
iv)
d g(f (x)) dx
at x = 2
at x = 4
at x = 3
v) f (g 0 (3))
19
CHAPTER 3: APPLICATIONS OF DIFFERENTIATION 1. The cable of a suspension bridge with two supports 2L meters apart hangs H meters above the ground. The height H is given in terms of the distance in meters from the first support x (in meters) by the function H(x) = ex−L + eL−x + H0 − 2 where H0 and L are positive constants. Notice that x ranges from 0 (the first support) to 2L (the second support). a. Find (but do not classify) the critical points for the function H(x). b. Find the x and y coordinates of all global maxima and minima for the function H(x). Justify your answers. 2. For the following questions, write “True” if the statement is always true, and otherwise write “False”. No justification is necessary. a. If f (x) is a function with a local maximum at x = c, then f 0 (c) = 0. b. If g 0 (55) = g 0 (65) = 0, then g(x) is constant on the interval 55 ≤ x ≤ 65. c. The point (π, 1) is on the curve defined by the implicit function 5 sin(xy) = ln(y). d. If h0 (x) < 0 for all x in the interval [2, 8], then the global maximum of h(x) on that interval occurs at x = 2. 3. For the following questions, write “True” if the statement is always true, and otherwise write “False”. No justification is necessary. a. If a function f (x) is continuous on the interval (0, 100), then f (x) has a global maximum and a global minimum on that interval. b. If f (x) is a differentiable function with a critical point at x = c, then the function g(x) = ef (x) also has a critical point at x = c. c. If f (x) is a differentiable function , f 0 (x) is continuous, and f 0 (x) 6= 0 for all x, then f (0) 6= f (5).
20
4. Consider the function f (x) = ax ln x − bx with domain x > 0, where a and b are positive constants. Note that this function has exactly one critical point. a. Find f 0 (x). b. For which values of a and b does f (x) have a critical point at (e, −2)? c. Using your values of a and b from part (b), is the critical point from (b) a local maximum, local minimum, or neither? Justify your answer. 5. Below is the graph of the function f (x) = rxe−qx , where r and q are constants. Assume that both r and q are greater than 1. The function f (x) passes through the origin and has a local maximum at the point P = ( 1q , qr e−1 ), as shown in the graph. ( 1q , qr e−1 )
a. Justify, using either the first-derivative test or second-derivative test, that the point P is a local maximum. b. What are the x-coordinates of the global maximum and minimum of f (x) on the domain [0, 1]? (If f (x) does not have a global maximum on this domain, say “no global maximum”, and similarly if f (x) does not have a global minimum.)
21
c. What are the x-coordinates of the global maximum and minimum of f (x) on the domain (−∞, ∞)? (If f (x) does not have a global maximum on this domain, say “no global maximum”, and similarly if f (x) does not have a global minimum.) d. Suppose that g(x) is a function with g 0 (x) = f (x). Find x-values of all local maxima and minima of g(x). Justify that each maximum you find is a maximum and each minimum is a minimum. 6. Consider the graph j 0 (x) given here. Note that this is NOT the graph of j(x).
j 0 (x)
A
B
E C
D
For each of (a)-(f) below, list all x-values labeled on the graph which satisfy the given statement in the blank provided. If the statement is not true at any of the labeled x-values, write “NP”. You do not need to show your work. No partial credit will be given on each part of this problem. (a) The function j(x) has a local minimum at x =
.
(b) The function j(x) has a local maximum at x =
.
(c) The function j(x) is concave up at x =
.
(d) The function j(x) is concave down at x =
.
(e) The function j 0 (x) has a critical point at x = 00
(f) The function j (x) is greatest at x =
22
. .
§3.5 (Optimization problems) 1. For Valentine’s Day, Jason decides to make a heart-shaped cookie for Sophie to try to win her over. Being mathematically-minded, the only kind of heart that Jason knows how to construct is composed of two half-circles of radius r and an isosceles triangle of height h, as shown below.
r h
Jason happens to know that Sophie’s love for him will be determined by the dimensions of the cookie she receives; if given a cookie as described above, her love L will be L = hr2 where r and h are measured in centimeters and L is measured in pitterpatters, a standard unit of affection. If Jason wants to make a cookie whose area is exactly 300cm2 , what should the dimensions be to maximize Sophie’s love? 1. Does the function y = f (x) = x1 have an antiderivative on the interval [−1, 1]. If so state it, if not explain why not. 2. Find an anti-derivative of f (x) =
3 +x x√ x
on the interval (0, ∞).
3. What constant acceleration is required to increase the speed of a car from 30 km/h to 50 km/h in 5 seconds? 4. Suppose that the speed of a car is given by v(t) = 10 sin(t) find the position of the car at time t = π/2 if its position at time zero, S(0) = 2. Mike and Lance decided to have a race down a straight portion of University Boulevard that is 1.1 kilometers long. Let M (t) and L(t) be Mike’s and Lance’s respective distances from starting point t seconds after the race began. A graph of M (t) and L(t) is shown below. 23
y
M (t) L(t)
1000 800 600 400 200 x 40
80
120 160 200 240 280 320
(a) ] Who won the race ? (circle your answer.) Mike
Lance
(b) Estimate the times at which Mike and Lance were running at the same speed.
(c) Estimate Mike’s average velocity over the first 200 seconds of the race. Include units.
(d) Estimate Mike’s instantaneous velocity 100 seconds after the race began.Include units.
24
(e) 150 seconds after the race began, is Mike’s acceleration positive, negative, or equal to zero? Given below is the graph of a differentiable function m(x) which is linear for x < −2 and x > 3. On the second set of axes, sketch a possible graph of m0 (x). Make sure your graph is drawn carefully. y
x -2
3
25
y
x
The graph of f (x), the derivative of a function f 0 (x), is shown below. y
f 0 (x) x 2
4
6
8
10
12
For each of the following questions, circle ALL correct answers. You do not need to show your work. (a) On which of the following intervals is f (x) increasing? 0 < x < 2,
2 < x < 4,
4 < x < 6,
10 < x < 12 26
6 < x < 8,
8 < x < 10
(b) On which of the following intervals is f (x) concave up ? 0 < x < 2,
2 < x < 4,
4 < x < 6,
6 < x < 8,
8 < x < 10
10 < x < 12 (c) On which of the following intervals is f (x) linear ? 0 < x < 2,
2 < x < 4,
4 < x < 6,
6 < x < 8,
8 < x < 10
10 < x < 12 (d) On which of the following intervals is f 00 (x) increasing? 0 < x < 2,
2 < x < 4,
4 < x < 6,
6 < x < 8,
8 < x < 10
10 < x < 12 (e) Suppose f (0) = −1 which of the following statements could be true? f (6) < −1
f (6) = −1
f (6) > −1
Given that the graph of a function f passes through the point (1, 6) and that the slope of its tangent line at (x, f (x)) is 2x + 1, find a formula for f (x) and evaluate f at 2.
Find a function f such that f 0 (x) = x3 and the line x + y = 0 is tangent to the graph of f.
Determine whether the following statement is true or false. If it is true explain why. If it is false explain why or give an example that disaproves the statement. Statement: If f 0 (x) = g 0 (x) for 0 < x < 1, then f (x) = g(x) for 0 < x < 1.
27
A stone was dropped off a cliff and hit the ground with speed of 120ft/s. What was the height of the cliff?
Two balls are thrown upward from the edge of a cliff 432 ft above the ground. The first is thrown with a speed of 48ft/s and the other is thrown a second later with a speed of 24ft/s. Do the balls ever pass each other?
A car is travelling at 100km/h when the driver sees an accident 80m ahead and slams on the brakes. What constant deceleration is required to stop the car in time to avoid a pileup?
Oil leaked from a tank at a rate of r(t) liters per hour. The rate decreased as the time passed and the values of the rate at two-hour intervals are shown in the table. Find lower and upper estimates for the total amount of oil that leaked out. t(h) r(t) (L/h)
0 2 4 5 8 10 8.7 7.6 6.8 6.2 5.7 5.3
[14 points]grams, of caffeine in a bar of soap that causes a typical customer’s bloodstream caffeine content to be x mg. (a) Assuming that M (x) is an invertible function, give a practical interpretation of the statement M −1 (2) = 12.
(b) Under the same assumption, give a practical interpretation of the statement M 0 (13) = 0.7. 28
(c) Laura and Eddie know that M (x) is either a linear or an exponential function, but they aren’t sure which. From experimenting, they know that M (12) = 2 and M (14) = 4. They need more data to determine which is correct. For each of the following hypothetical experimental results, circle EXPONENTIAL if the result shows that M (x) could be exponential, circle LINEAR if the result shows that M (x) could be linear, or circle EITHER if the result does not rule out either of the possibility. Assume Laura and Eddie’s equipment gives experimental evidence which is accurate to within 0.1 mg. (i) Laura and Eddie discover that M (x) is an invertible function. EXPONENTIAL
LINEAR
EITHER
(ii) Laura and Eddie discover that M 0 (17.2) = M 0 (18.3). EXPONENTIAL
LINEAR
EITHER
(iii) Laura and Eddie discover that when there are 7 grams of caffeine in the soap, the caffeine level in a typical customer’s bloodstream is roughly 15.6mg. EXPONENTIAL
LINEAR
EITHER
A motorcyclist heads north from an intersection after stoplight turns green. The table below records the data on the motorcyclist’s speedometer, measuring her velocity, v(t), in feet per second, t seconds after the spotlight turns green. Assume that the motorcyclist does not slow down at any point during the interval of time we are measuring. t 0 2 v(t) 0 5
4 6 15 30
(a) Recall that the acceleration function a(t), is the derivative of the velocity function. Use the table to estimate a(2). Include units.
(b) The jerk j(t) of a motorcycle is the derivative of the acceleration function. Use the table to estimate j(2). Include units. 29
(c) Given everything we know about the motorcyclist, can we definitely conclude that a(4) ≤ 8? If you answer YES, then explain your reasoning. If you answer NO, then sketch a graph of a velocity function v(t) which is consistent with all the information in this problem, but which has a(4) > 8.
Suppose n(x) = (x + 21 )ex . (a) Using the limit definition of the derivative, write an explicit expression for n0 (2). Your expression should not contain the letter n. Do not try to evaluate your expression.
n0 (2) =
.
The derivative of n(x) is n0 (x) = (x + 23 )ex .
(b) Using the given formula for n0 (x), write an equation for the tangent line to the graph of n(x) at x = 2.
(c) Write an equation for the tangent line to the graph of n(x) at x = a where a is an unknown constant.
(d) Using your answer from (c), find a value of a so that the tangent line to the graph of n(x) at x = a passes through the origin. In each of the following problems, give a formula for a function whose domain is all real numbers, with all of the indicated properties. If there is no such function, then write NO SUCH FUNCTION EXISTS. You do not need to show your work. 30
a A sinusoidal function P (t) with the following three properties (i.) The period of the graph of P (t) is 7. (ii.) The graph of P (t) attains a maximum value at the point (1, 20). (iii.) The graph of P (t) attains a minimum value at the point (−2.5, −6). P (t) =
.
b A function h(x) with the following two properties: (i.) h(x) is concave down for all x. (ii.) h(x) > 0 for all x. h(x) =
.
c A function j(x) with the following two properties: (i.) j(x) is decreasing for all x. (ii.) j(x) is concave up for all x. j(x) =
.
d A rational function `(x) with the following two properties: (i.) `(0) = 2. (ii.) The line y = 2 is a horizontal asymptote to the graph of `(x). `(x) =
.
The graph of a function h(x) is given below. 31
y 4 3 2 1 x -4
-3
-2
-1
1
2
3
4
a List all x− values with −4 < x < 4 where h(x) is not continuous. If there are none, write NONE.
b List all x− values with −4 < x < 4 where h(x) is not differentiable. If there are none, write NONE.
c On the axes provided, carefully draw a graph of h0 (x). Be sure to label important points or features on your graph. y
x -4
-3
-2
-1
1
32
2
3
4
[7 points] The air in a factory is being filtered so that the quantity of a pollutant, P (in mg/liter), is decreasing exponentially. Suppose t is the time in hours since the factory began filtering the air. Also assume 20% of the pollutant is removed in the first five hours. a What percentage of the pollutant is left after 10 hours?
b How long is it before the pollution is reduced to 50% [14 points] The table for the derivative of a function h with continuous first derivative is given below. Assume that between each consecutive values of x, the derivative h0 is either increasing or decreasing. For each statement below, indicate whether the statement is true, false, or cannot be determined from the information given. No partial credit will be given. x h0 (x)
-4 -3 -2 -1 0 1 2 3 1 -3 -4 -2
2 3 4 0 2 1
a.) The function h has a local maximum on the interval −2 < x < 1. True
False
Not enough information
b.) The function h is negative on the interval −1 < x < 1. True
False
Not enough information
c.) The function h is concave up on the interval 0 < x < 4. True
False
Not enough information
d.) The function h is decreasing on the interval −3 < x < −2. True
False
Not enough information
e.) The function h has an inflection point on the interval −1 < x < 1. True
False
Not enough information 33
f.) The derivative function, h0 , has a critical point at x = 2. True
False
Not enough information
g.) The second derivative function, h00 , is positive on the interval 0 < x < 3. True
False
Not enough information
[10 points] Farmer Fred is designing a fence next to his barn for his grassfed herd of cattle. The fence will be rectangular in shape with wooden fence on three sides and a chain link fence on the side closest to his barn. The wooden fence costs $6 per foot and the chain link fence costs $3 per foot. If he wants the fenced area to be 40,000 square feet, what should the dimensions of his fence be in order to minimize his total cost?
[15 points] Answer True or False for each of the following, and include a brief explanation of your answer. A picture may be sufficient explanation, if appropriate. The functions h, h0 , m and m0 referred to in the problem are all differentiable on their domain. The letters a and b represent constants. (Note: Answer True only if the statement is always true.) i) If y = h0 (x)m(x) − h(x)m0 (x),
then
True
ii) If m00 (a) = 0,
then
dy dx
= h00 (x)m(x) − h(x)m00 (x).
False
m(x) has an inflection point at x = a. True
False
iii) If h00 (x) > 0 on the interval [a, b] and h(a) > h(b), then h(a) is the 34
absolute maximum value of h(x) in [a, b]. True
False
iv) There exists a continuous function f (x) which is not differentiable at x = 0 with a local maximum at (0, 5). True
v) The function g(x) = e−
(x−a)2 b
False
has a local maximum at x = b.
True
False
[14 points] Business owner Abbey Alexander is constructing a building for her latest business. Abbey wants her building to be energy efficient in order to save money on utility costs. Abbey has been given the following graph to help her decide on how much to spend on improvements.
35
50
40
30 K(thousands of kWh) 20
10
100
200
300
400
C(thousands of dollars) In the graph, K is the expected savings in thousands of kilowatt hours (kWh) per year if Abbey spends C thousand dollars on the energy-efficiency improvements. The dark point on the curve is (200, 35) and the dotted line is a horizontal asymptote at K = 45. a Write a function of the form K = a(1 − e−bC ) for the curve in the graph above.
b The current price of energy from Abbey’s power company is $250 per thousand kWh. Assuming this price stays constant, write a function F (C) which gives Abbey’s total savings (in thousands of dollars) on utility costs over the first 20 years.
36
c [6 points] If Abbey spends C thousand dollars on energy-efficiency improvements, her net monetary savings.N, over 20 years, is given by the formula N = F (C) − C Where F (C) is from part b. How much should Abbey spend on energyefficiency improvements in order to maximize her net monetary savings over the first 20 years? Be sure to justify your answer. The graph of a piecewise linear function f (x) is shown below. On the axes provided, sketch a well labelled graph of an antiderivative F (x) of f (x) satisfying F (0) = −1. Be sure to make the concavity of F clear and to label the y−coordinate of the local minima and maxima of F and the y− coordinates of F at x = 5 and x = −5.
f (x) 2 1 x -1 -2
-5
-4
-3
-2
-1
1
37
2
3
4
5
2 1 x -1 -2
-5
-4
-3
-2
-1
1
2
3
4
5
It is projected that the number of marine plant and animal species on earth will decrease by 40% by the year 2050. The current (2010) instantaneous rate of marine species loss is 80,000 species per year. a [6 points] Assuming the number of marine species is modeled by an exponential function, write an exponential function M = f (t) which outputs the total number of marine species t years after 2010.
b According to your model, about how many marine species are there currently (in 2010)? About how many will be there in 2050?
38
c In what year will there be half as many marine species as there are currently (in 2010)? Using derivatives, approximate how many marine species will be lost that year.
The U-value of a wall of a building is a positive number related to the rate of energy transfer through the wall. Walls with a lower U-value keep more heat in during the winter than ones with higher U-value. Consider a wall which consists of two materials, material A with U-value a and material B with U-value b. The U-value of the wall w is given by w=
ab a+b
Considering a as a constant, we can think of w as a function of b, w = u(b). a Write the limit definition of the derivative of u(b).
b Calculate u0 (b). (You do not need to use the limit definition of the derivative for your calculation.)
c Find the x−and y−coordinates of the global minimum and maximum of u(b) for b in the interval [1, 2]. Your answer may involve the parameter a. [Recall that a, b > 0] Global minimum on [1, 2] : Global maximum on [1, 2] : The Green Bag Company (GBC) makes hand bags out of recycled materials. A table of the company’s marginal cost, MC, and marginal revenue, 39
MR, at various production levels q is given below. The variable q is the number of hand bags produced, and marginal cost and marginal revenue are measured in dollars per bag. q MC MR
1000 2000 3000 4000 5000 6000 100 81 75 96 112 123 125 123 114 110 107 106
Assume for this problem that GBC’s cost and revenue functions are twice differentiable and that M C and M R are either increasing or decreasing on each interval shown in the table. a At which production level from the table is GBC’s profit increasing the fastest? Explain your answer.
b The CEO of the company thinks profit is maximized at 3000 bags, but the CFO of the company thinks profits will be maximized at 4500 bags. Who could be correct, and why ? [Note: The terms “CEO” and “CFO” refer to officers in the company.]
c Assuming GBC has no fixed costs, use a right-hand sum to estimate the cost to produce the first 3000 bags. Be sure to show your work.
[10 points] Given below is a graph of h0 (x), the derivative of a function h(x).
40
h0 (x)
-3
-2
-1
1
2
3
x
(a) On the axes below, sketch a possible graph of h(x). h(x)
-3
-2
-1
1
2
3
x
(b) List the x−coordinates of all inflection points of h. (c) Give the x−coordinate of the global minimum of h on [−3, 3]. (d) Give the x− coordinate of the global maximum of h on [−3, 3].
[12 points] A continous (but not necessarily differentiable) function, f , is defined for all real numbers and has the following properties: a f 0 (x) = 1 for x < −1 41
b f is concave up for −1 < x < 3 c f (2) = 1 d f 0 (2) = 0 e limx→+∞ f (x) = 2 f f 00 (x) > 0 for x > 5 On the axes below, draw a possible sketch of y = f (x) including labels where appropriate y
x
42
CHAPTER 4: INTEGRALS
y 1. Suppose a function y = f (x) must satisfy 1 ≤ f (x) ≤ 3 for all 0 ≤ x ≤ 3 One such function is plotted here, but there are many more... R3 What is the minimal possible value of 0 f (x) dx? R3 What is the maximal possible value of 0 f (x) dx? R3 Write your answers in two boxes: ≤ 0 f (x) dx ≤
3 2 1 0
x 0
1
2
3
y 3 2. Suppose a function y = f (x) is linear, as shown in the plot: R3 Find the value of its integral: 0 f (x) dx =
2 1 0
x 0
1
2
3
y 3 3. Suppose the graph of a function y = f (x) is triangular, as shown in the plot: R3 Find the value of its integral: 0 f (x) dx =
2 1 0
43
x 0
1
2
3
y 4. Suppose the graph of a function y = f (x) is a curve shown in the plot: Which statement R 3 below is correct? (a) f (x) dx > 6 R03 (b) f (x) dx < 6 R 03 (c) 0 f (x) dx = 6 choose one: (a), (b), or (c).
3 2 1 0
x 0
1
2
3
y 5. Suppose a function y = f (x) must be continuous on [0, 3] and satisfy 1 ≤ f (x) ≤ 3
for all 0 ≤ x ≤ 3
f (0) = 1, f (2) = 3, f (3) = 1 Sketch the graph of such a function trying to R3 make its integral 0 f (x) dx as large as possible.
3 2 1 0
x 0
1
2
3
y 6. Suppose the graph of a function y = f (x) is a curve shown in the plot: Which statement R 3 below is correct? f (x) dx > 6 (a) R03 f (x) dx < 6 (b) R 03 (c) 0 f (x) dx = 6 choose one: (a), (b), or (c).
3 2 1 0
x 0
1
2
3
y 7. Suppose a function y = f (x) must be continuous on [0, 3] and satisfy 1 ≤ f (x) ≤ 3
for all 0 ≤ x ≤ 3
f (0) = 1, f (2) = 3, f (3) = 1 Sketch the graph of such a function trying to R3 make its integral 0 f (x) dx as small as possible.
44
3 2 1 0
x 0
1
2
3
2 8. Let y = f (x) be a continuous function Rx on the interval [0, 2] and F (x) = 0 f (t) dt. Is it possible that f (x) is decreasing on [0, 2], but F (x) is increasing on [0, 2]? If yes, sketch the graph of such a function y = f (x). If not, simply say “not possible”.
y
1 x
0
1
2
-1 -2 2
9. Let y = f (x) be a continuous function Rx on the interval [0, 2] and F (x) = 0 f (t) dt. Is it possible that f (x) is increasing on [0, 2], but F (x) is decreasing on [0, 2]? If yes, sketch the graph of such a function y = f (x). If not, simply say “not possible”.
y
1 x
0
1
2
-1 -2 2
10. Let y = f (x) be a continuous function Rx on the interval [0, 2] and F (x) = 0 f (t) dt. Is it possible that f (x) is increasing on [0, 2] and F (x) is decreasing on [0, 1] but increasing on [1, 2]? If yes, sketch the graph of such a function y = f (x). If not, simply say “not possible”.
y
1 x
0
1
2
1
2
-1 -2 2
11. Let y = f (x) be a continuous function Rx on the interval [0, 2] and F (x) = 0 f (t) dt. Is it possible that f (x) is increasing on [0, 2] and F (x) is increasing on [0, 1] but decreasing on [1, 2]? If yes, sketch the graph of such a function y = f (x). If not, simply say “not possible”.
1 0 -1 -2
45
y
x
R 2 1Use a Riemann sum with two terms and the midpoint rule to evaluate dt and use this to estimate ln(2). [Do not use your calculator to 1 t obtain this value.] However, do compare this value with the value obtained by your calculator for ln(2) and state the difference. y 2 1
A 2
0
1
3
4
D
5
B
C
6
7
x 8
-1 The graph of a function y = f (x) is shown above. The area between the graph and the x axis is shaded; it consists of four parts: A, B, C, D. The area of each part is measured and recored in the chart below: Part Area Let F (x) =
Rx 0
A B C D 2.4 1.2 1.2 1.2
f (t) dt. Find the following values of F :
F (2) =
F (4) =
F (6) =
F (8) =
F (1) =
F (3) =
F (5) =
F (7) =
Describe the behavior of F (x) on the following intervals: on [0, 2], F (x) is increasing/decreasing and stays positive/negative on [2, 4],
F (x) is increasing/decreasing and stays positive/negative
on [5, 6],
F (x) is increasing/decreasing and stays positive/negative
on [7, 8],
F (x) is increasing/decreasing and stays positive/negative
46
For each interval, circle either the word increasing or the word decreasing as your answer, and circle either the word positive or the word negative as your answer. Make sure you circle two words for each interval. Let A be the area under the graph of a decreasing continuous function f from a to b, and let Ln and Rn be the approximations to A with n subintervals using the left and right endpoints respectively. (a) How are A, Ln and Rn related ? b−a [f (b) n
(b) Show that Ln − Rn =
b−a [f (b) n
(c) Deduce that Ln − A
0. 6+ 2 t a
Determine whether the following statement is true or false. If it is true, explain why. If it is false, explain why or give an example that disproves the statement. Statement: If f is continuous on [a, b], then � �Z b d f (x) dx = f (x) dx a
Let f (x) = (x − 3)2 on the closed interval [2, 5]. (a) Find the average value of f. (b) Find a number c such that fave = f (c). (c) Sketch (on the same frame) the graph of f and a rectangle whose area is the same as the area under the graph of f.
48
6 y 5 4 3 2 1 0
x 0
If f is continuous and
1
2
R9 0
3
4
f (x) dx = 4, find
5
6
R3
xf (x2 ) dx.
0
Rb R b+c If f is continuous on R, show that a f (x + c) dx = a+c f (x) dx. [12 points] Shown below is a graph of a function r(t). The graph consists of a straight line between t = 0 and t = 2 and a quarter circle between t = 2 and t = 3.
49
r(t) 2
1
1
2
t
3
-1
-2 Calculate the following using the properties of integrals. R3 a −3 0 (2 + r(t)) dt.
b
R 32 1 2
r0 (t) dt.
c The average value of r on the interval [1, 3]. [12 points] Let f (x) and g(x) be increasing continuous functions defined on the interval [0, 10] with f (0) = g(0) = 0. Also suppose f is always concave down and g is always concave up. For each of the following statements, determine whether it is always true, sometimes true, or never true, and circle only one option. Explanations are not necessary and they will not be counted for credit. R 10 R 10 a) 0 f (x) dx > 0 g(x) dx. always
sometimes 50
never
b) f 0 (10) < g 0 (10). always
sometimes
never
always
sometimes
never
sometimes
never
sometimes
never
c) g 0 (0) > g 0 (2).
d)
R 10 0
|f (x)| dx =
R 10 0
f (x) dx.
always e)
R 10 0
f 0 (x) dx > 0. always
f) If G is the antiderivative of g, then G(10) > 0. always
sometimes
never
[14 points] The rate which a coal plant releases CO2 into the atmosphere t days after 12:00 am on JanR 1, 2010 is given by the function E(t) measured 31 in tons per day. Suppose E(t) dt = 223. 0 R 59 a) Give a practical interpretation of 31 E(t) dt.
b Give a practical interpretation of E(15) = 7.1
c The plant is upgrading to clean coal technology which will cause its July 2010 CO2 emissions to be one fourth of its January 2010 CO2 emissions. How much CO2 will the coal plant release into the atmosphere in July? 51
d Using a left-hand sum with four subdivisions, write an expression which approximates Z 59
E(t) dt. 31
52
CHAPTER 5: INVERSE FUNCTIONS Given a graph of y = ln(x) read off: (1) the value y = ln(2) (2) the value of x = e1.5 Indicate in the graph how you found your values; do not use your calculator to find these values! y 2
f (x) = ln(x)
1 x
0 -1 -2 -2
-1
0
1
2
3
4
5
6
Given a graph of y = ex read off: (1) the value y = e2 (2) the value of x = ln(2) Indicate in the graph how you found your values; do not use your calculator to find these values!
53
y f (x) = ex
9 8 7 6 5 4 3 2 1
x
0 -1 -3
-2
-1
0
1
2
3
Suppose that f (x) = x10 and g(x) = ex : Compare the values f (1000) = 100010 and g(1000) = e1000 ; which one is bigger? Justify your answer (Do not try to use your calculator to compare these values)! [10 points] Muthoka’s new car came with an information sheet about the typical fuel efficiency of the car at different speeds. The fuel efficiency, E, is measured in miles per gallon (mpg) and the speed, v, is measured in miles per hour (mph). A portion of the spreadsheet is given here: E v
15 20 10 20
22.925 25 26.61 27.925 30 40 50 60
a Muthoka notices that, for the range of the values in this table, v grows exponentially with E. Find an exponential function f so that v = f (E).
54
b Give a practical interpretation of f −1 (17) = 19.
c Give a practical interpretation of (f −1 )0 (25) = 0.3.
55
CHAPTER 6: TECHNIQUES OF INTEGRATION
56
CHAPTER 7: APPLICATIONS OF INTEGRATION Consider the region in the xy−plane √ bounded by the y−axis, the horizontal line y = 1, and the curve y = 4 x. (a) Sketch this region in the xy−plane. y
x (b) Find the area of this region by writing x as a function of y and intergrating with respect to y.
A honeybee population starts withR 100 bees and increases at a rate of 15 n (t) bees per week. What does 100 + 0 n0 (t) dt represent? 0
Water flows from the bottom of a storage tank at a rate of r(t) = 200 − 4t liters per minute, where 0 ≤ t ≤ 50. Find the amount of water that flows from the tank during the first 10 minutes. Breathing is cyclic and a full respiratory cycle from beginning of inhalation to the end of exhalation takes about 5s. The maximum rate of air flow into the lungs is about 0.5L/s. This explains in part why the (oscillatory) function f (t) = 12 sin(2πt/5) has often been used to model the rate of air flow into the lungs. Use this model to find the volume of air inhaled in the lungs at time t. 57
[6 points] The force, F between two magnets arranged in an array depends on the distance r separating them. Looking at the graph below, a positive F represents a repulsive force; a negative F represents an attractive force. The horizontal intercept of the graph is r = a. F
a
r
(a) ] What happens to the force if the magnets start with r = a and are pulled slightly farther apart?
(b) ] What happens to the force if the magnets start with r = a and are pushed slightly closer together?
(c) The magnets are said to be in equilibrium if the force between them is zero and the magnets tend to return to the equilibrium after a minor disturbance. Does r = a represent a stable equilibrium ? Give a brief explanation.
58
CHAPTER 8: SERIES 1. Let an be a sequence of numbers. Suppose none of them is zero, and positive numbers alternate with negative numbers so that a1 , a3 , a5 , . . . are positive and a2 , a4 , a6 , . . . are negative. Can such an alternating sequence have a limit? More precisely, which one of the following statements is correct? (Mark one as your answer.) 1. Such an alternating sequence cannot have a limit. 2. Such an alternating sequence can have a limit, but the limit must be zero. 3. Such an alternating sequence can have a limit, but the limit must be positive. 4. Such an alternating sequence can have a limit, but the limit must be negative. 5. Such an alternating sequence can have a limit, and the limit can be either positive or negative. Remember to mark one correct answer. For an extra credit, you can add a short (one line) explanation why you think your answer is correct.
59