33 (2015) Changing families and sustainable societies: Policy contexts and diversity over the life course and across generations
Increasing childlessness in Europe: time trends and country differences
Anneli Miettinen, Anna Rotkirch, Ivett Szalma, Annalisa Donno, and Maria-Letizia Tanturri
© Copyright is held by the authors.
A project funded by European Union's Seventh Framework Programme under grant agreement no. 320116
Increasing childlessness in Europe: time trends and country differences Anneli Miettinen1, Anna Rotkirch1, Ivett Szalma2, Annalisa Donno3, and Maria-Letizia Tanturri3
Abstract: This working paper provides an overview of trends in female and male childlessness in Europe over the last decades and explores associations between cohort childlessness and national demographic and social indicators. We also estimate proportions of voluntary childless people. Results show that childlessness has increased at ages 30–34 and 40–44 years among both men and women throughout Europe, with few exceptions. Female childlessness at ages 40–44 years remains low (below or at 10%) in Bulgaria, the Czech Republic, Estonia, Hungary, Lithuania, Poland, Portugal, Romania and Russia, moderate (11–15%) in France, Belgium, Georgia, Germany, Norway, Slovak Republic, Slovenia, Sweden, and the US, and high (around 20%) in Austria, Italy, Finland, the Netherlands and the UK. Male lifetime childlessness is highest (above 23% among men aged 45–49) in Finland, Italy, Germany, the UK and the Czech Republic. Childlessness is more common among men with little education, and among women with either very high or very low education. Childlessness is higher in countries where mean age at marriage is high and entry into motherhood is on average more delayed. Childlessness remains negatively associated with proportions ever married, and also with completed cohort fertility. The last association has even grown stronger in the youngest cohorts, suggesting that in a low fertility context, increasing childlessness contributes markedly to overall fertility. The prevalence of childlessness does not seem to be associated with proportions of women with high education, with women’s employment rates and with divorce rates at country level. Higher childlessness is found in countries with widespread individualist values. Keywords: childlessness, fertility, gender equity, marriage, divorce, childfree, Europe
Affiliation: 1) Population Research Institute, Väestöliitto (PRI) 2) Swiss Centre of Expertise in the Social Sciences (FORS) and Hungarian Academy of Sciences (MTA TK) 3) University of Padova (UNIPD) Acknowledgement: The research leading to these results has received funding from the European Union's Seventh Framework Programme (FP7/2007-2013) under grant agreement no. 320116 for the research project FamiliesAndSocieties.
Contents
1. Introduction .......................................................................................................................... 2 2. Macro-level factors contributing to childlessness ............................................................. 3 2.1. Lack of partners .............................................................................................................. 4 2.2. Later parenthood ............................................................................................................. 4 2.3. Higher divorce rates and union dissolution risks ............................................................ 4 2.4. Material resources and social status ................................................................................ 5 2.5. Women’s social position ................................................................................................. 5 2.6. Individualisation and value liberalism ............................................................................ 6 3. Materials and methods ......................................................................................................... 6 3.1. Defining and measuring childlessness ............................................................................ 6 3.1.1. Gender differences in childlessness ......................................................................... 8 3.2. Data sources used ............................................................................................................ 8 3.2.1. Data on male and female cohort childlessness ........................................................ 8 3.2.2. Data on macro-level indicators ............................................................................... 9 3.2.3. Eurobarometer data on fertility intentions .............................................................. 9 4. Trends in female and male childlessness ............................................................................ 9 4.1. Changes in female cohort childlessness .......................................................................... 9 4.2. Changes in female childlessness 1990–2010 ................................................................ 13 4.4. Male childlessness......................................................................................................... 16 4.5. Educational differences in childlessness ....................................................................... 18 5. Associations between country indicators and childlessness ........................................... 20 5.1. Fertility indicators ......................................................................................................... 21 5.1.1. Mean age at first birth and childlessness .............................................................. 21 5.1.2. Cohort fertility and childlessness .......................................................................... 23 5.2. Partnership formation and childlessness ....................................................................... 24 5.2.1. Proportions of ever married and childless ............................................................ 24 5.2.2. Age at first marriage and childlessness ................................................................. 26 5.2.3. Divorce rates and childlessness ............................................................................. 27 5.3. Women’s social positions ............................................................................................. 29 5.3.1. Female education and childlessness ...................................................................... 29 5.3.2. Female employment and childlessness .................................................................. 30 5.4. Values and childlessness ............................................................................................... 32 5.4.1. Post-materialist values .......................................................................................... 32 5.4.2. Importance of children in marriage....................................................................... 33 6. Intended and voluntary childlessness ............................................................................... 35 6.1. Intended childlessness ................................................................................................... 36 6.1.1. Intended childlessness by educational levels ......................................................... 37 6.2. Proportions of childfree respondents ............................................................................ 38 6.2.1. Childfree Europeans by educational levels ........................................................... 40 7. Conclusions ......................................................................................................................... 40 8. References ........................................................................................................................... 43 Appendix Tables ..................................................................................................................... 46
1
1. Introduction Although childlessness is increasing in all developed countries, we know very little about recent European developments and their underlying causes. There is no up-to-date review of childlessness in EU countries outside some of the European Surveys, and Eurostat does not discern fertility by parities at macro level. The proportion of men and women having no children affects human and economic development in several ways ranging from population dynamics and family structure to individual wellbeing, calling for enhanced empirical and theoretical understanding of childlessness in developed societies. Time trends in the prevalence of childlessness are quite similar across European countries. The prevalence of childlessness was high among the 1880–1910 birth cohorts, followed by a more or less continuous drop across the 1910–1945 birth cohorts ending with the post-war “baby boomers”, turning into a steady rise in childlessness across the cohorts born after the Second World War (Rowland 2007; Frejka et al. 2001; Prioux 1993). In early cohorts, there was often a negative relationship between overall fertility and childlessness, but this association appears to have weakened with the advent of the so-called second demographic transition. Once fertility has fallen to around or below replacement level, countries with similar levels of completed fertility may have quite different proportions of childless women. Thus high childlessness at or above 20 per cent is found in both relatively high and relatively low fertility countries (Austria, with a total fertility rate (TFR) in 2012 at 1.44 vs. England & Wales with a TFR of 1.94), as is low childlessness (at or below 10 per cent) (Russian Federation vs. Czech Republic with their 1.7 and 1.45 TFR in 2013, respectively). Previous studies have discerned four different combinations of fertility and childlessness in today’s Europe: high-low, high-high, low-low, and low-high (Basten & Sobotka 2013). First, the French and Scandinavian fertility pattern is characterized by “egalitarian” fertility, or close to replacement level fertility and low childlessness. The fertility pattern in some countries, such as the United Kingdom, is described by high fertility and high childlessness. These countries are marked by polarized fertility or high cohort childlessness (around 20%), but also a higher share of women with four or more children (Shkolnikov et al. 2007). Third, Central and Eastern Europe and some Southern European countries have long been characterized by lowest low or low fertility but relatively low level of childlessness. This may partly explained by the absence of later arrival of the so-called second demographic transition in these countries, including adherence to the values of 2
traditional marriage and motherhood and negative attitudes to voluntary childlessness (Merz and Liefbroer 2012). Women in these countries had rarely been childless in the past, but the trend may be changing. Finally, the low fertility in the German-speaking countries and in today’s Southern Europe is largely attributable to high childlessness (Goldstein et al. 2003; Sobotka 2013). These countries also have quite egalitarian fertility, but towards the lower end, so that few have three or more children compared to the high fertility-low childlessness countries (Basten et al. 2013; see Mills et al. 2013.) In this report, we provide an overview of macro-trends in childlessness in different European countries as well as the United States and Australia. Data on fertility and childlessness have typically been collected and studied only for women. Whenever possible, we include data on childlessness also among men. We analyse country-level associations between childlessness and marital and fertility patterns as well as associations with economic and value change and gender equity.
2. Macro-level factors contributing to childlessness Childlessness in contemporary societies is a relatively new research topic and there is no established theoretical framework for studying it. Since childlessness is not necessarily dependent on overall fertility, as stressed above, theoretical explanations behind childlessness may differ from those concerned with average fertility levels (Tanturri and Mencarini 2008; Mills et al. 2013). Although a comprehensive theory of childlessness has been developed yet (Basten 2009; Waren & Pals 2013; Graham et al. 2013; Gobbi 2013), several contributing factors have been outlined. Following Philipov et al. (2008) we mean with macro contexts studies of several countries (to study differences across countries) or several years (to study change within countries). It is beyond the scope of this analysis to investigate cause–effect relationships between the study variables. We identify associations between country characteristics and childlessness rates, without debating the direction of this association or possible mediating variables. At the macro level, major factors associated with rates of childlessness include trends in marriage (e.g., median age at marriage and the proportions marrying) (Portanti and Withworth 2009), trends in family formation (e.g., median age at the first birth and average family size), and different factors contributing to voluntary and involuntary childlessness (Rowland 2007; Hakim 2005). The impact of family change (e.g. the rise of divorce rate) on childlessness 3
remains a relatively unexplored area of research. We focus at two cohorts, women born in 1940-44 and women born in 1960-69, in order to examine possible changes in the associations over time. Macro-level indicators reflect the situation in the countries when women of these cohorts were around 30 years. Below, we briefly summarize the major different factors known to contribute to childlessness with an emphasis on socio-structural factors possible to study with existing macro data. 2.1. Lack of partners Historically and across societies, failure to marry has been the most common reason for childlessness. Lack of partner also remains one of the major reasons for contemporary childlessness (Berrington 2004; Szalma & Takács 2012). In today’s Europe, single women are the most likely to be childless while married women are least likely to be childless (see e.g. Portanti & Withworth 2009; Tanturri 2009). However the link is expected to weaken as cohabitation and out-of-wedlock fertility is becoming more and more common everywhere. Nevertheless, contemporary childlessness is occurring increasingly often among healthy and sexually active women who are married or cohabiting (Coleman, 1996). Here, we study associations between childlessness and proportions of ever-married at age 35-39 years. 2.2. Later parenthood The age at first birth, or transition to parenthood, has been increasing throughout Europe in the last decades, and will exceed 30 in several countries and subpopulations (e.g. Goldstein 2006; Testa 2006). In some cases postponement of parenthood is directly related to a delay in the union formation per se, but in others to a prolonged period of childlessness after union formation. Delayed parenthood may lead to lower overall fertility and also to childlessness (Nicoletti & Tanturri, 2008), so that one can expect mean age of first birth to be positively associated with cohort childlessness. 2.3. Higher divorce rates and union dissolution risks Divorce levels have been rising in most European countries. Cohabitation has become an increasingly popular type of union, and cohabiting unions are known to dissolve more often than marital unions do. Also childlessness is more common in cohabiting unions (Baizàn et al. 2003; Spéder & Kapitàny 2009). The consequences of increasing fragility of both cohabiting and marital unions on fertility patterns in general have not been much explored, and data on 4
dissolved cohabitations is especially hard to find. Existing studies indicate that stepfamilies compensate for births lost to some degree when prior unions dissolve (Meggiolaro & Ongaro 2010; Van Bavel et al. 2012). The impact of divorce on childlessness has been surprisingly little explored yet. We assume that union dynamics contribute to the postponement of first births and may also be linked with eventual childlessness. 2.4. Material resources and social status The effect of material resources on childbearing varies with the stage of the demographic transition of the society in question. In poor and preindustrial environments, having access to more resources and wealth is generally related to earlier and higher fertility. In highly developed societies and low fertility societies, this association is typically reversed and wealthier families tend to have fewer children. However, the negative association between wealth and fertility may currently be reversed in some countries (e.g. Kravdal & Rindfuss 2008). It does typically not hold for men. Higher male education is usually related to lower childlessness, while the opposite is true for women (Gonzáles & Jurado-Guerrero 2006; Andersson et al 2009; Fieder et al 2011; Barthold et al. 2012). In some countries childlessness is also high among little educated women (Miettinen 2010). Some studies suggest that these patterns may be weakening or even reversing for women (Persson 2010; Andersson et al 2009). Here, we explore associations between childlessness and male and female education. 2.5. Women’s social position Women’s increased economic independency and educational attainment has increased the similarity in gender roles and expectations for men and women. The relationship between fertility and gender equality remains unclear, however. On the one hand, higher female education has been found to relate to higher childlessness both within and between countries. For instance, Nicoletti & Tanturri (2008) found that higher female education increased postponement of the first birth and, especially after age 30, childlessness, in ten European countries. On the other hand, more egalitarian gender relations and gender equity in the public sphere appear to increase fertility, as suggested by findings from the Nordic countries. For example, Persson (2010) found signs of a remarkable fertility “recuperation”, due much to women with high levels of education becoming mothers later in life. Here, we explore associations between childlessness and proportions of educated women and working women in a society. 5
2.6. Individualisation and value liberalism Processes of value liberalisation and individualisation affect family formation. In liberal and tolerant societies, women and men decide whether they opt for parenthood or not according to their own preferences largely. Although second demographic transition theory makes no specific predictions regarding childlessness, childbearing is predicted to be more affected by individual preferences and choices instead of social and marital institutions (van de Kaa 2007). Previous empirical studies have partly found evidence for the role of value changes in the increasing rate of childlessness: “family values” seemed to be more important for people having children than for the intentionally childless – but this difference disappeared when comparing the value preferences of people who had had children to those of the temporarily childless (Keizer 2010). Preference theory (e.g. Hakim 2002; Hakim 2005) predicts that in societies with wider female choice, more career-oriented women would choose careers over children. Hakim predicted that among women who prioritize working careers over family life, a high proportion would remain childless by choice, and additionally some working women would do so for more circumstantial reasons. However, Hakim’s (2005) research found that although a higher proportion of professional women remain childless, childless women were not especially “career-oriented” and most of them are in low or middle grade occupations.
3. Materials and methods 3.1. Defining and measuring childlessness We understand childlessness as the absence of biological or adopted children in an individual’s life. With the postponement of age at first birth, most adults in contemporary Europe are nowadays childless for at least one decade. Lifetime childlessness or permanent childlessness means that an individual has not had children by the end of their reproductive life, which for women is around 50 years and for men has no clear upper limit. Actually, today very few European men or women become parents after reaching 45 years or even after turning 40 years (Billari et al. 2007). Thus we also use 40-45 years as an estimate of lifetime childlessness. This definition follows the standards of our data sources although if obviously excludes many forms of parenthood. Childless people may have acted as parents to children not 6
included here, for example, as foster parents and parents taking care of their partner’s children. Individuals who will eventually remain childless have usually had around 30 years of potential childbearing. Reasons for childlessness include psychological, structural, medical, ideological or circumstantial factors. It is rarely known at exactly which age these various factors shape intentions, health and behaviour in order to either encourage or suppress childbearing. Here, we will study country differences in the final levels of childlessness, which are known only when individuals have reached 40 or 50 years, with retrospective cohort data. Additionally, we also explore ideals and intentions with regards to childlessness. Fertility intentions can be assumed to be especially influential among people in their 20s and early 30s, and may partially predict future levels of childlessness. They also set the scope for policy goals: if all childlessness would be desired, there is no problem needing intervention. Childlessness can result from different factors (Graham et al. 2013). One can distinguish between involuntary childlessness (e.g. infertility), intended childlessness (those who do not intend to have children), voluntary childlessness (the “childfree”), and temporary childlessness related to circumstantial or delayed childbearing, which is neither voluntary nor involuntary (Graham et al. 2013). In practice, however, the distinction is complicated. Circumstantial childlessness may be related to factors – such as a lack of a suitable partner – over which individuals may have little discretion, thus blurring the distinction between involuntary and voluntary childlessness. Many women delay pregnancy to the point that it becomes unlikely or impossible, in which case voluntary postponement is transformed into involuntary childlessness (Rowland 1998). This highlights the importance of the temporal dimension in this type of study and the useful distinction between temporary (a status that can change) and permanent childlessness (Bloom and Pebley 1982). The same childless individual can experience several of these stages during his or her life. Similarly, the boundary between choice and constraint may be indistinct in many cases. For instance, failure to form a union may depend on choice (women may have lower preferences for family life) or on circumstances (inability to find a suitable partner) or a combination of both (Tanturri and Mencarini 2008). Measuring voluntary childlessness is tricky. Respondents who in surveys report that they do not intend to have any children may do so for very different reasons: medical reasons, the lack of a proper partner and/or economic resources, or choosing a childfree lifestyle. Here, we define as intentionally childless adult respondents who do not have and do not intend to 7
have any children, and as voluntarily childless (or “childfree”) those among the intentionally childless who report zero children as their personal fertility ideal. 3.1.1. Gender differences in childlessness Male childlessness is usually higher than female childlessness, which can be attributed to three reasons. First, men can have children later in life, while most fertility data covers only ages up to 49 years. However, very few men, approximately 1-3 percentages at most, do become fathers at older ages in contemporary Europe. This is because most men have female partners who are not much younger than they are themselves. Second, not all men know they have become fathers or are registered in data sources as fathers (while other men may not actually be the biological fathers of their children although registered as such). Both these types of fathers also constitute a very small minority. For instance, mothers who give birth without registering any father constitute around two percent in contemporary Finland. Mistakenly attributed biological paternity has been estimated to represent around 3 percent in contemporary Western populations (Andersson 2000). Together, these two effects of unknown or mistaken paternity may be assumed to cancel each other out. Third, men have higher variance in fertility compared to females in most known human societies (reviewed in Betzig 2012). Childlessness is more common among men, but at the same time men oftenhave higher multipartner fertility compared to women (Lappegård & Ronsen 2013).
3.2. Data sources used 3.2.1. Data on male and female cohort childlessness Analyses include data on cohort childlessness from all European countries for which we could find data. Additionally we include data from the United States and Australia. The data was compiled from available registers and surveys as listed in Appendix Table 1. If no other reliable sources were available, we used the Gender and Generations Survey Wave I. GGS data was also used to study associations between education and childlessness for men and women.
8
3.2.2. Data on macro-level indicators Macro-level indicators studied include data on marital rates and age at first marriage, total divorce rate and age at first birth. We also collected data on female educational attainment, labour force participation rate, and female and male unemployment. Data on value change include attitudes towards children in marriage, and how important it is seen for a woman to have children, and Inglehart’s post-materialism index (asking respondents to name which they think are the first and second most important aims of the respondents country: maintaining order in the nation; giving people more say in important government decisions; fighting rising prices; protecting freedom of speech). 3.2.3. Eurobarometer data on fertility intentions To study intended childlessness, we use the family planning module of Eurobarometer survey that was collected in 2011. Relevant questions related to the actual number of children, the personal ideal number of children (“For you personally, what would be the ideal number of children you would like to have or would have liked to have had?”), and the intended number of children (“How many (more) children do you intend to have?”). We included respondents’ education level (primary, secondary and higher education) and occupational status (selfemployed-managerial-white collar, employee-manual worker-not working) as indicators of social status in the analysis.
4. Trends in female and male childlessness First, we study changes in proportions of childless individuals across birth cohorts in different European countries and in the United States and Australia. 4.1. Changes in female cohort childlessness Cohort childlessness has been increasing throughout Europe (see Appendix Tables 2a-b for all and most recent female birth cohorts). There is also clear regional variation. Figures 1a-g illustrate these changes by geographical regions.
9
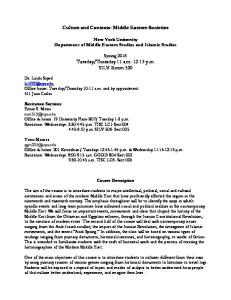
Figure 1a-g: Proportions of childlessness in different European regions, women born around 1935–1970.
%
Southern Europe 24 22 20 18 16 14 12 10 8 6 4 2 0 1920
1925
1930
1935
1940
1945
1950
1955
1960
1965
-1924
-1929
-1934
-1939
-1944
-1949
-1954
-1959
-1964
-1969
Greece
Italy
Spain
Portugal
%
Central-Eastern Europe 24 22 20 18 16 14 12 10 8 6 4 2 0
1920
1925
1930
1935
1940
1945
1950
1955
1960
1965
-1924
-1929
-1934
-1939
-1944
-1949
-1954
-1959
-1964
-1969
Bosnia and Herzegovina Czech R. Poland Slovenia
Bulgaria Hungary Romania
10
Croatia Macedonia Slovakia
%
Eastern Europe and Baltic countries 24 22 20 18 16 14 12 10 8 6 4 2 0 1920
1925
1930
1935
1940
1945
1950
1955
1960
1965
-1924
-1929
-1934
-1939
-1944
-1949
-1954
-1959
-1964
-1969
Georgia
Russia
Estonia
Latvia
Lithuania
%
Central Europe 24 22 20 18 16 14 12 10 8 6 4 2 0 1920
1925
1930
1935
1940
1945
1950
1955
1960
1965
-1924
-1929
-1934
-1939
-1944
-1949
-1954
-1959
-1964
-1969
Germany-T
Germany-W
Germany-E
11
Austria
Switzerland
Western Europe 24
22 20 18 16
%
14 12
10 8 6 4 2 0 1920
1925
1930
1935
1940
1945
1950
1955
1960
1965
-1924
-1929
-1934
-1939
-1944
-1949
-1954
-1959
-1964
-1969
Belgium
France
Ireland
Netherlands
UK (England & Wales)
%
Nordic countries 24 22 20 18 16 14 12 10 8 6 4 2 0 1920
1925
1930
1935
1940
1945
1950
1955
1960
1965
-1924
-1929
-1934
-1939
-1944
-1949
-1954
-1959
-1964
-1969
Denmark
Finland
Norway
12
Sweden
US and Australia 24 22 20 18 16
%
14 12 10 8 6 4
2 0 1920
1925
1930
1935
1940
1945
1950
1955
1960
1965
-1924
-1929
-1934
-1939
-1944
-1949
-1954
-1959
-1964
-1969
US
Australia
The female cohort born in Europe right after the war, in 1945 to 1949, has the lowest proportion of childless women, around 8–10 per cent. There are more childless women both in older and younger birth cohorts: typically around 16 % but sometimes even around 20 %. In the USA and Australia childlessness was as its lowest (6 and 9 %, respectively) in the cohorts born in 1930s. In the Eastern European socialist countries (and in Greece) the lowest proportion of childless was attained for the cohort born in the 1950s and is as low as around six per cent. In recent female birth cohorts, levels of childlessness are still very low (below or at 10%) in Bulgaria, the Czech Republic, Estonia, Hungary, Lithuania, Poland, Portugal, Romania and Russia. With the exception of Portugal, all of these countries were part of the state socialist block until the early 1990s. Levels are moderate (between 11 and 15%) in France, Belgium, Georgia, Germany, Norway, Slovak Republic, Slovenia, Sweden, and the US, and high (around 20%) in Austria, Italy, Finland, the Netherlands and the UK. (Figure 1a-g) 4.2. Changes in female childlessness 1990–2010 Changes in the proportion of childless women among recent cohorts are illustrated by comparing the proportions of childless women at ages 40–44 in 1990 (for two countries 1980) and 2010 (for some countries 2000; see Appendix Tables 2a-b).
13
Figure 2: Proportion of childless women at age 40–44, around 1990 and 2000/2010 Proportion of childless women at age 40-44, around 1990 and 2000/2010 25
20
%
15
10
5
Russia Macedonia Slovakia Slovenia Czech R Latvia Lithuania Serbia and… Croatia Poland Estonia Romania Denmark Bulgaria France Hungary Norway Greece Portugal Georgia Sweden Belgium Germany-T Australia Netherlands UK Ireland Austria Finland Italy Swizerland Canada US
0
1990
2000/2010
Data are for 2010 except for 2000 for Croatia, Macedonia, Romania, Serbia and Montenegro, Slovakia, Slovenia, Greece, the Netherlands, Russia and Latvia; and for 1990 except for 1980 for Austria and Australia.
Childlessness among women born 1945–49 (who were 40–44 years old in 1990) is usually lower than among women born in 1955–59 or 1965–69 (who were 40–44 years old in 2000 or 2010). During the last two decades, childlessness has increased in most countries depicted here. Figure 3 illustrates the change in the proportions of childless women. The increase from 1990 until 2010 has been greatest in Italy and Australia, as well as in Austria, Finland and the UK. In contrast, in many eastern European countries, childlessness decreased from 1990 to 2000 although the initial proportion in these countries was very low. However, during the last decade, from 2000 to 2010, childlessness started to increase again, the increase being the greatest in Estonia, Hungary, the Czech Republic and Bulgaria, countries with low childlessness in the older cohort. Of countries with initially higher childlessness, the recent increase has been strongest especially in the UK, Finland, Austria and Australia between 2000 and 2010. Interestingly, in both Sweden and Denmark the proportions of childless women have slightly declined during the last decade.
14
Figure 3: Changes in proportions of childless women at age 40-44 years Changes in proportions of childless women at age 40-44 years 2000 compared to 1990
2010 compared to 2000
2010 compared to 1990
Switzerland Australia Sweden Norway Finland Denmark Lithuania Latvia Estonia Russia UK Austria Italy Slovenia Serbia and.. Romania Hungary Czech R Croatia Bulgaria -4
-2
0
2
4
6
8
10
12
Change: percentage points
4.3. Childless women at 30-34 years Next, we present the proportions of younger women who have not yet have children. As Figure 4 shows, these have increased in all countries studied here without exception. While this is indicative of postponement of parenthood and not necessarily of lifetime childlessness, the early 30s remain the prime time for childbearing among European women, and a higher proportion of childlessness at that age can be assumed to predict higher overall lifetime childlessness and lower fertility overall in this age cohort.
15
Figure 4: Proportions of childless women at 30-34 years, selected countries Proportions of childless women at age 30-34 around 1990 and 2000/2010, and changes in the proportions 50
25
45
% childless
35
15
30 25
10
20 5
15 10
Change, percentage points
20
40
0
5 -5 Russia Slovakia Latvia Macedonia Lithuania Georgia Romania Slovenia Poland Croatia Serbia and.. Estonia Bulgaria Czech R Belgium France Norway UK Greece Switzerland Germany-T Sweden Hungary Finland Australia Austria Netherlands Italy Ireland Portugal Denmark Canada US
0
1990
2000 or 2010
change 2000 to 2010
change 1990 to 2000
Note. Australia and Austria have data from 1980 not 1990. Russia, Slovakia, Latvia, Romania, Slovenia, Croatia, Serbia and Montenegro, Greece, the Netherlands and Italy have data from 2000, not 2010.
4.4. Male childlessness For men, much less data are available than for women. Appendix Tables 3a show compiled available data for men who have completed their childbearing (aged 50-55 years) and Appendix Table 3c shows estimates for more recent male cohorts. For most European countries the best available comparative data are from the Gender and Generation Surveys (Appendix Table 3b). However, these data are based on relatively small samples and are thus not necessarily very accurate. Figure 5 shows the proportions of childless men in three age groups in contemporary Europe, as measured by the Gender and Generations Survey and Nordic register data. Among men in their early thirties Italy, the Netherlands, Germany and Austria have the highest proportion of childlessness at around 60 % or more, and Romania, France, Poland, Lithuania and Russia have the lowest, below 40 %. For men who are ten years older and in their early forties, the country order is somewhat different: the Netherlands, Germany, Finland, the Czech Republic and Italy have proportions above 25 %. When we look at the closest proxy for lifetime childlessness, the age group 45–49 (male cohorts born around 195616
65), in the top are Finland, Italy, Germany, the UK and the Czech Republic with around one out of four men remaining childless, while Estonia, Russia and Georgia have only one in ten childless men. It would be interesting to know if men are exhibiting more of a postponement behaviour in countries such as the Netherlands and Austria, or whether these countries are experiencing a cohort change so that significantly more men will end up childless compared to slightly older cohorts.
Figure 5: Proportions of childless men at ages 30-34, 40-44, and 45-49 years around 2005/2010. Childless men at ages 30-34, 40-44, and 45-49 years around 2005/2010 80 70 60
%
50 40 30 20 10
30-34 years
40-44 years
Italy
Netherlands
Germany-T
Austria
Finland
Sweden
UK
Czech R
Swizerland
Norway
Belgium
Hungary
Bulgaria
Estonia
France
Poland
Georgia
Lithuania
Romania
Russia
0
45-49 years
Data source: GGS (2003-2010) except Understanding Society Survey 2009-12 for the UK, and national register data for Finland, Norway and Sweden, Swiss Household Panel 2010 for Switzerland.
Of the countries studied here, Georgia is also the only one where male childlessness is not higher than female childlessness (Figure 6). The ratio between proportions of childless men and women ranges from 0.86 in Georgia to 2.24 in the Czech Republic and is on average 1.56.
17
Figure 6: Proportions and ratio of childless men and women aged 45–49 in 2000/2010 Proportions and ratio of childless men and women aged 45-49 in 2000/2010 30
2.5
25
2
%
1.5 15 1
Sex ratio
20
10 0.5
5 0
0
Men
Women
Sex ratio
Data source: GGS/Register data; SHP for Switzerland. Note: For women the estimations of childless individuals differ from other cohort data for this age group with regards to the Czech Republic and Estonia.
4.5. Educational differences in childlessness For estimating educational differences in childlessness in various countries, we use data from Gender and Generations Survey in 2005-2010. Data in Figures 7 and 8 thus refers to male and female cohorts born around 1960-1970. In most countries, higher female education is still related to childlessness (Figure 7). However, the educational gradient appears to be weak in some of them, including Belgium, Estonia and Norway. In three countries (Finland, Hungary, and Russia), women with only a basic level education show the highest childlessness rates. In many countries, the lowest proportions of childlessness are found among women with a medium-level education. Such a U-shaped pattern of female childlessness can be found in Czech R, Estonia, Finland, Georgia, Germany, Hungary, Poland and Romania. For men, the association between educational level and childlessness has not changed much in recent cohorts (Figure 8). Less-educated men have the highest rates of childlessness in 13 of 19 countries.
18
Figure 7. Childlessness at age 40-44 by educational attainment, women around 2005-2010 Childlessness and educational level, women aged 40-44 ISCED 0-2
ISCED 3-4
ISCED 5-6
35 30 25
%
20 15 10 5 0
For six countries (Bulgaria, Italy, the Netherlands, Norway, Switzerland and the UK), childlessness rates are highest among highly educated men. Since more men than women will still become parents after the age of 40, postponement of parenthood is likely to alter male childlessness more than female in these age groups. Postponement is also likely to affect highly educated men more than other groups. Thus for Italy, the Netherlands, Switzerland and the UK, as well as for the two countries (Estonia and Georgia) in which men with a median level of education have the lowest levels of childlessness, childlessness among more educated men may yet decrease somewhat from what is depicted in Figure 8. In sum, higher childlessness is usually more common among highly educated women and less educated men, but with a certain degree of variability between countries. In some western European countries these associations may be weakening or disappearing.
19
Figure 8. Childlessness at age 40-44 by educational attainment, men around 2005-2010 Childlessness and educational level, men aged 40-44
%
ISCED 0-2
ISCED 3-4
ISCED 5-6
50 45 40 35 30 25 20 15 10 5 0
5. Associations between country indicators and childlessness After presenting descriptive cohort trends for men and women, we now analyse how these trends relate to other country-level macro-indicators. We mostly analyse relationships with macro indicators for two female cohorts: the older cohort, born in 1940–44, and the younger cohort, born in 1960–69. Sometimes we also present results for the middle, 1950–54 birth cohort. Table 1 depicts linear OLS regression coefficients for our chosen indicators and two different cohorts of female childlessness. Statistically significant associations are marked in bold. The strongest of statistically significant associations are found between cohort fertility rates and mean ages at first birth and at first marriage.
20
Table 1: Associations with cohort childlessness and various demographic indicators, regression coefficients (N=23). Demographic indicators Cohort fertility rate Mean age at first birth Ever-married at 35-39 Mean age at first marriage Total divorce rate Women's social position Tertiary education, Females Female employment Values Post-materialist values % Children important for marriage Children important for a woman
Cohort 1940-44
Cohort 1960-69
3.92 /-0.56* 1.93 -0.355 2.18 -3.61
-1.88 / -7.57* 1.53 -0.22 1.30 4.73
0.04 -0.07
0.11 -0.14
0.14
0.39
-0.13
-0.14
-0.03
-0.11
Statistically significant associations (p