Journal of Sustainable Development in Africa (Volume 14, No.8, 2012) ISSN: 1520-5509 Clarion University of Pennsylvania, Clarion, Pennsylvania CAPITAL FLOWS- GROWTH NEXUS IN NIGERIA: HAS FOREIGN DIRECT INVESTMENT PLAYED A ROLE IN ACCELERATING ECONOMIC GROWTH? Ismail Olaleke Fasanya Department of Economics, University of Ibadan, Ibadan, Nigeria ABSTRACT Despite the increased capital flows to African countries, including Nigeria, many African countries are still characterized by low per-capita income and high unemployment rates, foreign direct investments are theoretically and empirically supposed to solve these problems. The Nigerian government has been focusing on policies that will help attract foreign investors and yet the economy is still dwindling. It is against this background, that this study analyzed the impact of foreign direct investment on the economic growth in Nigeria for the period 1970-2010 making use of annual time series data through a neo-classical framework. The findings show that foreign direct investments have positive impact on economic growth in Nigeria and so does domestic investment. The study therefore recommends that for the country to effectively reap the benefits of foreign and domestic investments, its economic planners should create a healthy and enabling business environment that encourages both foreign and local investors, provide incentives for innovation and skills improvement, and contributes to competitive corporate climate. Keywords: Foreign Direct Investment, Domestic Investment, Policy, Economic Growth, Cointegration INTRODUCTION The relationship between the inflow of foreign direct investment (FDI thereafter) and economic growth in the host country has become one of the most debated issues in the empirical literature. This issue has attracted the attention of many scholars over the past half-century. The question bears upon whether FDI promotes economic growth or it is only being attracted by favourable economic conditions in the host country and by profits. The empirical evidence obtained from these extensive studies have been mixed. On one side of these empirical studies are those who suggest that the relation is positive. At the other extreme are those who conclude that the association between FDI and growth is negative (Easterly et.al. 1997). FDI is thought to be promoting growth through the capital, technological know-how that it brings into the recipient country. By transferring knowledge, FDI will increase the existing stock of knowledge in the host country through labour training, transfer of skills, and the transfer of new managerial and organisational practice. FDI will also promote the use of more advance technologies by domestic firms through capital accumulation in the domestic country (De Mello, 1997, 1999). Finally, FDI is thought to open up export markets and to promote domestic investments through the technological spillovers and the resulting productivity increase. Overall FDI is thought to be more productive than domestic investments. Indeed, as Graham and Krugman (1991) argue, domestic firms have better knowledge and access to markets,
34
so for a Multinational Corporation (MNC thereafter) to enter it must have some advantages over the domestic firms. Therefore, it is likely that the MNC will have lower costs and be more productive thanks to technology and know-how. On the other hand, it has been argued that FDI and the attached technology transfer may be costly for the host country. It has been argued that MNCs capital contribution is greatly reduced by their tendency to repatriate profits. Stewart (1981, 1984) argued that the technology transferred by MNCs was likely to be inappropriate for the LDCs resource and factor endowments, including human capital. She also argued that by bringing in inappropriate products, FDI might affect the social and cultural norms of the host country. Zhang and Ram (2002) pointed out that FDI is also thought to affect negatively domestic enterprise as the latter will struggle to compete with the powerful MNCs, which could affect domestic investment negatively. In the face of inadequate resources to finance long-term development in Africa and with poverty reduction looking increasingly bleak, attracting FDI has assumed a prominent place in the strategies of African countries. The experience of a small number of fast-growing East Asian newly industrialized economies has strengthened the belief that attracting FDI could bridge the resource gap of low-income countries and avoid further build-up of debt while directly tackling the causes of poverty (UNCTAD 2004). While FDI has been flowing to different regions of the world in growing proportions, Africa has been receiving the least of global FDI inflows. African countries, like many developing countries need a substantial inflow of external resources in order to make up for the savings and foreign exchange gaps associated with a rapid rate of capital accumulation. Africa also needs growth to overcome widespread poverty and Africa’s development crisis is unique as it is the poorest region in the world and remains mired in debt (Sachs 2004). Since FDI can create employment and act as a vehicle of technology transfer, provide superior skills and management techniques, facilitate local firm’s access to international markets and increase product diversity, FDI can therefore be an engine of economic growth and development in Africa where its need cannot be overemphasised (Ngowi 2001). The UNCTAD World Investment Report 2006 shows that FDI inflow to West Africa is mainly dominated by inflow to Nigeria, who received 70% of the sub regional total and 11% of Africa’s total. Out of this, Nigeria’s oil sector alone receives 90% of the FDI inflow. This recent improved performance in FDI inflow to Nigeria calls for the need to investigate the factors that determine its inflow. This study focuses on FDI flow to Nigeria, which is poor in terms of income but rich in natural resources. Nigeria is an economy that is over depending on the oil sector. This has also been seen to be responsible for deficiency in investment capital in the country. Amadi (2002) opined, “With oil as the main source of foreign exchange, a one-product mono-cultural economy must be continuously deficient in investment capital. Oil is subject to the vagaries of international capitalism. Therefore, revenue from it must be subject to serious fluctuations”. This situation in the country has created savings and foreign exchange gap. This culminates to a wide gap between the actual domestic investment fund and the required investment for accelerating economic growth. So, foreign capital has been regarded as an alternative to bridge the gap. Consequently, for any country, like Nigeria, with this investment gap to achieve a desired rate of economic growth, FDI has to be given due consideration. This is because FDI provides funds from other parts of the world to bridge the investment gap. 35
In Nigeria, FDI has been given prominence by past and present administrations. This is because they see it as an antidote for slow rate of economic growth, which has been experienced in the country. The federal government of Nigeria has, since 1986, embarked on sustained effort to encourage FDI. The most significant of those policy measures was the introduction of the Structural Adjustment Programme (SAP), which provided the basis for deregulation of the economy (CBN, 2001). The country has witnessed high inflow of FDI as a result of investment in the telecommunication sector. The oil sector of the economy has also witnessed an increased level of FDI as evidenced by the increasing numbers and operations of oil Multinationals Corporation in the country. However, there have been a lot of controversies in the country over the effectiveness of foreign investment in stimulating the rate of economic growth. It is this controversy that the study intends to settle. Against this background, a research work of this nature to evaluate the impact of foreign direct investment on economic growth in Nigeria is considered inevitable at this time. Foreshadowing our main results, we find evidence that foreign direct investment has positive impact on economic growth in Nigeria similarly with domestic investment but domestic investment is significant on economic growth in Nigeria. However, population growth, government consumption, domestic investment and exchange rate are statistically significant while the remaining variables are rejected based on the fact that their calculated values are less than their tabulated values. Above all, foreign direct investment to the Nigerian economy has positive impact on growth of GDP though not significant. The remainder of the paper is organized as follows. Section two deals with the literature review. In Section three, the methodological framework of the study is pursued while the empirical results are discussed in section four. Section five concludes the paper. REVIEW OF RELATED STUDIES Many empirical works are available in the economic literature showing the causal relationship between FDI and growth. A number of early studies have generally reported an insignificant effect of FDI on growth in developing host countries. FDI may have negative effect on the growth prospect of the recipient economy if they give rise to a substantial reverse flows in the form of remittances of profits, particularly if resources are remitted through transfer pricing and dividends and/or if the transnational corporations (TNCs) obtain substantial or other concessions from the host country. For instance, Singh, (1988) found FDI penetration variable to have a little or no consequences for economic or industrial growth in a sample of 73 developing countries. In the same way (Hien, 1992) reported an insignificant effect of FDI inflows on medium term economic growth of per capita income for a sample of 41developing countries. At the firm level, several studies provided evidence of technological spillover and improved plant productivity. At the macro level, FDI inflows in developing countries tend to “crowd in” other investment and are associated with an overall increase in total investment. Most studies found that FDI inflows led to higher per capita GDP, increase economic growth rate and higher productivity growth (see De Mello 1997, Kumar and Siddharthan 1997, & Saggi 2000) FDI increases technical progress in the host country by means of a contagion effect, (Findlay, 1978) which eases the adoption of advanced managerial procedures by the local firms. Similarly (De Gregorio, 1992) analyzed a panel of 12 Latin American countries in the period 1950-1985. His results suggest a positive and significant impact of FDI on economic
36
growth. In addition the study shows that the productivity of FDI is higher than the productivity of domestic investment. While, (Fry, 1992) examined the role of FDI in promoting growth by using the framework of a macro-model for a pooled time series cross section data of 16 developing countries for 1966-88 period. For his sample as a whole he did not find FDI to exert a significantly different effect from domestically financed investment on the rate of economic growth, as the coefficient of FDI after controlling for gross investment rate was not significantly different from zero in statistical terms. FDI inflows had a significant positive effect on the average growth rate of per capita income for a sample of 78 developing and 23 developed countries as found by (Blomström et.al, 1994). However, when the sample of developing countries was split between two groups based on level of per capita income, the effect of FDI on growth of lower income developing countries was not statistically significant although still with a positive sign. They argue that the least developed countries learn very little from MNEs because domestic enterprises are too far behind in their technological levels to be either imitators or suppliers to MNEs. In this regard, another study was conducted by (Borensztein, et.al, 1995) he included 69 developing countries in his sample. The study found that the effect of FDI on host country growth is dependent on stock of human capital. They infer from it that flow of advanced technology brought along by FDI can increase the growth rate only by interacting with country’s absorptive capability. They also find FDI to be stimulating total fixed investment more than proportionately. In other words, FDI crowds-in domestic investment. However, the results are not robust across specifications. Export-oriented strategy and the effect of FDI on average growth rate for the period 1970-85 for the cross-section of 46 countries as well as the sub-sample of countries that are deemed to pursue export-oriented strategy was found to be positive (Balasubarmanyam, et.al, 1996) and significant but not significant and sometimes negative for the sub-set of countries pursuing inward-oriented strategy. Accordingly (Sanchez-Robles, 1998) explored empirically the correlation among public infrastructure and economic growth in Latin America in the period 1970-1985. She also found a positive and significant impact of FDI on the economic growth of the countries of this area. Another economist (De Mello 1999) also conducted time series as well as panel data estimation. He included a sample of 15 developed and 17 developing countries for the period 1970-90. The study found strong relationship between FDI, capital accumulation, output and productivity growth. The time series estimations suggest that effect of FDI on growth or on capital accumulation and total factor productivity (TFP) varies greatly across the countries. The panel data estimation indicates a positive impact of FDI on output growth for developed and developing country sub-samples. However, the effect of FDI on capital accumulation and TFP growth varies across developed (technological leaders) and developing countries (technological followers). FDI has a positive effect on TFP growth in developed countries but a negative effect in developing countries but the pattern is reversed in case of effect on capital accumulation. De Mello infers from these findings that the extent to which FDI is growth-enhancing depends on the degree of complementarity between FDI and domestic investment, in line with the eclectic approach given by (Dunning, 1981). The degree of substitutability between foreign and domestic capital stocks appears to be greater in technologically advanced countries than in developing countries. Agosin and Mayer, (2000) analyzed the effect of lagged values of FDI inflows on investment rates in host countries to examine whether FDI crowds-in or crowds-out domestic investment over the 1970-95 period. They conclude that FDI crowds-in domestic investment in Asian countries crowds-out in Latin American countries while in Africa their relationship is neutral (or one-to-one between FDI and total investment). Therefore, they conclude that effects of FDI
37
have by no means always favourable and simplistic policies are unlikely to be optimal. These regional patterns tend to corroborate the findings of (Fry, 1992) who also reported East Asian countries to have a complementarity between FDI and total investment. In another study by (Pradhan, 2001) found a significant positive effect of lagged FDI inflows on growth rates only for Latin American countries. He used a panel data estimation covering 1975-95 period for 71 developing countries. The study sheds light that the effect of FDI was not significantly different from zero for the overall sample and for other regions. Tang et al. (2008) examined the causal link between foreign direct investment, domestic investment and economic growth in China over the period 1988-2003. The authors confirmed a unidirectional causality that runs from foreign direct investment to domestic investment and to economic growth. Abdus (2009) analyzed the relationship between foreign direct investment and economic growth for 19 developing countries of South-East Asia and Latin America. The author employed the co-integration technique, Granger causality test and Error Correction Model (ECM) to analyze the variables. The author discovered a unidirectional causality that runs from economic growth to foreign direct investment for five countries in Latin America and one country in East and South East Asia. For studies conducted in Nigeria, Oyaide (1977) study the role of direct foreign private investment in the economic development of Nigeria. Using indexes of dependence and development as parameters of Nigeria’s economic dependence and development, he suggested that studies on the role of foreign investment in host countries should entail time series analysis of specific features of the host countries and of technology by which reveals it’s most important effects as a means of delineating the need and proper use of foreign investment in economic growth. He concluded that foreign private investment caused both economic dependence and development. Eke (2003) in their study used causality test to analyze the impact of FDI on economic growth in Nigeria. They investigated the causal test from foreign private investment to GDP and causality test from GDP to foreign private investment. The results indicate that causality runs in both directions. They concluded that foreign direct investment is relevant and also a significant determinant of real development in Nigeria, however, foreign capital inflow is growth – path dependent. Using least squares technique on annual data for 1962 – 1974, Obadan (1982) supports the market size hypothesis confirming the role of protectionist policies (tariff barriers). The study suggests taking the cognizance factors such as market size, growth and tariff policy when dealing with policy issues relating to foreign investment to the country. A study conducted by Anyanwu (1998) on the economic determinants of FDI in Nigeria also confirmed the positive role of domestic market size in determining FDI inflow into the country. This study noted that the abrogation of the indigenization policy in 1995 significantly encouraged the flow of FDI into the country and that more effort is required in raising the nation’s economic growth so as to attract more FDI. Iyoha (2001) examined the effects of macroeconomic instability and uncertainty, economic size and external debt on foreign private investment inflows. He shows that market size attracts FDI to Nigeria whereas inflation discourages it. The study confirms that unsuitable macroeconomic policy acts to discourage foreign investment inflows into the country. Anyanwu (1998) and Iyoha (2001) have studied on the determinants of FDI in Nigeria. Major limitations of these studies are the traditional econometric technique and nonconsideration of natural resource in determination of FDI inflow. Using time series econometric technique on annual data of Nigeria, this study examines the effect of the country’s natural resource export, along with openness, market size and macroeconomic risk variables like inflation and foreign exchange rate on FDI inflow during 1970-2006. Omisakin et al. (2009) investigated causal and long-run interrelationships among foreign direct investment, trade openness and growth between 1970 and 2006 through the Toda-Yamamoto non-causality test and auto regressive distributed lag techniques to
38
analyze the relationships among the variables. The results indicated that a unidirectional causality runs from foreign direct investment to output growth. Oyejide (2005) provided conceptual framework for the analysis of the macroeconomic effects of volatile capital flows and concluded that capital flows have their pros and cons. This however depends on the initial conditions of the developing economy concerned. It can stimulate growth of the real sectors when the initial conditions are right. It could retard growth however, due to macroeconomic shocks that could undermine the stability of real sector and impose higher adjustment cost on the economy. The paper therefore recommends capacity building as a way of maximizing benefits and minimizing risks from capital flows. Otepola (2002) examines the importance of foreign direct investment in Nigeria. The study empirically examined the impact of FDI on growth. He concluded that FDI contributes significantly to growth especially through exports. This study recommends a mixture of practical government policies to attract FDI to the priority sectors of the economy. Akinlo (2004) investigates the impact of FDI on economic growth in Nigeria using data for the period 1970 to 2001. His error correction model (ECM) results show that both private capital and lagged foreign capital have small and insignificant impact on economic growth. This study however established the positive and significant impact of export on growth. Financial development which he measured as M2/GDP has significant negative impact on growth. This he attributed to capital flight. In another manner, labour force and human capital were found to have significant positive effect on growth. In short, the results of research on the relation between FDI and growth vary depending upon the models, data and countries of analysis. Therefore, the debate over the impact of FDI on growth is on-going and left open to further study. METHODOLOGY AND DATA The main purpose of the study is to quantify the impact of FDI on economic growth in Nigeria. The time period for study is 1970-2010, based on the grounds that Nigeria started receiving significant amount of FDI inflows after the 1970s. The empirical model used in this study is motivated by neo-classical growth model. This section discusses the model specifications to examine the relationships between foreign direct investment and growth. There are four major variables in the model: output (Y), capital (K), labour (L), and “knowledge” or “effectiveness of labour” (A). That is the model is derived, in conventional manner, which takes the form:
The production function follows a constant return to scale (CRS), if output is expressed in unit of effective labour input, we have
The production function satisfies, f (0) = 0, f’ (0) = ∞, f’ (∞) = 0, f’ (k) > 0, f” (k) < 0 The production function takes the form of Cobb-Douglas process
Given that k = K /AL, changes in stock of capital labour ratio over time is given as:
39
That is the rate of change in stock of capital per labour is determined by the difference between actual investment per unit of effective labour and the break-even investment. An increase in s shifts the actual investment, sf (k) upward so that k* rises. This leads to a gradual rise in
k& s causes a temporary until it in equilibrium with k*. A permanent increase in
rise in k. That is k rises for sometime but reaches a stage where any additional s is only used to maintain a constant k. Similarly, a rise in s leads to an initial increase in growth rate of output per man hour, g, until it reaches a higher level where it rises no more. Overall, a change in the s has a level effect, but not a growth effect on output per man hour. The equation describing the evolution of the capital stock per unit of effective labour is given by: Using the intensive Cobb-Douglas form –f (k) =kα, this yield:
The balance growth path, k is zero i.e. investment per unit of effective labour is equal to break-even investment per unit of effective labour and so k is constant. Denoting the balanced- growth –path value as k*, we have Rearranging to solve for k* yields:
To get the balanced-growth-path value of output per unit of effective labour into the intensive form of the production function i.e. y = kα, we have
By assuming (7) to be linear in logs, taking logs and differencing with respect to time, where lower case letters denote the rate of growth of individual variables. We obtain an expression describing the determinants of the growth rate of GDP, where s represents the policy instrument used by the government in the above theory. The monetary policy tool captures the rate of inflation and exchange rate. In addition, the growth rate of population is captured by (n) in the neoclassical balanced growth path in the above model while the growth rate of capital (g) can be broken down into foreign capital (foreign direct investment) and domestic capital. The fiscal policy tool is used to capture government expenditure. Following Akinlo (2004), we also include several other variables that often believed to have effect on growth. These changes yield the following growth equation:
Where GDPGR is the growth rate of GDP, POPGR is the growth rate of population which is a proxy for the growth rate of labour force, investment/GDP ratio represents the growth rate of domestic capital stock and FDI is the foreign Direct Investment. The rate of inflation and exchange rate captures the monetary policy tool and government expenditure is used to capture the fiscal policy. In the estimation of the model, several procedures are employed to establish the robustness of the relationship. First, the Ordinary Least Square (OLS) estimation methodology was adopted. This study also applies the error correction model 40
(ECM) framework (with particular attention given to causality) through Granger’s representation theorem (Engle and Granger 1987). The linear constructions of these variables are interpreted as long run static equilibrium relationships (Johansen, 1991). The equation is then estimated with an error correction term, which represents the speed of adjustment to out of equilibrium movements in the stated model.
Description of Variables and Data Sources Where GDPGR is the growth rate of GDP, POPGR is the growth rate of population which is a proxy for the growth rate of labour force, investment/GDP ratio represents the growth rate of domestic capital stock and FDI is Foreign Direct Investment. In the above model, trade openness is derived by the addition of import plus export divided by GDP. The rate of inflation and exchange rate capture the monetary policy tool and government consumption is used to capture the fiscal policy. In order to test the implications of our model, we collected an aggregate data on Foreign Direct Investment on Nigeria. The entire data set of Nigeria for which Foreign Direct Investment and all other relevant variables are reported over the 1970–2010 period. The economic growth rate is measured in this study as the growth of GDP. The data on GDP, inflation, exchange rate, import, export and government consumption are from the Central Bank Statistical Bulletin. The growth rate of population is used as a proxy for the growth rate of the labour force. The data on population are from the Penn World Data. The investment/GDP ratio is used as a proxy for the growth rate of the domestic capital stock. Since the investment/GDP ratio is not reported for Nigeria, gross fixed capital formation as a share of GDP is used to represent investment/GDP ratio. The data on Foreign Direct Investment are from the World Bank, World Development Indicators database. ESTIMATION ISSUES AND DISCUSSION OF RESULTS Descriptive Statistics The summary of the statistics used in this empirical study is presented in Table 1 below. As observed from the Table, the mean value of growth rate of GDP is 25.5918. FDI as a percentage of GDP (FDI/GDP) has the lowest mean value of 0.2941 and the mean value of exchange rate (EXR) has the highest mean value of 38.5047 whereas the mean values of population growth (POPGR), inflation (INF), trade openness (TRDOPN), government consumption as a percentage of GDP (GCON/GDP) and domestic investment as a percentage of GDP (INV/GDP) are 2.5479, 19.5550, 4.7344, 26.0988, 115.222 and 0.7242 respectively. The analysis was also fortified by the values of the skewness and kurtosis of all the variables involved in the models. The skewness is a measure of the symmetry of the histogram while the kurtosis is a
41
measure of the tail shape of the histogram. The bench mark for symmetrical distribution i.e. for the skewness is how close the variable is to zero while the case of the kurtosis is three (mesokurtic) but values lower than that is called platykurtic and above is referred to as leptokurtic. Therefore, population growth is the most skewed of the variables and all the variables are leptokurtic except for population growth and exchange rate that are platykurtic because of the reason given above. Table 1: Summary Statistics of the variables used in the regression analysis Variables
GDPGR
POPGR
FDI/GDP
INF
TRDOPN
EXR
GCON/GDP
INV/GDP
Mean
25.5918
2.5749
0.2491
19.5550
4.7344
38.5047
115.222
0.7242
Median
6.1316
2.5660
0.0441
13.6000
0.6988
7.7147
29.3559
0.3481
Maximum
550.532
3.1118
1.2018
72.8000
23.2571
148.900
482.171
3.4070
Minimum
-7.3219
1.9227
-0.0128
3.2000
0.0723
0.5464
5.19213
0.0303
Std. Dev.
91.2372
0.3643
0.3710
16.3524
6.6191
53.3481
139.560
0.8949
Skewness
5.1164
0.0040
1.5866
1.5989
1.4144
1.0171
1.2366
1.7575
Kurtosis
29.1739
1.7321
4.2920
4.9073
3.8032
2.2119
3.3745
5.1051
Obs.
41
41
41
41
41
41
41
41
SOURCE: Author’s computation Unit Root and Cointegration Test Time series properties of all variables used in estimation were examined in order to obtain reliable results. Thus, this exercise was carried out through Phillip-Perron (PP test). This development arises from the prevalence of substantial comovements among most economic time series data, which has been argued in the literature as undermining the policy implications that could be inferred from such modelling constructs (Engel and Granger, 1987). Table 2: Phillip-Perron Test (PP) Variables
PP Values
Mackinnon Critical Values
Order
of
Integration GDPGR
-6.231084*
-3.610453
I(0)
POPGR
-11.91621*
-3.615588
I(1)
FDI/GDP
-8.589779*
-3.615588
I(1)
INF
-3.069400**
-2.938987
I(0)
TRDOPN
-5.846199*
-3.615588
I(1)
EXR
-5.228276*
-3.615588
I(1)
GCON/GDP
-8.362204*
-3.615588
I(1)
INV/GDP
-6.248462*
-3.615588
I(1)
ECM
-7.117502*
-3.610453
I(0)
Source: Computed by the Researcher, 2012 Note: One, two and three asterisk denotes rejection of the null hypothesis at 1%, 5% and10% respectively based on Mackinnon critical values 42
The above results i.e. Phillip-Perron test shows that almost the variables are stationary at first difference except for growth of GDP and inflation. This means all the variables are integrated of order 1. Therefore, the PP method is adopted for the research work where the results show that all most all the variables are found to be stationary at 99 percent significance level in their first difference from with the assumption of constant. Therefore, all variables are nonstationary and integrated of order 1, 1(1). In determining the number of cointegrating vectors, trace test and maximum eigenvalue test using the more recent critical values of Mackinon-Haug-Michelis (1999) was applied. The assumption of no deterministic trend and restricted constant was for all the variables. The choice was tested using (AIC) and Schwartz Information Criterion (SIC). The result for both trace test and maximum eigenvalue for unrestricted cointegration rank test are presented in Table 3
43
Table 3: Johansen-Juselius Maximum Likelihood Cointegration Test Results Sample(adjusted): 1972 2010 Included observations: 39 after adjusting endpoints Trend assumption: Linear deterministic trend Series: GDPGR POPGR FDI/GDP INF TRDOPN EXR GCON/GDP INV/GDP Lags interval (in first differences): 1 to 1 TRACE STATISTIC Unrestricted Cointegration Rank Test Hypothesized
Trace
5 Percent
1 Percent
No. of CE(s)
Eigenvalue
Statistic
Critical Value
Critical Value
None **
0.964050
405.5486
192.89
204.95
At most 1 **
0.900312
279.1753
156.00
168.36
At most 2 **
0.844328
191.5585
124.24
133.57
At most 3 **
0.703248
120.8785
94.15
103.18
At most 4 *
0.554669
74.71392
68.52
76.07
At most 5
0.362439
43.97433
47.21
54.46
At most 6
0.282468
26.87032
29.68
35.65
At most 7
0.220032
14.25671
15.41
20.04
Max-Eigen
5 Percent
1 Percent
*(**) denotes rejection of the hypothesis at the 5%(1%) level Trace test indicates 5 cointegrating equation(s) at the 5% level Trace test indicates 4 cointegrating equation(s) at the 1% level MAX-EIGEN STATISTIC Hypothesized No. of CE(s)
Eigenvalue
Statistic
Critical Value
Critical Value
None **
0.964050
126.3733
57.12
62.80
At most 1 **
0.900312
87.61679
51.42
57.69
At most 2 **
0.844328
70.68004
45.28
51.57
At most 3 **
0.703248
46.16458
39.37
45.10
At most 4
0.554669
30.73959
33.46
38.77
At most 5
0.362439
17.10401
27.07
32.24
At most 6
0.282468
12.61361
20.97
25.52
At most 7
0.220032
9.443109
14.07
18.63
*(**) denotes rejection of the hypothesis at the 5%(1%) level Max-eigenvalue test indicates 4 cointegrating equation(s) at 1% levels SOURCE: Author’s Computation
44
From Table 3 above, it is observed that the Trace test statistic indicates five cointegrating equations at the 5% level of significance and four cointegrating equations at 1% significant level. While the Max-Eigenvalue test indicates four cointegrating equations at 1% significant level. Based on the evidence above, we can safely reject the null hypothesis (H0) which says that there are no cointegrating vectors and conveniently accept the alternative hypothesis of the presence of cointegrating vectors. Thus, we can conclude that a long run relationship exists among the variables. This result means that in Nigeria’s case, the hypothesis of no cointegration among the variables (GDPGR, POPGR, FDI/GDP, INF, TRDOPN, EXR, GCON/GDP and INV/GDP) should be rejected. The result of our cointegration test reveals that more than one cointegrating vectors exist among the variables of interest. This means that we can estimate the Error Correction Model. An Error Correction Model is designed for use with nonstationary series that are known to be cointegrated. The ECM has cointegration relations built into the specification so that it restricts the long-run behavior of the endogenous variables to converge to their cointegrating relationships while allowing for short-run adjustment dynamics. The use of the methodology of cointegration and ECM add more quality, flexibility and versatility to the econometric modeling of dynamic systems and the integration of short-run dynamics with the long-run equilibrium. The Error Correction Models were evaluated using the conventional diagnostic tests and the Akaike Information Criterion (AIC) and Schwartz Information Criterion (SIC) were adopted in choosing the appropriate lag length. The model with the lowest (AIC) and Schwartz Information Criterion (SIC) were adopted. The results are of the cointegrating relationship amongst the variables within the ECM framework are presented in Table 4 below. Table 4: Parsimonious Error Correction Estimates Dependent Variable: D(GDPGR) Method: Least Squares Variable
Coefficient
t-Statistic
Prob.
D(POPGR(-1))
305.8151
3.1006*
0.0047
D(FDI/GDP(-2))
13.8327
0.6736
0.5696
D(INF(-2))
0.7029
0.5145
0.6114
D(TRDOPN(-1))
-24.8659
-1.5798
0.1267
D(GCON/GDP(-2))
-1.5609
-2.1456**
0.0418
D(INV/GDP(-3))
26.0935
2.7957*
0.0098
D(POPGR(-2))
45.7255
0.4477
0.6603
D(EXR(-2))
-0.7533
1.6952***
0.0594
ECM(-1)
-0.0623
-2.0098**
0.0322
R-squared
0.5947
Adjusted R-squared
0.5302
F-statistic
2.4477
Prob(F-statistic)
0.0338
Durbin-Watson stat
2.118031
Source: Computed by the Researcher, 2012 Note: One, two and three asterisk denotes rejection of the null hypothesis at 1%, 5% and10% respectively.
45
Table 5: Diagnostic Tests Results TEST
RESULTS
PROB.
Ramsey RESET Test
12.88170
0.0007
Normality test
50.56697
0.00000
White Heteroskedasticity Test:
22.52111
0.3129
Breusch-Godfrey LM Test:
2.663907
0.2639
SOURCE: Author’s Computation
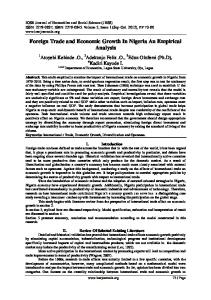
FIGURE 1: Stability Test
15 10 5 0 -5 -10 -15 1990
1995
2000
CUSUM
2005
5% Significance
1.6
1.2
0.8
0.4
0.0
-0.4 1985
1990
1995
2000
CUSUM of Squares
46
2005
5% Significance
DISCUSSIONS OF RESULTS Given the results of the cointegration test which revealed the existence of cointegration among variables in the GDPGR model, dynamic error correction model (ECM) is considered appropriate for the analysis. This analysis on the impact of foreign direct investment on GDP growth is presented in the table above. The results obtained from the dynamic model indicates that the overall coefficient of determination (R2) shows that the equation has a good fit with 59.47 percent of growth rate of GDP explained by the variables in the equation. The reason for being a good fit is that it is statistically above the bench mark of 50 percent. As the adjusted (R2) tends to purge the influence of the number of included explanatory variables, the (R2) of 0.5302 shows that having removed the influence of the explanatory variables, the model is still of good fit and the dependent variable explained by the equation by 53.02 percent, hence, in terms of the goodness of fit we can say that the test is fair. The Durbin Watson (D.W) statistics of 2.11 as it is not significantly farther from the bench mark, we can conclude that there is no auto- correlation or serial correlation in the model specification; hence the assumption of linearity is not violated. In terms of the signs and magnitude of the coefficients which signify the impact of foreign direct investment on GDP growth, it can be seen that all the variables except population growth, exchange rate, foreign direct investment and domestic investment concur with a’priori theoretical expectation. The reasons for this could be associated to the fact that growth in the telecommunication sector that has complemented the performance of the manufacturing sector of the economy thereby adding value to the growth rate of GDP. The inflation rate is used as a measure of overall macroeconomic stability of a country. The high inflation rate can serve as disincentive on FDI to a country as it increases the user cost of capital. From the estimation results it is also noted that domestic investment pulls more weight than foreign direct investment which could be as a result of trade intensity which refers to the ease with which capital can be moved in or out of a country by investors is negative. It is expected that the more open is the economy the higher it grows. Another reason for this could be the country with strong currency thereby repelling FDI investors in the country. The t-test values of the parameters estimates could be deduced from the computed regression result in the table above. However only population growth, government consumption, domestic investment and exchange rate are statistically significant while the remaining variables are rejected based on the fact that their calculated values are less than their tabulated values. It must be noted that all these three variables are statistically significant at one, five and ten percent respectively. The results confirm that growth of GDP in Nigeria has an automatic mechanism and that GDP growth in Nigeria responds to deviations from equilibrium in a balancing manner. A value of (-0.062) for the ECM coefficients suggests that a fast speed of adjustment strategy of roughly 6.2%. The significant coefficients of all exogenous variables clearly state that Nigeria’s economy growth rate of GDP depends on growth of population, foreign direct investment and domestic investment in the long run. Above all, foreign direct investment to the Nigerian economy has positive impact on growth of GDP. As for the effect of government spending on economic growth, although sound government policy is crucial, there seems to be a growing consensus that consistent and increasing government presence in an economy can hinder economic growth, especially in developing countries. The result is in consonance with the findings of, Aseidu (2003), Obinna (1983) and Ayanwale and Bamire (2001) but differ from the findings of Akinlo (2004) which shows that both foreign and domestic investment are insignificant to growth in Nigeria. The researchers discovered that if the political atmosphere is conducive for the establishment of more MNC corporation in Nigeria, there would be industrial
47
and technological changes and growth of the economy will be sustained. A graphical representation of the Cumulative Sum (CUSUM) and the Cumulative Sum of Square (CUSUMSQ) of the Recursive Residual are also established. The cumulative sum (CUSUM) and cumulative sum of squares (CUSUMSQ) plots which is shown in Figure 1 from a recursive estimation of the model also indicate stability in the coefficients over the sample period. CONCLUSION It became evident that Nigeria has witnessed a surge in the level of FDI flow in to its economy. Consequent upon this, the GDP level has also increased considerably, arguable potentials for growth existing within the economy. It should be emphasized that the country could benefit from increased FDI inflows into the country it is integrated into the economy. A major policy in this direction is the liberalization of the external sector. This will lead to increased private participation, higher employment with possible multiplier effects on the economy as a whole. As a matter of fact, the results suggest reduction in government size in the economy. This is better achieved through privatization of most government owned enterprises in the country. It will engender competition and greater efficiency. All the same, caution should be exercised to ensure that the necessary conditions for privatization are in place so as to avoid the failure experienced during the first privatization exercise in 1988. Government needs to provide the legal and administrative framework for effective privatization. More importantly, there is the need to ensure transparency in the exercise. The study also explores the crucial role of FDI and how it can further promote Nigeria’s economic development. For the country to effectively reap the benefits, its economic planners should create a healthy and enabling business environment that encourages both foreign and local investors, provides incentives for innovation and skills improvement, and contributes to competitive corporate climate. It should also improve the general macroeconomic and institutional frameworks, including stable and high economic growth rate, liberal exchange rates, convertible currency, low inflation, minimal current account deficit and external indebtedness, low interest rates and access to capital, efficient banking system and capital markets, and competitive corporate tax rates. REFERENCES Abdus S. (2009) “Does FDI Cause Economic Growth? Evidence from South-East Asia and Latin America,” Woodbury School of Business Working Paper 1-09. Agosin, M. and Mayer, R. (2000) “Foreign Investment in Developing Countries: Does it Crowd in Domestic Investment?” UNCTAD Discussion Paper No 146, Geneva: UNCTAD. Akinlo, A. E. (2004) “Foreign Direct Investment and Growth in Nigeria: An Empirical Investigation.” Journal of Policy Modeling. (26) 5 627-639. Amadi, S.N., (2002) “The Impact of Macroeconomic Environment on Foreign Direct Investment in Nigeria”, Int. J. Dev., 4(2). Anyanwu, J.C. (1998) “An Econometric Investigation of Determinants of Foreign Direct Investment in Nigeria”. In Investment in the Growth Process: Proceedings of the Nigerian Economic Society Conference 1998, pp. 219–40. Ibadan, Nigeria. Asiedu E. (2002). “On the Determinants of Foreign Direct Investment to Developing Countries: Is Africa Different?” World Development, Vol.-30(1), 107-119. Ayanwale, A.B. and A.S. Bamire. (2001). “The Influence of FDI on Firm Level Productivity of Nigeria’s Agro/AgroAllied Sector”. Final Report Presented to the African Economic Research Consortium, Nairobi. 48
Balasubarmanyam, V.N., Salisu, M. and Sapsford, D, (1996) “Foreign direct investment and growth in EP and IS countries", The Economic Journal, 106, 92-105. Blomstrom, M., R. Lipsey and M. Zegan. (1994) “What explains developing country growth?” NBER Working Paper No. 4132. National Bureau for Economic Research, Cambridge, Massachusetts. Borensztein, E., De Gregoria J. and Lee J.W. (1998) “How does foreign investment affect economic growth?” Journal of International Economics, 45(1): 115–35. Borensztein, E., De Gregorio J., and Lee J. W. (1995) "How Does Foreign Direct Investment Affects Economic Growth?" Working Paper No. 5057, Cambridge, MA: National Bureau of Economic Research. Branstetter, Lee. J.W. (2006). “Is Foreign Direct Investment A Channel Of Knowledge Spillovers? Evidence from Japan's FDI in the United States” Journal of International Economics 68 (2): 325-344. Buckley, P. Clegg, J. and C. Wang (2002): “The impact of inward FDI on the performance of Chinese manufacturing firms,” Journal of International Business Studies, 33(4), 637–655. Central Bank of Nigeria (various years). Central Bank of Nigeria Statistical Bulletin. Abuja, Nigeria. Chakrabarti, A. (2001), “The Determinants of Foreign Direct Investment: Sensitivity Analysis of Cross-Country Regressions,” KYKLOS, 54 (1): 89-114. De Gregrio, J. (1992) "Economic Growth in Latin America," Journal of Development Economics, Vol. 39 pp. 59-84. De Mello, L. (1997) “Foreign Direct Investment in Developing Countries and Growth: A Selective Survey,” Journal of Development Studies, 34 (1): 1-34. De Mello, L. (1999), “Foreign Direct Investment Led Growth: Evidence from Time Series and Panel Data,” Oxford Economic Papers, 51, 133-151. Dunning, J.H. (1981) “Multinational Enterprises and Global Economy” Wokingham, Addison- Wesley Easterly, W.R and R. Levine. (1997) “Africa’s growth tragedy: Policies and ethnic divisions”. Quarterly Journal of Economics, 112(4), 1203-1250. Ekpo, A.H. (1995) “Foreign direct investment in Nigeria: Evidence from time series data”. CBN Economic and Financial Review, 35(1): 59–78. Eke, N.A. (2003). Foreign Direct Investment and Economic Growth in Nigeria. A causality test J. Econ. Soc. Stud., Vol: 3. Engel R.F and Granger G.W. (1987). “Cointegration and Error Correction Representation, Estimation and Testing”. Econometrical 55, 257-276. Findlay, R. (1978) “Relative backwardness, Direct Foreign Investment, and the transfer of technology: a simple dynamic model’, Quarterly Journal of Economics, 92, pp.1-16 Ford, Timothy C., Jonathan C. Rork, and Bruce T. Elmslie. (2008) “Foreign Direct Investment, Economic Growth, and the Human Capital Threshold: Evidence from U.S. States.” Review of International Economics 16 (1): 96-113. Fry, Maxwell J. (1992) “Foreign Direct Investment in a Macroeconomic Framework: Finance, Efficiency, Incentives and Distortions”, PRE Working Paper, Washington DC: The World Bank Graham, E.M. and P. Krugman. (1991) “Foreign Direct Investment in the United States”: Institute of International Economics. Grossman, G. M., and Helpman, E. (1991) “Innovation and growth in the global economy”. Cambridge, MA: MIT Press. Hein, Simeon (1992) “Trade Strategy and the Dependency Hypothesis: A Comparison of Policy, Foreign Investment, and Economic Growth in Latin America”, Economic Development and Cultural Change, 40(3); 495-521 49
Krugman, P. (1991) Increasing Returns and Economic Geography, Journal of Political Economy 99, 483-499. Kumar, Nagesh, and N.S. Siddharthan (1997) “Technology, Market Structure and Internationalization: Issues and Policies for Developing Countries”, Routledge and UNU Press, London and New York. Iyoha M. A. (2001) An econometric study of the main determinants of foreign investment in Nigeria, The Nigerian Economic and Financial Review 6(2), December. Jhingan, M.L. (2001) The Economics of Development and Planning Vrinda Edu. Books. 34th Revised Edtion. Johansen S. (1991) “Estimation and Hypothesis Testing of Cointegrating Vector in Gaussian Vector Auto-Regressive Model”, econometrical 59, 1551-1580. Loungani, P. and Razin, A. (2001) “How Beneficial is Foreign Direct Investment for Developing Countries?” Finance and Development 38 (2): 6-9. Lucas, Robert. (1988) “On the Mechanics of Economic Development.” Journal of Monetary Economics 22 (1): 3-42. Mackinnon J.O., Hang A.A., and Michelis L, (1999) “Numerical Distribution Function of Likelihood Ratio Test for Cointegration”, Journal of Applied Econometrics, 14, 563-77. Markusen, R. James, and Anthony J. Venables. (1999) “Foreign direct investment as a catalyst for industrial development.” European Economic Review 43: 335-356. Ngowi, P. (2001) Can Africa increases its Global share of foreign direct investment (FDI)? West Africa Review 2, 2 Obadan M.I. (1982). Direct Foreign Investment in Nigeria: An Empirical Analysis, African Studies Review XXV (1). Obinna, O.E. 1983. “Diversification of Nigeria’s External Finances through Strategic Foreign Direct Investment”. Nigerian Economic Society Annual Conference Proceedings, Jos, 13-16th May. Omisakin O., Adeniyi O. and Omojolaibi A. (2009) “FDI, Trade Openness and Growth in Nigeria,” Journal of Economic Theory, Vol. 3, No. 2, pp. 13-18. Otepola A. (2002) “Foreign Direct Investment as a factor of Economic Growth in Nigeria.” Africa Institute for Economic Development and Planning (IDEP), Dakar, Senegal Oyaide, W.G., (1977) “The Role of Direct Foreign Investment: A case study of Nigeria”, United Press of America, Washington D.C. Oyejide T. A. (2005) “Capital Flows and Economic Transformation: A Conceptual Framework on Proceedings of Central Bank of Nigeria 5th Annual Monetary Policy Conference with the theme Capital Flows and Economic Transformation in Nigeria.” Held at the CBN Conference Hall, Abuja. November 10th to 11th Pradhan, Jaya Prakash (2001) “Foreign Direct Investment and Economic Growth: The Case of Developing Countries”, Unpublished M.Phil Dissertation submitted to Jawarhlal Nehru University, New Delhi Sachs, J.D. (2004) “Ending Africa’s Poverty Trap” Brookings Papers on Economic Activity, 1, p.117-240. Sanchez- Robles (1998) “Infrastructure Investment and Growth: Some Empirical Evidence,” Contemporary Economics Policy, Western Association International vol. 16(1) p.p 98-106 Saggi, K. (2000) “Trade Foreign Direct Investment, and International Technology Transfer”: A Survey, issued as WT/WGTI/W/88, dated 19 September 2000, Geneva: World Trade Organization. Stewart, F., (1981) “Arguments for the Generation of Technology by Less-Developed Countries”, The Annals of the American Academy of Political and Social Sciences, 458, pp. 97-109. Stewart, F. (1984) "Facilitating Indigeneous technical Change in Third World Countries" In Technological Capability in the Third World. M Fransman and K. King eds. London: MacMillan Press. 50
Singh, R.D. (1998) “The Multinational’s Economic Penetration, Growth, Industrial Output and Domestic Savings in Developing Countries: Another Look”, The Journal of Development Studies, 25(1):55-82 Solow, R. (1956). “A Contribution to the theory of economic growth” Quarterly Journal of Economics, 70: 65-94. Tang S., Selvanathan, E. A. and S. Selvanathan (2008) “Foreign Direct Investment, Domestic Investment, and Economic Growth in China: A Time Series Analysis,” UNU-WIDERN Research Paper No. 2008/19. United Nations Conference Trade and Development (2006) “Economic Development of Africa: Rethinking the Role of Foreign Direct Investment”. New York and Geneva. United Nations Conference on Trade and Development (2004) “Economic Development in Africa, Debt Sustainability”: Oasis or Mirage. New York and Geneva. United Nations Conference on Trade and Development (2000) Incentives for Foreign Direct Investment. World Bank. (2009), World Development Indicator. Softcopy Database. World Bank. Xu, B. (2000) “Multinational enterprises, technology diffusion and host Country productivity growth”, Journal of Development Economics, 62:477-494 Zhang, K. H. (2001) “How Does Foreign Direct Investment Affect Economic Growth?” Economics of Transition 9 (3): 679-693. Zhang, K.H. and Ram, R. (2002) “Foreign direct investment and economic growth: evidence from cross-country data for the 1990s”, Economic Development and Cultural Change, 51, 1, pp. 205-15. ABOUT THE AUTHORS: Ismail Olaleke Fasanya is affiliated with the Department of Economics, University of Ibadan, Ibadan, Nigeria.
51
APPENDIX 1: MAP OF NIGERIA
52