Dr aft
13
Capital Budgeting Applications and Pitfalls
Tips and Tricks Applying the concepts of NPV and IRR in the real world can be very difficult. This chapter explains many of the nuances and pitfalls in their application. It will help you avoid many common mistakes that many companies commit almost every day— mistakes that cost them value.
13.1
So Many Returns: The Internal Rate of Return, the Cost of Capital, the Hurdle Rate, and the Expected Rate of Return
Before we begin, let us just recap the four commonly-used rates of return in finance: the internal rate of return, the cost of capital, the expected rate of return, and the hurdle rate.
Internal rate of return: The internal rate of return is a characteristic of project cash flows (hence “internal”) and usually has nothing to do with capital markets (unless the project itself is a capital markets–related project). This is its big advantage—you can calculate it before you ever look at the capital markets. It is only later that you will compare the IRR to the prevailing rate of return in the economy. The IRR is the most different of these four rates. Be careful, though: You should not use promised cash flows to compute it. IRR requires expected cash flows, which are much harder to come by.
Cost of capital: Always think of it as the opportunity cost of capital. It is the rate of return your investors could expect to receive by investing in similar projects elsewhere. It is determined by the prevailing required rates of return for projects of your type. Therefore, it is driven by the demand and supply for capital in the economy—the expected rate of return that your investors demand in order to give you money willingly. In perfect capital markets, with many lenders and borrowers, loans usually have zero net present values. (Otherwise the borrower or lender is giving away free money.) The cost of capital is sometimes called the “required expected rate of return.” (The CAPM is one perfect-market model that can provide an estimate of the cost of capital.) Finally, realize that the cost of capital is itself an expected value concept—you do not need to write the “expected cost of capital.”
Expected rate of return: The expected rate of return is a generic term. It could mean your project’s expected rate of return, or the cost of capital (the lender’s expected rate of return). In most cases, if your project’s actual expected rate of return is above its required expected rate of return (the cost of capital), then it is a positive-NPV project. If management makes smart decisions, projects’ expected rates of return are above their costs of capital. The very last marginal project often has an expected rate of return just about the same as the cost of capital. 313
In the real world, these four terms are often used casually and interchangeably.
ä IRR, Sect. 4.2, Pg.57.
ä Cost of capital, Sect. 2.5, Pg.22.
ä Expected rate of return, Sect. 8.1, Pg.167.
314
Hurdle rate: The appropriate project hurdle rate is the expected rate of return above which management decides to accept and go forward with the project. It is set neither by the financial markets nor by the project, but by management. Bad management could choose any arbitrary, or even outright idiotic, hurdle rate. Good management should accept all projects that have positive net present values. Usually, this means that good managers should set a project’s hurdle rate to be equal to the project’s cost of capital, and management should then determine whether the project’s IRR exceeds this hurdle rate. If management makes smart decisions, taking all positive-NPV projects, the “hurdle rate,” “cost of capital,” and “required expected rate of return” are all the same. You already know that expected project returns are difficult to come by. Managers often incorrectly use promised rates of return. Because corporations are aware that claims based on expected project returns are regularly inflated, many of them have established hurdle rates high above a reasonable cost of capital for such projects. It is not uncommon to find corporations requiring projects to have hurdle rates of 15% or more, even when the cost of capital for such projects would seem to be on the order of only 10%. Venture capitalists even regularly employ project hurdle rates as high as 30%, knowing full well that this is far above the rate of return that their projects are truly expected to earn.
Dr aft
ä Hurdle rate, Sect. 4.2, Pg.62.
Capital Budgeting Applications and Pitfalls
Warning: The IRR should be an expected return concept, but it is often misapplied to promised returns.
ä Agency problems, Sect. 13.8, Pg.338.
The differences are sometimes subtle, and the terms are often used interchangeably—which is okay in many, but not all, situations.
Q 13.1. Can you compare a project’s internal rate of return to its hurdle rate?
Q 13.2. Can you compare a project’s cost of capital to its hurdle rate in a perfect market?
13.2
The simplest error—confusing promised and expected returns—is perhaps the worst.
Promised, Expected, Typical, or Most Likely?
By now, you should know that you should always remember to distinguish between promised and expected numbers. In particular, models like the CAPM are about expected rates of return and simply do not tell you anything about credit risk. When you want to apply the present value formula, you must use the expected cash flows in the numerator (adjusted for credit risk), not the promised cash flows. When it comes to your risk judgment, it goes into the PV numerator first. Never ever discount promised cash flows with (CAPM) costs of capital!
Promised and Expected Returns
Here is how users get it wrong most of the time.
Let’s recap this. Say the world is really as perfect as the CAPM suggests and you have a B-rated corporate zero-bond that promises $1,000 next year and has a beta of 0.2. Assuming you believe that the risk-free rate is 5% and the equity premium is 3%, you can still not compute the bond price as
13.2. Promised, Expected, Typical, or Most Likely?
PV 6=
$1,000 1 + 5% + 3% · 0.2
315
≈ $946.97
Promised Cash Flow � 1 + rF + [E rM – rF ] · βi Yes, in a perfect CAPM world, the expected rate of return on this bond should be 5% + 3% · 0.2 = 5.6%. (In an imperfect world, you would have to add the liquidity and tax premiums.) Yet, to determine the price, it is not enough for you to know the promised bond cash flow. You need the expected cash flow, a number that is always less than $1,000. The same problem arises, of course, not only in the context of bonds but also in the context of corporate projects. You cannot simply discount the “good-scenario” cash flows. You must discount the project’s expected cash flows! The same mistake appears sometimes in another form when managers use the IRR capital budgeting rule. This rule says “accept the project if its IRR is above the hurdle rate.” The common mistake here is that the cash flows from which the IRR must be computed are not the promised cash flows, but the expected cash flows. Of course, you can also compute a number from the promised cash flows, but you should probably call it the “promised IRR” to distinguish it clearly from the “expected IRR”—and you should never compare the promised IRR to a hurdle rate based on the expected rates of return of other projects in the economy when you want to determine whether you should accept the project or not. In fact, the promised IRR should not be used for capital budgeting purposes.
Dr aft
PV 6=
ä Imperfect market premiums, Sect. 11.6, Pg.263.
For capital budgeting (comparison to the cost of capital), an IRR must be computed from the project’s expected (and not promised) cash flows.
Q 13.3. An Amazon.com bond quotes an internal rate of return of 8% per annum. Assuming the market is perfect, is this its cost of capital?
Expected, Typical, and Most Likely Scenarios
Managers often commit a related (but milder) error in applying NPV. They tend to confuse expected values with “typical” or “most likely.” (Statistically speaking, this means that they confuse the mean with the median or the mode of a distribution.) If you do this, you will fail to consider low-probability events appropriately: a plane crash, a legal suit, an especially severe recession, or a terrific new client. For example, your business may have the following payoffs: Event
Good Business Normal Business Lawyers Sue for Punitive Damages
Probability
Value
46% 44% 10%
$1,200,000 $1,000,000 –$10,000,000
The most likely payoff is $1,200,000. The median payoff is $1,000,000. The expected payoff, however, is only � E Payoff = 46% · $1,200,000 + 44% · $1,000,000 + 10% · (–$10,000,000) =
– $8,000
An NPV analysis requires this expected payoff. If you run this business 100 times, you would receive $1.2 million 46 times, $1 million 44 times, and lose $10 million 10 times. Fortunately, if the statistical distribution is symmetric—as it is in the case of the normal bell-shaped distribution— then the center of the distribution is all three: mean, median, and mode. Unfortunately, few businesses are immune to low-probability shocks, often negative, so you need to think about whether the distinction between mean, median, and mode is applicable to your business.
The NPV formula requires expected cash flows, not typical cash flows. (Do not ignore low-probability events.) An example: The statistical distribution has a left tail.
316
Capital Budgeting Applications and Pitfalls
Q 13.4. A zero-bond promises $100,000 and has a beta of 0.3. If the risk-free rate is 5%, and the equity premium is 3%, and the CAPM holds, then what is the bond’s price?
Dr aft
Q 13.5. A machine that costs $910 is likely to break irreparably with 10% probability at the end of each year (assuming it has worked the previous year). (Many electric devices without moving parts have such breakdown characteristics.) However, the regulatory agency has phased out this machine, and so will neither allow you to replace it nor use it for more than five years. The machine can produce $300 in profit every year, beginning next year. The discount rate is 12% per annum. (Hints: This means that the machine will produce some value between $300/1.12 ≈ $268 [if it breaks down immediately] and $1,081 [if it lasts for all years] in present value. First, work this out case by case for a two-year machine, then for a three-year machine. Think “DDDD,” “WDDD,” “WWDD,” “WWWD,” and “WWWWD,” where W means working and D means dead.) 1. What is the most likely number of years that the machine will last? If this number were instead guaranteed to be the certain life of the machine in number of years (instead of just the most likely number of years), what would be the machine’s value? 2. What is the expected number of years that the machine will last? If this number were instead guaranteed to be the certain life of the machine in number of years (instead of just the expected number of years), what would be the machine’s value? 3. What is the correct present value of this machine?
13.3
Independent projects should be considered based on their own costs of capital.
Badly-Blended Costs of Capital
One of your first lessons about NPVs was that you can add them if projects are independent. Yet, believe it or not, although most managers know that it is impossible to add value by merely combining independent projects, in practice they often make exactly this mistake. This error arises most commonly in contexts in which costs of capital need to be blended across multiple projects. As always, the concept is straightforward, but the devil is in the details. It is easy to overlook the forest in the trees. Let’s make sure you do not commit this mistake.
Does Risk Reduction Create Value?
Synergies determine M&A value for shareholders; lower risk (diversification) does not. Managers, however, are conflicted: They like lower risk.
Recall the insight from Section 10.2 that companies cannot create value by reducing risk via diversification into multiple businesses. However, some mergers can add value due to synergies, which will be discussed in the next section. But these synergies are not a result of the plain diversification effect. Many researchers believe that the most common but unspoken rationale for mergers are not synergies but the fact that managers like to take over other firms. They prefer the reduced idiosyncratic firm uncertainty and higher salaries guaranteed by larger firms to the higher risk and lower salaries in sharply focused, smaller firms. To justify a merger, managers will want to argue for a lower cost of capital for the target any way they can—including incorrectly using the acquirer’s cost of capital. (This is an example of an agency conflict, which will be explained later in this chapter.) There is also good evidence that in the real world, diversified firms often do not operate as efficiently as stand-alone firms (e.g., due to limited attention span of management or more bureaucratization). Many mergers actually destroy firm value.
13.3. Badly-Blended Costs of Capital
ANECDOTE
317
Risk and Conglomeration
Dr aft
In the 1970s, a lot of firms diversified to become conglomerates. Management argued that conglomerates tended to have lower risk, which created value for shareholders. This argument was, of course, total nonsense: Investors could diversify for themselves. It was the managers who liked lower risk, with less chance of losing their jobs and higher compensation packages that came from running a bigger company. Worse, because conglomerates often operated less efficiently than individual stand-alone, focused companies, diversification actually often destroyed firm value. In the 1980s, there were many “bust-up buyouts,” which created value by purchasing conglomerates to sell off the pieces.
A good example of such a conglomerate was Gulf and Western. It was simultaneously involved in oil, movies (Paramount), recording (Stax), rocket engines, stereo components, finance, publishing (Simon and Schuster), auto parts, cigars, and on and on. It promptly crashed and split up in the 1980s. A more current example is Tyco, which has over 260,000 employees in 50 separate business lines, including electronics, undersea fiber optic cables, health care, adhesives, plastics, and alarm systems. (Its former executive, Dennis Kozlowski, became famous for his extravagant looting of Tyco’s assets. With so many business lines, no wonder no one noticed for years!) The most interesting conglomerate, however, may be General Electric. It has hundreds of business lines, but unlike most other conglomerates, GE appears to have been running most of its divisions quite well. Oligopoly Watch and other sources
Does Corporate Risk Management Create Value?
Although risk management is discussed in more detail in the companion chapter on options, but let me give you a brief preview. Firms can reduce their own overall risk by hedging. A hedge is an arrangement that reduces the firm’s volatility. For example, a refinery could purchase crude oil today in order not to suffer if the future oil price were to increase. (This is further discussed in the companion chapter on risk management and hedging.) Remarkably, a firm with a high market beta could even transform itself into a firm with a low market beta! (Hedge funds often do this.) The firm can hedge away market risk by selling the stock market itself. S&P 500 futures contracts make shorting the stock market exceptionally easy. Whenever the stock market goes up, the futures contract goes up in value. Being the seller, the hedging firm’s side of the futures contract goes down in value. Put differently, the firm’s hedge contract has a negative market beta. The hedged firm is now a bundle, consisting of the unhedged firm plus this contract. Therefore, the market beta of the hedged firm would be lower than the market beta of the unhedged one. If it wanted, the firm could even make its own market beta zero or negative. Usually, being hedged against market risk would also reduce the overall idiosyncratic risk of the firm. Some firms may hedge against other risks. For example, Southwest Airlines has often purchased jet fuel far in advance (through futures contracts), though it is not altogether clear whether this was to hedge or to speculate. But would this hedging contract create firm value in a perfect market? No. The firm has not given its investors a new positive-NPV project. If investors had wanted less exposure to the overall stock market, they could have shorted the stock market themselves. Alternatively, investors can simply undo a firm’s hedging—they can buy the financial markets contracts that the firm has sold. This undoes any corporate hedge from the investors’ perspectives. So, in itself, in a perfect market, trading fairly priced hedging contracts neither adds nor subtracts value. It is only if the market is imperfect that a hedge may allow a firm to operate more efficiently. For example, the extra cash from a hedge contract could help the firm to avoid running into a liquidity crunch in situations in which more funding would be difficult to raise. Or the firm may have inside information concerning what the future will hold and thus whether the hedged good is underpriced. In this case, risk management could add value.
Hedging is a form of risk management.
Hedging against stock market risk can lower the market beta and risk of the firm. Hedging against jet fuel price increases can reduce risk exposure.
ä Shorting stocks, Sect. 7.2, Pg.155.
Does hedging create value? Only in an imperfect market.
318
IMPORTANT
Capital Budgeting Applications and Pitfalls
In a perfect market, the following holds:
Dr aft
• If two firms are independent, then combining them into a conglomerate usually reduces the overall firm risk, but does not create value for investors. Investors can easily diversify risk themselves. • Adding independent projects to the firm cannot create value if these projects are not positive-NPV in themselves.
In an imperfect market, the value effects of hedging are complex. Hedges could indeed add (or subtract) value.
Q 13.6. When two unrelated firms with uncorrelated rates of return merge, is the resulting conglomerate riskier or safer? Does this add value?
How to Misuse Costs of Capital
A common misuse of CC is to use a uniform cost of capital for all projects.
This brings us to a common simple NPV mistake: forgetting that the NPVs of independent projects are additive. Sounds obvious, but here is how it gets lost in the details: In a perfect market, NPVs are only additive if you use each individual projects’ own costs of capital. You cannot use the firm’s overall cost of capital for its individual projects.
When Acquiring Another Company
Assume the firm uses the same overall cost of capital for all projects. old should not take new.
Your old firm, cleverly named old, is worth $100 and has a cost of capital of 5%. At a fair price, it expects to pay off $105 next year. A potential acquisition target (or just a new project), cleverly named new, costs $10 this year, expects to pay out $11 next year, and has a cost of capital of 15%. The simplest method to compute the value of acquiring project new relies on the fact that the NPVs of independent projects are additive. You can value the new project using its own expected cash flows and its own cost of capital. Who owns new should matter little: The project is worth what it is worth. Therefore, the true NPV of project new is $11 ≈ –$0.43 1 + 15% Therefore, if old adopts new, the original owners of old become 43 cents poorer than they would have been otherwise (i.e., $100 versus $99.57). (If you want to practice the CAPM, think of a beta of 0.5 for the old project, a beta of 3.0 for the new project, a risk-free rate of 3%, and an equity premium of 4%.) Unfortunately, in many firms, it is standard policy to evaluate all projects by the firm’s overall cost of capital. Would such an old firm take the new project now? Evaluated incorrectly at a cost of capital of 5%, the new project looks a lot better, –$10 + $11/(1 + 5%) ≈ $0.48. If the old firm did take project new, how would its value change? The true present value of the combined firm would be NPVnew = –$10 +
Bad company policy: Using its own cost of capital on this project, the firm would mistakenly take it. The loss if the firm takes this project is exactly the negative NPV of the project.
$105 $11 + 1 + 5% 1 + 15% PVcombined = PVold + PVnew
PVcombined =
≈ $109.57
This is 43 cents less than the original value of $100 plus the $10 acquisition cost of the new project. Taking new makes the old owners $0.43 poorer.
13.3. Badly-Blended Costs of Capital
Real-world exception: If the capital market for the target is inefficient, the act of acquisition can create value.
Dr aft
Of course, not all acquisitions are driven by such mistakes. Contrary to the perfect world, it is not always true in the real world that mergers never add value on the cost-of-capital side. If capital markets are not as efficient for small target firms as they are for large acquiring firms, it would be possible for a large acquirer to create some value also on the cost of capital side. For example, if a target previously had no access to a perfect capital market, then the cost of capital to the target can change when it is acquired. The correct cost of capital for valuing the acquisition (the target), however, is still neither the cost of capital of the acquirer nor the blended post-acquisition cost of capital of the firm. Instead, the correct cost of capital then is the lower rate that is appropriate for the target’s projects, given the improved access to capital markets. For example, if an entrepreneur inventor of holographic displays previously had faced a cost of capital of, say, 303%, primarily due to access only to personal credit card and credit-shark financing, and if this inventor’s business is purchased by Intel with its cost of capital of 6.5%, the proper cost of capital is neither Intel’s (market beta-based) cost nor a blended average between 303% and 6.5%. Instead, if part of Intel, the holographic project division should be evaluated at a cost of capital that is appropriate for projects of the market beta risk class “holographic display projects.” This can add value relative to the 303% earlier cost of capital. (Of course, there are also many examples of large corporations that have destroyed all innovativeness and thereby all value in small companies that they had taken over.)
319
ä Entrepreneurial finance, Sect. 11.5, Pg.262.
When Acquiring Another Project
It is not only firms to be acquired, but also smaller or sub projects themselves that can have components with different costs of capital. For example, when firms keep cash on hand in short-term U.S. Treasuries, such investments have a lower expected rate of return. These bonds should not need to earn the same expected rate of return as investments in the firm’s risky long-term projects. (The presence of this cash in the firm lowers the average cost of capital for the firm by the just-appropriate amount.) Here is another application, which shows how you can decompose projects into categories with different costs of capital: Assume that you consider purchasing a rocket to launch a telecom satellite next year. It would take you 1 year to build the rocket, at which point you would have to pay $80 million. Then you launch it. If the rocket fails (50% chance), then your investment will be lost. If the rocket succeeds, the satellite will produce a revenue stream with cost of capital of, say, 13%, beginning immediately. (Telecom revenues may have a high covariance with the market.) The telecom’s expected cash flows will be $20 million forever. The correct approach is to think of the rocket as one project and of the telecom revenues as another. The rocket project has only idiosyncratic risk. Presumably, its risk can be diversified away by many investors, its beta is close to zero, and thus it may have a discount factor that is close to the risk-free rate of return, say, 3% itself. The rocket value (in millions of dollars today) is � E Rocket Price –$80 � = PVrocket = ≈ –$77.7 1 + 3% E rrocket discount rate You can think of this as the cost of storing the $80 million in Treasuries until you are ready to proceed to your second project. The telecom revenues, however, are a risky perpetuity. With telecom-like costs of capital of 13% and cash flows that appear only if the rocket succeeds (a 50-50 probability), its value is � E Telecom Cash Flows 50% · $20 + 50% · $0 � PVtelecom = ≈ $76.9 = 13% E rtelecom discount rate
Consequently, the combined project has an NPV of about –$1 million. If you had mistakenly discounted the rocket’s $80 million cost by the same 13%, you would have mistakenly valued it at –$80/1.13 + $76.9 ≈ +$6.1 million.
Projects must be discounted by their own cost of capital.
A project can have components that require one cost of capital, and other components (even contingent ones) that require another cost of capital.
The solution to this multi-cost-of-capital problem.
320
Capital Budgeting Applications and Pitfalls
Dr aft
Q 13.7. Some companies believe they can use the blended post-acquisition cost of capital as the appropriate discount rate. However, this also leads to incorrect decisions. Let’s explore this in a CAPM context. The risk-free rate is 3%, the equity premium is 4%, and the old firm is worth $100 and has a market beta of 0.5. The new project costs $10, is expected to pay off $11 next year, and has a beta of 3. 1. What is the value of the new project, discounted at its true cost of capital, 15%?
2. What is the weight of the new project in the firm? (Assume that the combined firm value is around $109.48.) 3. What is the beta of the overall (combined) firm?
4. Use this beta to compute the combined cost of capital. 5. Will the firm take this project? (Use an IRR analysis.)
6. If the firm takes the project, what will the firm’s value be?
Differential Costs of Capital—Theory and Practice
In practice, a good number of firms do not use project-specific costs of capital.
ä 2001 CFO survey, Sect. 4.5, Pg.67.
A possible reason: Finding project costs of capital may just be too difficult. Intuitive methods anchoring on the firm’s cost of capital may work better than formal methods. ä Imperfect markets premiums, Sect. 11.6, Pg.263.
Flexible costs of capital can cause endless debate and worsen agency conflicts.
It is clearly correct that projects must be discounted by their project-specific costs of capital. Yet Graham and Harvey found in their 2001 survey that just about half of surveyed CFOs always— and often incorrectly—used the firm’s overall cost of capital rather than the project-specific cost of capital! And even fewer CFOs correctly discounted cash flows of different riskiness within projects. (They sometimes do and sometimes do not take into account that cash flows farther in the future typically require higher expected rates of returns—they should!) The easy conclusion is that CFOs are ignorant—and many CFOs may indeed incorrectly use a uniform cost of capital simply because they are ignorant. CFOs should at least use debt capacity and duration adjustments for different projects. However, even some intelligent CFOs use the same discount rate quite deliberately on many different types of projects. Why? You already know that it can be difficult to estimate the appropriate cost of capital correctly. In theory, markets are perfect and we know the cost of capital. In practice, this may or may not be a good approximation. Do you really know the correct expected rate of return for projects of this specific type? (Do you really even know the correct expected cash flows? Remember—this is not physics where we understand all the driving processes from the mechanics of the spinning wheel.) In addition, you have not even yet considered such issues as the influence of liquidity and tax premiums on your cost of capital. Quite simply, you must be aware of the painful reality that our present value methods are usually just not as robust as we would like them to be. Together, your uncertainties distort not only your overall corporate cost-of-capital estimates, but also your relative cost of capital estimates across different projects. Consequently, the problem with assigning different costs of capital to different projects may now become one of disagreement. Division managers can argue endlessly about why their projects should be assigned a lower cost of capital. Is this how you want your division managers to spend their time? And do you want your managers to play revenue games? Managers could even shift revenues from weeks in which the stock market performed well into weeks in which the stock market performed poorly in order to conjure up a seemingly lower market beta. The cost-of-capital estimate itself then becomes a pawn in the game of agency conflict and response—all managers would like to convince themselves and others that a low cost of capital for their own divisions is best. What the overall corporation would like to have in order to suppress such “gaming of the system” would be immutable good estimates of the cost of capital for each division and potential project that no one can argue about. In the reality of corporate politics, however, it may be easier
13.4. The Economics of Project Interactions
321
Dr aft
to commit to one-and-the-same immutable cost of capital for all projects than it would be to have different costs of capital for each division and project. This is not to argue that this one cost of capital is necessarily a good system, but just that there are cases in which having one systemwide cost of capital may be a lesser evil. In sum, a good rule of thumb in real life is not to worry too much about differential costs of capital across projects of similar horizon and financing class, unless your projects are vastly different. (A good rule of thumb in job interviews is to understand what you must do in a perfect world, though—you will be asked. Make sure to answer that each project needs its own cost of capital.)
Errors: Do Projects Really Need Their Own Costs of Capital?
Does every project really need its own cost of capital? Let’s not miss the forest here. Yes, in theory, each component must be discounted at its own discount rate if you want to get the value (and incentives) right. However, in practice, if you want to value each paper clip by its own cost of capital, you will never come up with a reasonable firm value—you will lose the forest among the trees. You need to keep your perspective as to what reasonable and unreasonable errors are. The question is one of magnitude: If you are acquiring a totally different company or project, with a vastly different cost of capital, and this project will be a significant fraction of the firm, then the choice of cost of capital matters and you should differentiate. However, if you are valuing a project that is uncertain and long-term, and the project is relatively small, and its cost of capital is reasonably similar to your overall cost of capital, you can probably live with the error. It all depends—your mileage may vary!
• Theoretically, all projects must be discounted by their own costs of capital, and not by the firm’s overall cost of capital.
You will never get the cost of capital perfectly right. Get it right where it matters!
IMPORTANT
• Practically, the effort involved, the uncertainty in your estimates, the distraction from getting your expected cash flows in the PV numerator right, and the “gaming” by division managers may prevent you from discounting every project—every paper clip—by its own cost of capital. • Depending on the situation, you may be better off assigning the same cost of capital to all cash flows of similar maturity, perhaps with only a modest holistic risk-adjustment.
It is up to you to determine when it is important to work with different costs of capital and when it is better to use just one cost of capital.
13.4
The Economics of Project Interactions
If projects are independent, you have the luxury to consider them in isolation. You can compute separately the costs and benefits necessary to make a decision whether to accept or reject each project. However, in the real world, projects are not always independent. Let’s assume that you are the only person who can service a market and that you assess your potential profits in different states to be $120,000 in NY, $60,000 in CA and $40,000 in RI if you enter only one of them. However, it may cost an extra $70,000 to develop states on different coasts simultaneously, but the cost of developing two nearby markets may be sharable among neighboring states. For example, say that the potential profit is not $160,000 but $200,000 if you develop NY and RI. So, how do you select the best set of projects? (You could think about negative consequences, too. For example, if your best reseller in CT threatens to withdraw business if you develop either
An example of projects whose cash flows are not independent. In fact, they “interact.”
322
Capital Budgeting Applications and Pitfalls
NY or RI [and even more if you develop both], you would have to figure this revenue loss into developing these two states.) The ultimate project selection rule: Consider all possible project combinations and select the combination of projects that gives the highest overall NPV.
Dr aft
IMPORTANT
There are too many possible action choices in the real world to evaluate (to compute NPV for). You need rules and heuristics!
The “greedy” heuristic: Always take the next most profitable project.
Optimal project selection is easier said than done. It is easy for the basic example with these three states (take NY and RI, skip CA), but this is rarely the case. For two projects at a time, there are usually only 22 options to consider: take neither, take one, take the other, or take both. But the complexity quickly explodes when there are more projects. For three projects, there are 23 = 8 options. For four projects, there are 16 options. For 10 projects, there are about a thousand options. For 20 projects, there are over a million options. For 50 states, there are quadrillions. And even the simplest corporate projects can easily involve hundreds of decisions that have to be made. Mathematically, it is an impossible task to find the perfect combination. To help you determine which projects to take, you need to find some rules that help you make a decision. Such rules of thumb are called heuristics–that is, rules that simplify your decisions even if they are not always correct. One common heuristic algorithm is to consider project combinations, one at a time. Start with the project combination that would give you the highest NPV if you were only allowed to take two projects (one pair from a set of many different projects). For example, start with the state that has the highest profit. There are only 50 of them. Now consider adding each state. There are only 49 possible choices. Then take this pair as fixed, that is, treat it as a single project. Now see which of the remaining 48 states adds the most value to your existing pair. Continue until adding the best remaining project no longer increases value. Computer scientists call this the greedy algorithm. It is a good heuristic, because it drastically cuts down the possible project combinations to consider and usually gives a pretty good set of projects. There are many possible enhancements to this algorithm, such as forward and backward iterations, in which one considers replacing one project at a time with every other option. Full-fledged algorithms and combinatorial enhancements that guarantee optimal choice are really the domain of computer science and operations research, not of finance. Yet many of these algorithms have been shown to require more time than the duration of the universe, unless you make simplifications that distort the business problem so much that the results are likely no longer trustworthy. Fortunately, finance is in the domain of economics, and economics can help simplify the project selection problem.
Project Pairs
Project combinations can be classified into positive, zero, and negative interaction combinations.
Considering projects in pairs is not only common practice, but also clarifies many economic issues. With two projects, you can decompose the total net present value into three terms: Overall NPV = NPV Project 1 + NPV Project 2 + NPV Interactions
For example, the original two state project (NY+RI) project choice yielded $200,000 = $120,000 + $40,000 + NY+RI
NY
RI
($40,000)
NY RI Interaction
The final term reflects the interaction of the two projects. It suggests that you can classify project combinations into one of three different categories: 1. Projects with zero interactions
2. Projects with positive interactions
13.4. The Economics of Project Interactions
323
3. Projects with negative interactions An interaction is also sometimes called an externality in economics, because one project has an external influence on another project—sometimes imposing external costs, and sometimes providing external benefits. Let’s consider these three cases separately.
Dr aft
Zero Project Interactions
Most projects in this world are independent—they have no mutual interactions. For example, for Walmart, opening a mall in Japan probably has no effect on opening a warehouse in Canada. Independent project payoffs permit the separate evaluation of each project. This makes decision making much easier:
Project independence is the most common case. It allows the simplest decision making.
• Taking any positive-NPV project increases firm value.
• Taking a zero-NPV project leaves firm value unchanged. • Taking any negative-NPV project decreases firm value.
If projects are independent, then the project interaction term is zero, and project NPVs are additive. Project independence makes decisions a lot easier: For 20 projects, only 20 independent decisions (accept or reject) have to be made, not a million. You can simply add the project NPVs of independent projects.
IMPORTANT
Positive Project Interactions
Positive interactions mean that the sum of the parts is worth more than the parts individually. If one project has a positive influence on the NPV of another project, you cannot value it without taking into account this positive influence. For example, think of a new product as one project and of an advertising campaign as another. The advertising campaign project is of lesser use without the product, and the product is of lesser use without the advertising campaign. You must consider creating a product and an advertising campaign together. Such positive externalities are even more plentiful in smaller decisions. For example, a computer keyboard is less useful without a computer, and a computer is less useful without a keyboard. In fact, some projects or products only make sense if purchased together. In this case, producers may bundle them together and/or purchasers may only buy them as bundles. In the corporate context, investment in infrastructure is another classic example of positive project interactions. For example, building a road, hiring a security firm, or laying a fast Internet connection could enhance the values of many divisions simultaneously. The firm should factor in the increase in value to all divisions when deciding on how much infrastructure to add. Don’t take positive externalities too lightly: On a philosophical basis, positive project interactions are the reason why firms exist in the first place. If there were no cost savings to having all resources combined in the firm, all of us could work as individuals and dispense with firms altogether.
When deciding whether to take a project, you must credit all positive interactions to the project. The overall NPV is higher than the individual project NPVs alone. Internal conflict and cost allocation procedures (discussed further as “agency conflicts” below) often hinder corporations from taking advantage of many positive externalities. For example, in real life, your division managers might argue that they should not be charged for the Internet connection, because they did not request it and therefore do not really need it (even if it were to increase their divisions’ values). After all, division managers would prefer getting the Internet for free from the company instead of paying for it out of their own divisional budgets.
In many cases, what makes a project a project in the firm’s mind is often the indivisibility of its components.
Infrastructure can benefit many different projects.
Positive externalities are why firms exist to begin with.
IMPORTANT
Agency problems often prevent properly crediting projects with all their contributions.
324
Nowadays, managers who want to acquire other companies usually claim the presence of large positive externalities. Synergies are the managerial term for positive externalities between an acquirer and a potential acquisition target. It has become an important managerial buzzword. For example, in the 2001 acquisition of Compaq by Hewlett-Packard, HP touted synergies of $2.5 billion—most from cutting employees. Of course, whether enough synergies are ever realized to outweigh the acquisition costs is yet another question. (Like many other acquirers, HP performed quite poorly after the acquisition and may have never realized any of these synergies.)
Dr aft
Another name for positive externalities: synergies.
Capital Budgeting Applications and Pitfalls
Negative Project Interactions
Negative interactions exist when taking one project decreases the value of another project.
Negative interactions mean that the sum of the parts is worth less than the parts individually. In this case, projects have negative influences on one another and thereby decrease one another’s value. Economists sometimes call negative externalities diseconomies of scale. Here are a few examples. Pollution and congestion: Think of an airline company with two divisions, but only one maintenance facility. One division handles cargo; the other handles passengers. If the cargo division wants to expand, it will use more of the maintenance capacity. This will leave the passenger division with longer service waiting times. In the extreme, the extra delays may cost the passenger division more than the extra profits that the expanded cargo operation adds.
Dilbert on Cannibalization and Agency I: 2013-04-02
Dilbert on Cannibalization and Agency II: 2012-10-20
Dilbert on inertia: 2012-09-26
Dilbert on Flexibility and Persistence: 2012-11-20
Dilbert on Inertia and Status Quo: 2013-06-09
Cannibalization: If a new Apple computer can produce $100,000 in NPV compared to an older Windows machine that only produces $70,000 in NPV, how should you credit the Apple machine? The answer is that the Apple would eliminate the positive cash flows produced by the existing Windows machine, so the cash flow of the project “replace Windows with Apple” is only $30,000: the $100,000 minus the $70,000 that the now-unused Windows machine would have produced. Be careful what you consider cannibalization, though. For example, in the 1970s, IBM did not produce personal computers, fearful of cannibalizing its mainframe computer business. IBM’s mistake was that it did not realize that other computer manufacturers were able to step in and eat much of IBM’s mainframe business for themselves. Put differently, IBM had not realized that the present value of its mainframe business’s future cash flows had already changed with the advent of new technology in the competitive market that it was in.
Complexity: As more and more projects are adopted, management will find it increasingly difficult to make good decisions, and do so in reasonable time frames. As you just learned, projects can often impact other projects, and no manager knows every project and cares about them in the right mix. In trying to deal efficiently with more scale and complexity, larger organizations typically adopt more detailed processes and bureaucracy. The cost is that such Process itself consumes resources and can reduce cash flows for all divisions. A good example of bureaucratic destruction of projects can be found on Moishe Lettvin’s blog (Google is your friend). A programmer who worked for Microsoft for 7 years, he describes how it took between 24 and 43 people, separated by six layers of management, over one year just to talk about the Windows boot menu—and no one really knew who had the power to make the final decision. Hiring a tenured faculty member in a university is a frustrating six-month affair. However, bureaucracy and slow change is not all bad—and this is why it exists to begin with. (I could have put Process as an example of “positive externalities,” where larger firms have advantages.) For example, bureaucracy is required when clients (and government regulation) want to reduce the probability that individuals can steal money or make really bad spur-of-the-moment judgment calls. If anything, the financial world is headed towards more bureaucracy and control after the Bernie Madoff scandal. (It will become harder for smaller funds to compete.) The Catholic Church survived for
13.4. The Economics of Project Interactions
Dilbert on Bureaucracy: 2012-12-04
Dr aft
thousands of years perhaps because it was so inflexible. It is the true canonical example for a status quo bias. The trick is to have the right amount of Process. Too much inertia, and the firm will forego many good new projects. Too little inertia, and the firm will be too fickle, and adopt bad projects and abandon good projects too early. In sum, the greater complexity that arises with more and larger projects can be a negative externality that every new project contributes to the firm.
325
Resource exhaustion: Perhaps the most common source of negative externalities—and one that is often underestimated—is limited attention span. Management can pay only so much attention to so many different issues. An extra project distracts from the attention previously received by existing projects. There are many anecdotal examples of overstretched attention spans. The most recent example of failed attention management may be the Great Recession, which left many investment bank shareholders with huge losses, and which ultimately cost the CEOs of Merrill Lynch, Citigroup, and others their jobs (but not their wealth). Most of these supposedly highly competent (and highly compensated) CEOs did not even know what their firms’ holdings and exposures were. They had to correct their own estimates multiple times, as they themselves learned only after the fact what their firms had actually invested in.
Although costs always include opportunity costs, in the case of negative project externalities these opportunity costs are more obvious. If your project cannibalizes another project or requires more attention, it’s clearly an opportunity cost.
When deciding whether to take a project, charge all negative interactions to the project. Because of these negative interactions, the overall NPV will be lower than the individual project NPVs alone. Again, as in the case of positive externalities, agency problems and cost allocation systems often prevent proper accounting for negative externalities in the real world. Whatever division created the negative externality will argue that it is not its problem and that the complaining division overstates the problem. Clearly, companies that are better at overcoming these issues will end up being more profitable. Q 13.8. Why is it so convenient to value projects that have zero externalities with one another?
Q 13.9. A company must decide if it should move division A to a new location. If division A moves, it will be housed in a new building that reduces its operating costs by $10,000 per year forever. The new building costs $120,000. Moving division A allows division B to expand within the old factory. This enables B to increase its profitability by $3,000 per year forever. If the discount rate is 10%, should division A move? Q 13.10. A firm can purchase a new punch press for $10,000. The new press will allow the firm to enter the widget industry, thereby earning $2,000 per year in profits forever. However, the punch press will displace several screw machines that produce $1,500 per year in profits. If the interest rate is 10%, should the new punch press be purchased?
IMPORTANT
Again, agency problems often prevent properly crediting projects for all their detractions.
326
Capital Budgeting Applications and Pitfalls
13.5
Usually, managers do not make the decision for all interacting projects simultaneously. Instead, many projects are already in place. Although existing projects should also constantly be evaluated in an ideal world, the manager often has to make a decision about adding or not adding a single new project (or project complex) in the real world. For practical purposes, the old projects are often present, given, and unalterable. The new project may have positive or negative externalities on other existing projects, and the question is how best to decide whether to take it or not. This simplifies the decision even further: The question is now only whether the new project adds or subtracts value from the total. In this case, economists use the concept of decision on the margin—holding the existing project structure as is, what is the additional contribution of the new project? Return to the U.S. state example. Let’s work it via the method of contributions on the margin. Naturally, we should arrive at the same conclusion:
Dr aft
Capital budgeting rule for a scenario in which you can either take or not take one extra project. The rest stays in place.
Evaluating Projects Incrementally
You can come to the right decision by using the marginal method, too.
• If you have already committed to RI, you would earn only $40,000. Adding NY would get you to $200,000. Thus, entering NY would bring marginal benefits of $160,000 (and not $120,000).
• If you have already committed to NY, you would earn only $120,000. Adding RI would get you to $200,000. Thus, entering RI would bring marginal benefits of $80,000 (and not $40,000).
Note that having one of the states committed increases the marginal value of the other state that you should use in your calculations.
IMPORTANT
• The decision on whether to take one additional project should be made based on the following rule: Accept New Project If:
Total Firm NPV with Total Firm NPV without > New Project New Project
• This means that the single new project should be credited with any value increase or value decrease that it confers on other projects.
• When considering a project on the margin (i.e., extra), credit/charge to this project all externalities that this project conveys onto the existing firm.
• Everything else equal, projects with positive externalities on the rest of the firm have higher marginal benefits than do projects with negative externalities.
The big advantage of the marginal method is its solvability when there are many, many choices—possibly infinitely many.
Although the marginal perspective on costs and benefits has also worked for our discrete “yes or no” projects, it becomes a lot more useful when you consider projects of which you can take a little more or a little less. (In fact, enumerating all possible combinations is no longer feasible.) Marginal thinking also helps you to understand economies of scale, sunk costs, overhead allocation, and space capacity. The marginal perspective on costs and benefits is particularly useful when it comes to projects that are not just “yes or no” but are projects of which you can take a varying amount—more or less of the project. With rare exceptions, the incremental way of thinking is the only way to make sense out of real-world complexity. Q 13.11. A notebook computer costs $2,500; a desktop computer costs $1,500. If you buy either the notebook or the desktop, you can increase your productivity to $9,000. If you buy both, you
13.5. Evaluating Projects Incrementally
327
can increase your productivity to $11,000. (There is no time-value dimension to your choice.) Assume there is no computer resale market or alternative use for a computer. 1. If you do not own either, should you buy the notebook, the desktop, both, or neither?
Dr aft
2. If you own the notebook, should you buy the desktop? What are the marginal costs and benefits?
3. If you own the desktop, should you buy the notebook? What are the marginal costs and benefits?
Economies of Scale
Consider an example in which there are economies of scale—the more airplanes you build, the lower your average per-airplane production cost will be (in millions): Average Cost per Airplane = $4 +
$10 Number of Airplanes + 1
This states that it costs $4 + $10/(1 + 1) = $9 million to produce 1 airplane. Producing 100 airplanes costs you $4 + $10/(100 + 1) ≈ $4.10 million per airplane. Again, let’s assume that the interest rate is zero, so you do not need to discount. Now say that you are currently selling 4 airplanes domestically, each for a price of $8 million. Your firm’s net value is $10 Total Net Value = 4 · $8 – 4 · $4 + = $32 – $24 = $8 (13.1) with 4 Airplanes 4+1 Your big decision now is whether you should expand internationally. It would cost you $16 million to open a foreign sales office, but doing so would sell another 5 airplanes at the same $8 million per-airplane price. Should you expand? With 9 airplanes in production, your average cost would fall to $4 + $10/10 = $5 million per airplane. This means that 5 airplanes would cost only $25 million to build now, and bring in 5 · $8 = $40 million. The value of your foreign office would therefore be Value of Foreign Office = Value
5 · $8
–
5 · $5
–
$16
An example in which your production function is continuous and exhibits economies of scale.
Should you expand production?
An average cost calculation tells you not to expand.
= -$1
= Gross Sales – Average Cost – Start-Up Cost
This calculation suggests that you should not expand internationally.
Unfortunately, this calculation is wrong. To see this, compute your total net value if you open the foreign office. Your 9 airplanes generate sales of $72 million. Subtract your production costs of 9 · $5 = $45 million and your opening costs of $16 million. This means that your firm would be worth Total Net Value with 9 Airplanes = 9 · $8 – 9 · $5 – $16 = $11
Wrong! The reason is that the foreign sales office also lowers the cost of domestic production!
(13.2)
This is more than the $8 million that you earned without the foreign office. This is the correct calculation. It tells you that you should expand internationally, because this expansion will increase your net value by $3 million. The difference between the right and the wrong calculation is that your foreign office has one additional marginal benefit that the first calculation overlooked: Foreign sales also reduce the average production cost of your domestic production. This cost reduction is a positive externality that you must credit to your foreign office. If you do not, you are throwing away $3 million.
You must credit the foreign office with any domestic cost reductions.
328
Thinking in terms of marginal costs exposes the economies of scale.
Capital Budgeting Applications and Pitfalls
It is often more intuitive to think of projects such as airplanes in terms of marginal costs and benefits. The extra marginal cost of each airplane changes airplane by airplane—it is the difference in total costs of all airplanes: Planes
$9.00 $7.33 $6.50 $6.00 $5.67
Total $9.00 $14.67 $19.50 $24.00 $28.33
Marginal $9.000 $5.667 $4.833 $4.500 $4.333
Planes 6 7 8 9 10
Average $5.43 $5.25 $5.11 $5.00 $4.91
Total $32.57 $36.75 $40.89 $45.00 $49.09
Marginal $4.238 $4.179 $4.139 $4.111 $4.091
Dr aft
1 2 3 4 5
Average
Economies of scale are often responsible for the big corporate success stories of our time.
Negative economies of scale work alike.
If you go from 4 to 9 airplanes, your production creates extra marginal costs of $4.333 + $4.238 + $4.179 + $4.139 + $4.111 = $21 (million). There is an additional marginal cost of $16 million to open the foreign office. The total marginal cost is therefore $37 million. The marginal benefit of 5 extra airplanes is $40 million. Therefore, your foreign sales office creates marginal value of $40 – $37 = $3 million. This is exactly the difference between $8 million from Formula 13.1 and $11 million from Formula 13.2. Thinking in terms of marginal costs and benefits is just a different and sometimes more convenient way to compare overall project values. Economies of scale (decreasing marginal costs) are often responsible for the biggest corporate success stories. For example, Wal-Mart and Dell have managed not only to use their scales to negotiate considerable supplier discounts, but they have also created inventory and distribution systems that allow them to spread their fixed costs very efficiently over the large quantities of goods they sell. They have the lowest costs and highest industry inventory turnover rates—two factors that allow them to benefit tremendously from their economies of scale. Similarly, Microsoft enjoys economies of scale—with a large fixed cost and almost zero variable cost, Microsoft can swamp the planet with copies of Windows. No commercial alternative can compete—Microsoft can always drop its price low enough to drive its competitor out of business. The socially optimal number of operating-systems software companies is very small and may even be just one—it is what economists call a natural monopoly. If you think of the economy as one big firm, you would not want to incur the same huge fixed software-development cost twice. The same applies to utilities: You would not want two types of cable strung to everyone’s house, two types of telephone lines, and two types of power lines. But companies with monopolies can also hurt the economy: They will want to charge higher prices to exploit their monopoly powers. Society has therefore often found it advantageous to regulate monopolists. Unfortunately, the regulatory agencies are themselves often “captured” by the companies that they are supposed to regulate, which can sometimes hurt the economy even more than the monopolies themselves. There are no easy and obvious solutions. Of course, there are also plenty of examples in which marginal costs are not decreasing, but increasing, with the number of items produced. In such cases, you must charge the diseconomies of scale to the new division you are adding. If you do not, you will be inclined to overexpand and thereby reduce your firm’s overall value. Q 13.12. The average production cost per good is estimated at $5 + $15/(x + 1). The firm can currently sell 10 units at $20 per unit. 1. What is the current total profit of the firm?
2. How much should the firm value the opportunity to sell one extra good (i.e., #11) to a new vendor? In other words, what is the marginal cost of selling one extra good?
13.5. Evaluating Projects Incrementally
329
3. A new vendor offers to pay $19 for one unit. However, your other existing vendors would find out and demand the same price. What is the marginal cost and benefit of signing up this new vendor now? Should you sign up this new vendor?
Dr aft
Q 13.13. A firm faces diseconomies of scale in both production and sales. It can produce goods for an average per-unit cost of $5 + (Q · $1 + $20)/100, where Q is the number of units. For example, to produce 10 goods would cost 10 · ($5 + $30/100) = $53. The market price per good is $7 – Q · $1/100. So, sales of 10 goods would generate 10 · ($7 – $10/100) = $69 in gross revenues. Use a spreadsheet to answer the following questions. 1. How many items should the firm produce?
2. What are the average per-unit gross sales at this point?
3. What is the average per-unit production cost at this point?
4. What are the average per-unit net sales (gross minus cost) at this point? 5. What are the marginal per-unit sales at this point? 6. What is the marginal per-unit cost at this point?
7. What is the marginal per-unit net change at this point?
8. If your average per unit net change at this point is positive, should you expand production? Why?
Sunk Costs
Sunk costs are, in a sense, the opposite of marginal costs. A sunk cost is an incurred cost that cannot be altered or reversed. It is a done deal and therefore should not enter into your decisions today. It is what it is. For example, consider circuit board production—a very competitive industry. If you have just completed a circuit board factory for $1 billion, it is a sunk cost. What matters now is not that you spent $1 billion, but how much the production of each circuit board costs. Having invested $1 billion is irrelevant. What remains relevant is that the presence of the factory makes the marginal cost of production of circuit boards very cheap. It is only this marginal cost that matters when you decide whether or not to produce circuit boards. If the marginal board production cost is $100 each, but you can only sell them for $90 each, then you should not build boards, regardless of how much you spent on the factory. Though tempting, the logic of “we have spent $1 billion, so we may as well put it to use” is just plain wrong. Now, assume that the market price for boards is $180, so you go ahead and manufacture 1 million boards at a cost of $100 each. Alas, your production run has just finished, and the price of boards—contrary to everyone’s best expectations—has dropped from $180 each to $10 each. At this point, the board production cost is sunk, too. Whether the boards cost you $100 to manufacture or $1 to manufacture is irrelevant. The cost of the production run is sunk. If boards now sell at $10 each, assuming you cannot store them, you should sell them for $10 each. Virtually all supply costs eventually become sunk costs, and all that matters when you want to sell a completed product is the demand for the product. Sunk costs are everywhere. With the passage of time, virtually all decisions at some point become irrevocable and thus sunk. The examples are so abundant that you can even find whole books about them. Allan Teger’s book Too Much Invested to Quit describes investments such as the continuing Concorde airplane development even after it had already become clear that it would never become profitable. One more note—time itself often, but not always, decides on what is sunk or not. Contracts may allow you to undo things that happened in the past (thereby converting a sunk cost into a cost about which you still can make decisions), or they may bind you irrevocably to things that will happen in the future.
Sunk costs cannot be altered or reversed and thus should not enter into your current decisions.
An example of how first the capital investment becomes sunk, and then how the produced goods themselves become sunk.
Sunk costs are everywhere!
Time is a good proxy for what is sunk, but it may not be the deciding factor.
330
IMPORTANT
A sunk cost has no cost contribution on the margin. It should therefore be ignored. The flip side of not ignoring sunk costs and refusing to throw in the towel is “exasperation”— though it can come about through compartmentalization (explained in Section 13.7). It can occur when you think that you have already put too much money into the project, and rather than spend any more, you throw in the towel. You just consider your budget to be exhausted and you abandon the project, rather than doing the right thing (which would be to finish it).
Dr aft
Exasperation—letting sunk costs frustrate you and misinterpret your marginal costs and benefits.
Capital Budgeting Applications and Pitfalls
Overhead Allocation
Allocating already existing overhead budget to a project (i.e., adding it to the new project’s cost) is a common real-world example of bad project valuation and decision making.
A closely related mistake is to forget that “overhead” is often a sunk cost. By definition, overhead is not a marginal cost but something that has been incurred already and is allocated to departments. For example, assume your firm has spent $500,000 on a computer that is currently idle half the time. It serves only one division. Assume that another division can take an additional project that produces $60,000 in net present value but will consume 20% of the computer’s time. Should your firm take this project? If 20% of the cost of the computer is allocated to this new project (i.e., 20% · $500,000 = $100,000), the net present value of the new project would appear to be –$40,000. But the correct decision process is not to allocate the existing overhead as a cost to divisions. The $500,000 on overhead has already been spent. The computer is a sunk cost—assuming that it really would sit idle otherwise and find no better purpose. It may seem unfair to have charged only the original division for the computer and exempt the other opportunistic divisions. Yet taking this additional project will produce $60,000 in profits without any additional cost—clearly, a good thing. Everyone who has worked in a corporation can recite plenty of examples in which overhead allocation has killed otherwise profitable projects.
Real-World Dilemmas in Allocating Spare Capacity
If capacity is otherwise unusable, it should have a zero price.
Average cost allocation—an empty parking spot problem.
Should you charge your new division? Should you charge anyone?
Limited capacity is a subject that is closely related to overhead allocation. For example, consider building or buying corporate car garages that can park 300 cars for $1.5 million per garage. As CEO, you have to make choices about how many garages you want to have and how you should charge your corporate divisions for parking spots. Of course, having a garage makes owning corporate cars more profitable, because they will not deteriorate as much. A new garage offers a positive externality on the project “corporate cars.” Here is a bad solution to your problem: Charge users the average cost of building the garage. For example, you may calculate that about 150 cars from your corporate divisions would volunteer to use it, then divide the cost of $1.5 million by 150, and allow these divisions to buy spots at $10,000 each (which may be equivalent to, say, $60 rent per month). First, you may run into the standard overhead allocation problem. You may find that 75 of the 150 cars may not even take you up on the offer, and you may have to increase the rate to $120 per month. At this rate, more may jump ship, and you may end up with no cars wanting to go in. Second, even if you get all 150 cars to sign up, you still end up with another 150 empty spots—spots that could be used to park other, older corporate cars. You would never have built a garage just for them, but it would make sense to put them into the existing garage if it is otherwise empty. The marginal cost of adding one more old car would be zero. Is this how you should price parking spots? If you charge zero to the division for older cars, how would your other divisions with newer cars, who are still paying for their parking spots, feel? Should these divisions be charged then? After all, the marginal cost of their new cars, given that the garage is already built, is also zero.
13.5. Evaluating Projects Incrementally
Often you do not have easy, smooth margins. And you face more questions—these are difficult real-world dilemmas.
Dr aft
These are internal cost allocation issues that inevitably bring out the worst in discussions among corporate division managers. Everyone will claim that it should be the other party that should pay more of the cost. One reason why this is so difficult is that you can only add capacity in discrete chunks. And there is a time dimension, too. Should you really charge zero for parking corporate cars if you suspect that the unused capacity will not remain unused forever? What if another division comes along that wants to rent the 150 currently unused garage spaces in the future? Do you then kick out all the older cars that you gave spots to for free (or a very low price)? How should you charge this new division if it wants to rent 160 spaces? Should you give it the 150 remaining unused parking spots for free and build a new garage for the extra 10 cars? Presuming that garages can only be built in increments of 300 parking spots each, should you build another 300-car garage? Should this new division pay for the new garage, or should the divisions that held the original 150 spots pay a part of this or relinquish some of their original spots? If you ask the new division to pay, should it get a refund if some of the 290 spots are eventually rented out? Should you charge parking fees for these 290 spots? Tough questions. Usually, you should think in terms of the relevant marginal benefits and costs. But this does not work well if capacity can only be added in large discrete chunks. In that case, the extra cost of just one more parking spot is either zero or $1.5 million. If you charge marginal cost, demand also may not be marginal. At an internal price of zero, you will likely have a large number of users—more than the garage can accommodate. At a price of $1.5 million, no user will want to pay for the garage. You can think of less extreme schemes, but the basic problem is intrinsically the discreteness of capacity. Remarkably, there are clear answers as to how you should solve your two dilemmas:
331
1. Pricing of existing capacity: You should use the magic of the market-price system to allocate your existing capacity. You should set the internal price of each parking spot so that those users who would value the garage the most will want to reserve exactly the 300 spots that are available. Do not set the parking spot price so that the garage generates maximum profits. (If you do, you may find yourself with parking rates that are too high, and cars that are parked on the street while the garage has some unfilled spots.) If there are more existing spots than cars that could benefit from a spot, then you should even set the parking spot price to zero. From an overall corporate perspective, it does not matter how or who you charge—just as long as you get the optimal capacity utilization. To the extent that cost allocation distorts optimal marginal decision making (i.e., that cars that should be in the garage end up not using the garage), it should be avoided.
Here is how to think about the parking allocation in terms of margins.
Advice: Use a market-pricing system if you can, to push the decision down to the divisions themselves. But do not try to maximize garage profits.
2. Building more capacity: You should build more capacity when the marginal cost of adding the garage of $1.5 million is less than the marginal benefit of parking cars indoors. In principle, this is easy. In practice, this is difficult, because you need to forecast future parking needs.
Note that neither of these two decision rules requires the garage to generate profits by itself. In fact, your goal is to maximize the overall profit of the firm, which is achieved through optimal capacity allocation. It is irrelevant whether this increase comes about through a profitable garage or through more profitable divisions.
Managerial Gaming
Unfortunately, real life is not always so simple. Return to the earlier example of an Internet connection that has a positive influence on all divisions. You know that divisional managers will not want to pay for it if they can enjoy it for free—you cannot rely on them telling you correctly how much they will benefit. Would it solve your problem to charge only divisions that are voluntarily signing up for the Internet connection, and to forcibly exclude those that do not?
It becomes much harder if you do not know the right outcome, so you have to “play games” with your subordinate managers.
ä Internet connection example, Pg.323.
332
Capital Budgeting Applications and Pitfalls
Dr aft
If you do this, then you could solve the problem of everyone claiming that they do not need the Internet connection. However, you are then stuck with the problem that you may have a lot of unused network capacity that sits around, has zero marginal cost, and could be handed to the nonrequesters at zero cost. This would create more profit for the firm. Of course, if you do this, or even if it is suspected that you will do this, then no division would claim that they need the Internet to begin with, so that they will ultimately get it for free. For some projects, it is not clear whether financial incentives can solve even the first problems—if one of your top scientists has focused decades of her life on exploring Resveratrol as a potential longevity drug, do you really believe this scientist will now tell you if some of her preliminary findings now point towards a non-finding? In sum, what makes these problems so difficult in the real world is that as the boss, you often do not know the true marginal benefits and marginal costs, and you end up having to “play games” with your divisional managers to try to make the right decision. Such is real life! And in real life, more often than not, headquarters just mandates Internet usage and charges divisions for it, whether they like it or not. Hopefully, this is also the correct choice from a firmwide value-maximization perspective.
HQ often flies blind.
Q 13.14. A company rents 40,000 square feet of space and is using 30,000 square feet for its present operations. It wishes to add a new division that will use the remaining 10,000 square feet. If it adds the division, equipment will cost $210,000 once, and the operations will generate $50,000 in profits every year. Presently, the office staff costs $160,000 per year. However, the expansion requires a larger staff, bringing costs up to $180,000 per year. If the cost of capital r = 10%, should the firm expand?
13.6
A real option is the value of the flexibility to change course in the future.
Real Options
There is another valuation issue that you have to consider. It can be even more important than externalities—and more difficult to work out. It is the fact that your ability to change course in the future, depending on the prevailing economic environment in the future, can itself create value. Such flexibility is called a real option (or sometimes a strategic option). In principle, the valuation of a real option is just a complex variant of the NPV problem. You have to assess all expected cash flows and their costs of capital correctly. In practice, the resulting complications can be so difficult that entire books have been written on this subject. Let me give you a taste of what real options are and how to value them.
A Specific Real Options Example
An example of a factory.
A factory costs $3 million to build. It can transform $2 million worth of inputs into 1 million gadgets. If demand is strong, gadgets will sell for $9 each. If demand is weak, gadgets will sell for $1 each. The discount rate is 10%. The expected value of the factory is therefore (in millions) 50% · ($1 – $2) + 50% · ($9 – $2) 1.1 NPV = Factory Cost + Present Value of Net Sales NPV =
– $3
+
≈ – $0.273
You should not undertake this project. Or should you?
Without the real option, you could have calculated the NPV using just the most likely (expected) pricing path.
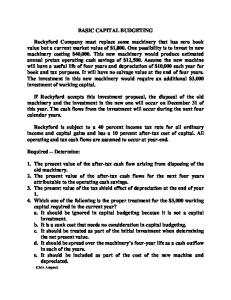
Take a look at Exhibit 13.1. Without considering real options, there are two possible outcomes:
1. Weak demand: The running factory will yield –$1 million in net sales, which turns into –$3.909 million in total net present value.
13.6. Real Options
333
Recognize Real Option Shut Down if Optimal (Smart NPV)
–$3 million –$2 million +$1 million = –$1 million –$3.909 million
–$3 million $0 million $0 million = $0 million –$3 million
Factory, Time 0 Inputs, Time 1 Sales, Time 1 Net, Time 1 ⇒ NPV at 10%, Time 0
–$3 million –$2 million +$9 million = $7 million +$3.364 million
–$3 million –$2 million +$9 million = $7 million +$3.364 million
Total Net Present Value
–$0.273 million
+$0.182 million
Dr aft
Ignore Real Option Always Run Factory (Dumb NPV)
Prob
Component
50% Demand is Weak
Factory, Time 0 Inputs, Time 1 Sales, Time 1 Net, Time 1 ⇒ NPV at 10%, Time 0
50% Demand is Strong
A. Ignore Real Option
NPV 1 � � ≈ –$3.909 � ak� We� is � d� n a 1 � / 2 em� bility D� a �� Prob s� PP PP Prob abili ty 1/ DemPPP 2 and PP is St PP rong P NPV q P ≈ +$3.364 Expected Value: –$0.273 million
B. Recognize Real Option
NPV 1 � � = –$3.000 � ak� We� is � d� n a 1 � / 2 Dem� lity ��Probabi sP �� PP P P robabi lity 1 DemPPP /2 and PP is St PP rong P NPV q P ≈ +$3.364 Expected Value: +$0.182 million
Exhibit 13.1: A State-Contingent Payoff Table for the Factory.
334
Capital Budgeting Applications and Pitfalls
2. Strong demand: The running factory will yield $7 million in net sales, which turns into +$3.364 million in total net present value. Because both outcomes are equally likely, your loss is the $0.273 million already calculated. However, if you can shut down the factory when demand is weak, then your factory is worth more. You still get the upside (a full $3.364 million in present value), but you no longer suffer the full –$3.909 million downside. That is, you would still be out the up-front $3 million cost of the factory, but you would at least not produce an extra future loss of $1 million by running it. With the real option to shut down when demand is weak, your factory is worth about 50% · (–$3) + 50% · ($3.364) = +$0.182 million. (If you are really clever, you may detect that I am falsely assuming that your cost of capital is still 10%. This may no longer be the case. However, the contribution of your cost-of-capital uncertainty to your valuation is usually much more modest than the contribution of your cash flow uncertainty.) Remarkably, real options are an instance in finance where you actually like uncertainty in the underlying economic environment. For example, how would you value the project if you could change the sales from the +$1 and +$9 million to $0 and +$10 million? In the bad state, it would not make a difference to you. You would still just shut down the factory and lose $3 million. However, in the good state, you would now earn $8 million next year, not $7 million. Your NPV would therefore go from $0.182 million to 50% · (–$3) + 50% · ($4.273) ≈ +$0.637 million. With its real option, this firm is a little similar to a contingent equity claim: As owner, you can still get the upside, but you do not suffer the full downside. However, it is not the limited liability that has created this payoff pattern. Instead, it is your managerial flexibility that increases the factory’s expected cash flow. Your flexibility means that this factory is well worth building.
Dr aft
With the real option, you can shut down the factory if there is no demand.
Uncertainty usually makes real options more valuable!
Family resemblance: This particular real option is like limited liability.
ä Limited liability, Sect. 6.4, Pg.121.
Q 13.15. Your factory can either stamp 150,000 CDs at a cost of $5 per CD, or 500,000 CDs at a cost of $8 per CD. If your CD has a hit song, you can sell it to retailers for $10 per CD. Otherwise, you can only charge $6 per CD. There is a 1-in-10 chance that your CD will be a hit. You will not find out whether you have a hit until next year, but fortunately this will be before you have to stamp CDs. Your cost of capital is 10% per year. You only have the lease of the factory for next year. There is no production this year. 1. What is the expected selling price per CD?
2. How many CDs should you produce at the expected selling price—that is, if you had to gear the factory for a particular production quantity today? 3. What is the value of your factory if you can decide next year? 4. What is the value of flexibility in this example?
Importance and Valuation Difficulty
You cannot work out the project value based on the expected input and output costs. You must work out a scenario analysis in a decision tree.
The reason why real options are so difficult to value is that you get the wrong answer if you are working out the value at the expected (or most likely) inputs. In our example, the expected gross sales were (50% · $9 + 50% · $1) = $5 million. This was more than the $2 million cost of inputs. Thus, you would operate, which would give you $3 million in expected net sales next year. This is not enough to cover the $3 million in up-front factory costs today. You would therefore conclude that you should not undertake the factory—a mistake. In effect, in our example, working with the expected inputs is the same as assuming that you would always act the same way in the future, regardless of demand. Instead, the correct way to value a real option is first to consider all possible future demand scenarios, then to determine your own optimal behavior and the
13.6. Real Options
335
resulting cash flows in each scenario, and only finally to compute expectations over all possible scenarios. This is almost always easiest to do in a decision tree, like the one at the bottom of Exhibit 13.1. In management-speak, it is called scenario analysis.
IMPORTANT
Dr aft
• The expected value of a project is not the value of the project at its expected value or its expected inputs. • This means that you cannot value a real option by computing project value in the expected (or most likely) scenario.
• Instead, you must first determine all possible scenarios, then figure out your own behavior and the cash flow this earns in each scenario, and only finally compute the expected net present values over all scenarios.
ä Sensitivity analysis, Pg.55.
Sensitivity analysis is a close relative of scenario analysis. It means trying out different assumptions to see how sensitive the NPV is, and is usually done in a valuation spreadsheet. If it considers different managerial responses, it becomes in effect a form of scenario analysis. Simulation analysis (also called Monte Carlo simulation) can be an automated form of sensitivity or scenario analysis. It, too, is sometimes used to value real options. These methods can be simple or complex, and are generally beyond the scope of this book. (More real option valuation techniques are explained in a web chapter, which—you should be warned—is also a difficult chapter.) Valuing real options is so complex that it is not used as often as simpler NPV techniques, but it is also not obscure. In the same survey described in Section 4.5, 27% of surveyed CFOs explicitly value real options. About 52% perform sensitivity analyses and 14% perform simulation analyses. The ubiquity and economic importance of real options are unfortunately often matched by the difficulties that arise in estimating their values. They become both economically more important (and more difficult to value) when projects last longer and when there are many possible economic scenarios. You have to figure out what you would do in every possible future scenario. Sometimes, this is feasible. If there is only one variable that determines your optimal action, such as one prevailing product price, then the problem can often be broken down in a way that simplifies it. Sometimes, this is infeasible. If your decisions cannot be made based on just one variable, but instead depend in turn on the future or the past, then the complexities become vexing. For example, if it costs money to close and reopen your plant, then your decision to close the plant must also depend on your assessment of how quickly the product price can recover. If there is a good chance of recovery soon and if closing/reopening a factory is expensive, you may take your chances and continue operating your factory even if you incur a small loss. In turn, this means that you may find yourself with an operating or nonoperating plant, depending on the history of past demand, and this can influence what you decide to do in this period, too. With history dependence, even your optimal decision rule itself can be very difficult to work out. In any case, the current product price is no longer the only decision variable that you have to take into consideration, and this makes it a complex problem. A final complication is that the presence of a real option can have an influence not only on the expected cash flows but also on the cost of capital. For example, if this real option helps you to avoid losses when the stock market goes down, then your market beta and/or your cost of capital could be lower, too. You already know that the cost of capital can have a strong value influence, especially for long-lived projects. However, compared to your headache of estimating the uncertainty about your cash flows and of assessing your own future flexibility, your headache about the right cost of capital is usually only a secondary malaise.
Here is what real-world managers tell us they do.
ä CFO valuation method survey, Sect. 4.5, Pg.67.
Real options are tough to value. If the optimal decision depends on the past history (and not just the current environment), then this problem becomes even harder.
There are also cost-of-capital implications, but we have mostly ignored them.
ä Cost-of-capital errors, Sect. 4.1, Pg.55.
336
Capital Budgeting Applications and Pitfalls
Embedded Real Options Here are some other examples of real options.
Most corporate projects teem with embedded real options. For example: Expansion or contractions: If the future turns out better (or worse) than expected, firms can expand (or contract). In the extreme, firms may outright abandon a project.
Dr aft
Acceleration and delay: If the future turns out better (or worse) than expected, firms can speed up (or slow down) projects. This can often be done by hiring (or firing) additional consultants and contractors. Switching: Different technologies may be best in different future scenarios—and some projects may be more amenable to multiple technology alternatives.
Spinoffs: If a technology makes a serendipitous discovery, firms can start entirely new businesses.
Many projects are nothing except real options.
Different projects contain different types of real options.
It is most important to recognize the real options that you have.
The companion chapter on real options values some examples of these options. In fact, many projects are nothing but real options: For example, the value of unused land around cities is essentially the option that the city might expand enough to make building on the land economically worthwhile. Research and development often have no immediate usefulness, or even usefulness in the most likely scenario—but there is a chance that it might yield a highly profitable discovery. You have to consider this real option value in your expected cash flow computation, or you will underestimate your project’s value. Real options become even more tantalizing when you consider not just the real options for one particular project but the fact that different projects come with different types of real options. For example, replacing workers with expensive, high-fixed-cost robots may be cheaper in the most likely scenario, but it effectively gives up on the real option to lay off workers if the future turns out worse than expected. Have you properly valued the project that has more real options? Obviously, it would be best if you knew perfectly the types and exact values of all your real options. In practice, this is usually impossible. You should therefore focus on the most important real options. Strange as it may sound, the most common mistake that many managers commit when it comes to real options is that they just do not recognize that the real options are there. Once you recognize real options, even if you cannot fully value them, at least you can try to find an “intuitive” value adjustment. Fortunately, you have one further bit of knowledge that may help you here: The presence of a real option can only increase project value, because it is the value of your flexibility.
13.7
Model inputs are usually not what they should be.
Innate human decision biases cause predictable valuation mistakes.
Dilbert on managerial overconfidence: 2013-01-18
Behavioral Biases
So far, we have neglected that you need accurate inputs and that you need to use them rationally if you want to make good decisions. But most cash flow and cost-of-capital estimates rely on human judgment, which is prone to all sorts of errors. We know that our brains tend to commit systematic decision errors. Managers who fail to recognize these biases will make poor decisions. There are literally dozens of well-known behavioral errors, but limited space allows us to highlight just three: overconfidence, relativism, and compartmentalization.
1. Overconfidence is the tendency of people to believe that their own assessments are more accurate than they really are. In lab experiments, ordinary people are found to be dramatically overconfident. When asked to provide a 90% confidence interval—which is just a range within which they are confident that their true value will lie in 9 out of 10 times—most people end up being correct only 5 out of 10 times. It is difficult to document overconfidence empirically—after all, if it were easy, managers would recognize it themselves and avoid it. However, there is empirical evidence that many Deeper: This chapter’s appendix escalates the depth of explanations for real options. The Real Options web chapter escalates it even further.
13.7. Behavioral Biases
337
Dr aft
managers who are already heavily invested in their own company tend to throw caution overboard and voluntarily invest much of their own money into the corporation—even in companies in rather shaky financial shape. There is also good empirical evidence that those of us who are most optimistic in overestimating our own life expectancy disproportionately will become entrepreneurs. Even if optimism is a disease, it seems to be a necessary one for entrepreneurs!
ANECDOTE
Small Business Failures
In New York City, two out of every five new restaurants close within one year. Nationwide, the best estimates suggest that about 90% of all restaurants close within two years. If successful, the average restaurant earns a return of about 10% per year. Owners seem to lose money on average. So, why open yet another restaurant? I mentioned earlier that restauranteurs may just enjoy owning restaurants. But a more likely explanation is that restaurateurs are overly optimistic and just do not realize how tough it is to run a restaurant profitably.
More generally, a Small Business Administration study of small business failures from 1989 to 1992 found that 33% of businesses failed within 2 years, 50% within 4 years, and 66% within 6 years. Yet in a survey of about 3,000 entrepreneurs, 81% of entrepreneurs believed that their chances of success were at least 70%, and 33% believed that they had zero chance of failure! San Diego Online (Jan 2002), Business Week (Apr 2001), WSJ (Oct 2002), and other sources
2. Relativism is the tendency of people to consider issues of relative scale when they should not. For example, most people are willing to drive 15 minutes to a store farther away to save $40 on the purchase of $80 worth of groceries, but they would not be willing to drive the 15 minutes to a car dealer farther away to save $100 on the purchase of a new $20,000 car. The savings appear to be less important in the context of the car purchase (0.5%) than in the context of a grocery purchase (50%). But this is flawed logic, similar to comparing IRRs while ignoring project scale. The marginal cost is driving 15 minutes extra, and the marginal benefit is a higher $100 in the context of the car than the $40 in the context of the groceries. Put differently, the problem is that humans tend to think in terms of percentages. The smaller the amount of money at stake, the more severe this problem often becomes. When a gas station advertises a price of $2 per gallon rather than $2.10, some customers drive for miles and wait in long lines—all to fill a 20-gallon gas tank at a total savings that amounts to a mere $2. 3. Compartmentalization is the tendency of people to categorize decisions. Most people are more inclined to spend more when the same category has produced an unexpected windfall earlier. For example, winning a lottery prize while attending a baseball game often makes winners more likely to purchase more baseball tickets, even though the project “baseball game” has not changed in profitability. Similarly, an unexpected loss may stop people from an otherwise profitable investment that they should make. For example, say an individual likes to attend a particular baseball game. If she loses her baseball game ticket, she is less likely to purchase a replacement, even though the cost and benefit of purchasing the ticket are the same as they were when the original ticket was purchased. Compartmentalization can sometimes be the opposite of the sunk cost mistake. For example, Federal Express went through three venture capital funding rounds in the 1970s, the first two leading to rather disappointing operating profits. The investors that then compartmentalized—refusing to throw “good money after bad money”—lost everything. Only investors in the final venture capital round got rich. Sidenote: To understand overconfidence better, you can go to the class notes accompanying this chapter and take the quiz (questionnaire). Taking this quiz will make you understand overconfidence better than reading long paragraphs of prose here. (Incidentally, the only population segments who are known not to be systematically overconfident are weather forecasters and clinically depressed patients.)
338
Capital Budgeting Applications and Pitfalls
Know thyself to avoid these errors! Q 13.16. Is relativism a bigger problem when evaluating small or large projects?
Dr aft
Q 13.17. Describe how common mental decision biases can bias NPV calculations.
13.8
Incentive problems arise when the information provider has incentives that are different from those of the project owner.
The essence of the problem.
Try to hire ethical employees...and please behave ethically, too.
Dilbert on Ethics and Self-Interest: 2012-10-06
Incentive Issues
Mental biases are not the only source of bad choices. Another kind of bias arises when one individual has to act on behalf of others. This is called an agency problem or moral hazard. For example, it occurs in situations in which the owner of a project has to rely on information from someone else, who has divergent interests. A cynical synopsis of agency biases would be that “all people act and lie in their own selfinterests.” Now, although everyone does have incentives to lie—or at least to color the truth—to make themselves better off, not everyone does so equally. Of course, not many people sit down and contemplate how to intentionally lie and cheat. Instead, they convince themselves that what is in their best interest is indeed the best route to take. Thus, mental biases often reinforce incentive problems: “Wishful thinking” is a disease from which we all suffer. My strong personal advice is to hire only employees that you judge to be intrinsically honest and ethical (and even then, not to tempt them too much). Ultimately, unethical employees will always find a way to cheat you, no matter how competent they are and no matter how good your controls are. But figuring out who is intrinsically honest is also very difficult: sociopaths seem notoriously honest. It’s what makes them so dangerous. Sadly, economics training often reinforces unethical tendencies. It points out what you can do to enrich yourself and almost makes it seem normal. It even helps rationalizing your own unethical behavior with some version of “it’s their own fault—it’s what they should have expected.” I hope you won’t fall into this trap. Instead, follow the golden rule: treat others as you would like to be treated. Yet, in the end, this section’s message is simple: you should keep in mind that despite their best attempts to control cheating, organizations remain rife with agency problems.
Some Examples of Moral Hazard
Conflict-of-interest dilemmas are pervasive and important in organizations.
Agency problems exist up and down the corporate ladder. The top management has to rely on division managers who have to rely on department managers who have to rely on their subordinates for information about what they should do and how profitable potential projects really are. You can take the fact that we have already had to mention agency problems repeatedly to indicate how important and pervasive they are. But, again, lack of space forces us to highlight just a few issues with some examples: 1. Competition for capital: Managers often compete for scarce resources. For example, division managers may want to obtain capital for their projects. A less optimistic but more accurate estimate of the project cash flows may induce headquarters to allocate capital to another division instead. Thus, division managers often end up in a race to make their potential projects appear in the most favorable and profitable lights.
Dilbert on Mentoring and Succession: 2013-07-17
2. Employment concerns: Managers and employees do not want to lose their jobs. For example, scientists may tend to highlight the potential and downplay the drawbacks of their areas of research. After all, not doing so may cut the project and thereby cost them both their funding and then their jobs. Think about it—how can you evaluate new drug development, when the only person who understands it is the scientist herself?? Once hired, employees like to be indispensable. This leads them not to want to communicate their work to
13.8. Incentive Issues
potential successors. It is well-known that many IT departments live on not despite but because of poorly designed software. CEOs rarely like to groom potential successors.
Dilbert on Indispensable Wally: 2013-03-10
Dr aft
3. Perks: Managers do not like to give up perks. For example, division managers may like to have their own secretaries or even request private airplanes. Thus, they are likely to overstate the usefulness of the project “administrative assistance” or “private plane transportation.”
339
4. Power: Managers typically love to build their own little “empires.” For example, they may want to grow and control their departments because bigger departments convey more prestige and because they are a stepping stone to further promotion, either internally or externally. For the same reason, managers often prefer not to maximize profits, but instead focus on maximizing sales. 5. Hidden slack: Managers like to be able to cover up problems that may arise in the future. For example, division managers may want to hide the profitability of their divisions, fearing that headquarters may siphon off “their” profits into other divisions. They may prefer to hide the generated value (through legal accounting maneuvers discussed in the next chapter), believing that the cash they produced in good times “belongs” to them and that they are entitled to use it as “plaster” in bad times.
6. Reluctance to take risk: Managers may hesitate to take on risk. For example, they may not want to take a positive-NPV project because they may get fired if it fails—and may not be rewarded enough if it succeeds. A popular saying once was that “no one was ever fired for buying IBM.” Then, Microsoft took over from IBM. Then, Oracle. Then, ...
7. Direct theft: Managers and employees have even been known to steal outright from the company. For example, a night club manager may not ring sales into the cash register. Or a sales agent may “forget” to charge her cousins. In some cases, this can be a fine line. Is taking a pad of paper from your company or answering a personal email on company computers really theft? In other cases, the theft is blatant. In September 2002, Dennis Kozlowski, former CEO of Tyco, was charged with looting $600 million. His primary defense was that he did so in broad daylight—with approval from the corporate board that he had helped put in place. (It was a little too brazen—Dennis spent 10 years at Club Fed.)
Contributing Factors
We do know where agency problems play bigger and lesser roles:
1. Scale and owner engagement: In a small company with one owner and one employee, agency conflicts are less important than they are in big corporations with their many layers of management and disengaged owners. Do you believe that professionally run companies really make the best decisions on behalf of their public shareholders? Remember that agency issues do not just arise between shareholders and management—they start with the lowest-level employee and bubble all the way up to the top-level CEO. Decision making is often based on a chain of miscommunications or even deceptions. It is a testament to the importance of sharing risks among many investors that large, publicly-traded companies still manage to net-in-net create shareholder value! 2. Project duration: If the project is short term and/or comes with good interim progress points, it is easier to reward managers appropriately for success and punish them for failure than it is for longer-term projects. For example, think how you would judge and reward a manager who is (supposedly) working on an R&D project that is not likely to have visible results for decades. This is a difficult task. Agency problems for large and very-long-term projects may be so intrinsically high that they cannot be undertaken.
Agency problems are worse in certain (known) situations.
340
Capital Budgeting Applications and Pitfalls
Dr aft
3. External noise: If good luck is an integral and important part of the project, it becomes more difficult to judge managerial performance, which in turn aggravates agency problems. For example, it is relatively easy to measure the productivity of a line worker in a factory; you know whether he works or slacks off. Therefore, agency problems matter less. In contrast, it is more difficult to determine if your sales agent worked hard but the customer just did not bite, or if your sales agent was to blame. Similarly, your night-watch security guard may or may not be working hard, and it could take years before you could learn (probably the hard way) whether she regularly stayed awake or just dozed off.
Dilbert on Wally’s Choice: 2012-12-02
4. Opaqueness: If information is very difficult for outsiders to come by, agency problems will be worse. For example, if only your manager sees what projects are available, he can present only those that he would like to undertake. He can also not mention those that have higher NPVs but require skills he may not have or that require work he finds unpleasant.
Control Mechanisms
There are mechanisms that can help control agency problems.
Dilbert on Compensation Specificity: 2012-11-28
Dilbert on Contract Specificity: 2013-07-07
Fortunately, the principals (i.e., the owners) are not helpless. There are a number of mechanisms that can help alleviate agency problems.
1. “Voluntary” Disclosure: If it is possible for employees to volunteer their information credibly (e.g., that they can be sued after the fact if they have lied), then firms can insist on employees disclosing this information. For example, think of a situation in which every division claims that it has better projects than others. If it was possible for divisions to reveal everything they know, even if they did not want to (because the information is bad), there would be no agency problem. Headquarters would simply not fund any division that did not disclose everything. 2. Contract Specificity: It may be possible to write contracts that are detailed and specify everything that your employee or contractor might or might not do. Of course, if you want to write too detailed a contract, then the other side will begin to wonder what your own true intentions are—or even take it as a license to commit bad-faith behavior that your contract forgot to specify.
3. Audits: If the company runs independent assessments or audits, managers can make decisions based on better information, even if their employees are unwilling to provide it. However, many consultants suffer from the same disease as employees: They know that they are most likely to be rehired if they tell the manager what she wants to hear. 4. Truth-telling incentives: If managers can be rewarded for telling the truth, agency conflicts will become less important. For example, if your company has a research scientist who has expertise in alpha-proteins and works on an alpha-protein project, your goal as manager should be to allow this scientist to say, without suffering any negative consequences, “Do not waste your money putting any more research dollars into alpha-proteins.” This means that the scientist’s salary and promotion chances must remain the same regardless of the research outcome—even if this means that she no longer has a good alternative use for her time and effort. You might even offer a reward for any scientists who voluntarily cancel their projects due to lack of viability. Would you really be willing to carry through on such a promise? Would your research scientists believe that you will? Some companies also undertake post-audits, which are designed to evaluate not only the quality of the financial numbers (like a usual audit) but also the quality of managers’ up-front forecasts. Knowing that there will be such post-audits will strengthen managers’ incentives to give accurate forecasts to begin with. 5. Contingent compensation: If managers are rewarded more for a successful project (or if they are more likely to be retained), agency conflicts can become less important. This is
13.8. Incentive Issues
341
Dr aft
the carrot-and-stick approach. For example, if you pay your managers bonuses only when their projects succeed (or fire them when their projects fail), then your managers may work harder and choose projects that they believe are more likely to succeed. The press calls this pay-for-performance—and there is much argument about whether U.S. CEOs are paid so much because they need to be motivated and because they work so hard, or because the corporate board members are their friends. Of course, like any other mechanism to control agency problems, the pay-for-performance control strategy has its costs, too:
• Competent managers may not want to work for you if they get paid only if the firm succeeds. You may end up driving the best risk-averse managers to work for your competition instead. • Risk-averse managers may not take positive-NPV risky projects. • Contingent compensation creates incentives to inflate performance—not to tell the truth. • Less risk-averse managers may take huge negative-NPV risks in order to gamble for a huge bonus. This is a huge problem in the financial services industry. Pay-forperformance is a good idea when employees can only improve the average outcome if they work harder. It was invented in the context of factory piece work. Payfor-performance is a bad idea when employees can also increase the variance of outcomes. In this case, traders and CEOs may want to ramp up risk, especially when their performance is not properly benchmarked for risk (which is very difficult to do). Would you prefer 10% of a $1 million gamble or a $1 billion gamble? Pay-forperformance then becomes a recipe for disaster. The next financial crisis is already pre-programmed: the incentives in the financial industry are still all wrong today. (And don’t think the government is the salvation. It’s like asking the fox to guard the hen house.)
You will sometimes read how humans are more complex than this. Here is my own take on this: It is true that aspects other than pay can help motivate your employees. But, with exceptions, your employees first and foremost work for compensation. (In the military, soldiers will risk their lives for comrades and sometimes for medals and rank. In charities, many employees may be truly altruistic.) The violations are interesting, not because they are so common, but because they are so rare.
6. Reputation: If managers can build a reputation for truth-telling and capable management, they are less likely to undertake bad projects. For example, agency concerns are likely to be a worse problem when it comes to secret one-shot projects, where your managers cannot build a track record that will help them with future projects. On the other hand, sometimes reputational considerations can themselves become the problem. Witness the many dysfunctional but beautifully artistic office buildings that are primarily monuments to some famous architectural firms.
Dilbert on Cash vs. Recognition Comp: 2013-05-19
7. Capital rationing: If nothing helps to restrain your managers from wasting money when they get it, just don’t give it to them. Or give them only enough money to satisfy their most urgent needs, hoping that these needs will then more likely be positive-NPV projects. 8. Selecting managers: There are people out there who are more inclined to be honest and others who are not. If you can hire managers of high integrity, they may not abuse the firm (or do it less), even when it is in their own self-interest. Again, dealing with honest individuals may well be the most important (partial) remedy to the agency problem. Even if there are exceptions, your first baseline assumption should be that your employees are self-interested. Most of us are. Are you really any different? And everyone will try to convince themselves that what they are doing in their own self-interest is appropriate and ethical, even if
Some losses due to conflict of interest are unavoidable. The best “solution” is ample skepticism and common sense.
342
Capital Budgeting Applications and Pitfalls
Dr aft
it is not. Some more so than others. There are no obvious and cheap solutions to moral hazard problems. You would not want to spend a million dollars in audit fees and complex control mechanisms to save a hundred dollars in theft. You would not want to hire a manager of the highest integrity who is utterly incompetent over another manager who may steal a small amount but will otherwise generate enormous value for shareholders. In the real world, you have to realize that all firms suffer conflict of interest. All you can do is to try to limit this intelligently. As a manager or principal, remain skeptical of your employees’ estimates and judgments and take the biases and incentives of each information provider into account. My last word is a reminder: Do not let the fact that I just spent a few pages on agency problems fool you. They are everywhere and they are important.
Corporate Governance
A very important aspect of managing moral hazard in firms is how firm owners (shareholders and creditors) deal with their firms—what rights they have. This is called corporate governance. If the top managers are not incentiviced to do the right thing, they will also not incentivice their subordinates to do the right thing, either. (The medieval proverb “the fish stinks from the head downward” very much applies.) How do shareholders and creditors get “their” managers to act in shareholders’ interest—and not to buy themselves lavish airplanes, or take excessive gambles with investors’ money? It’s a tough problem. Good management is Do not confuse good management with good corporate governance. Governance matters not good governance. only if management is bad. Apple’s Steve Jobs was not only the world’s best-performing manager, but he also did not charge a lot of executive compensation. In contrast, corporate governance at Apple was poor. Jobs was almost in complete control of a board that was officially supposed to supervise him. This bad governance did not matter in his case. Yet, if Jobs had decided to go rogue, it could have. Arguing that good managers do not need good governance is like leaving your wallet lying around because most people will not steal it. Do not tempt fate. Eventually, someone will. Corporate governance in In many large Fortune-100 companies with diffuse shareholders, management is actually the U.S. is badly broken pretty good. However, corporate governance is usually pretty bad. If self-interested, a CEO intent for many firms. It works on gaining control of the board that supposedly supervises him or her will usually only take a few well for smaller firms. years to stack the board with his friends. The best example of a complete absence of corporate governance was the financial industry collapse in the Great Recession. Almost all financial firms had very little real incentives and did very little to control risk before the crisis. Risk control was no more than lip service. Heads, the bonus payments would make the executives rich and shareholders better off. Tails, the shareholders and the government would lose. Thus, almost all financial executives, who had gambled and ultimately lost all their shareholders’ money, still + Ctr for Public Integrity: walked away super-rich. Most are worth more than $100 million each today. (Of course, they The Price of Failure: would have ended up even richer if heads had come up more often. They did not want the Ex-Wall Street CEOs still living large financial crisis to happen.) PS: Don’t think that anything fundamental has changed. No board has ever clawed back paid-out bonuses. The incentives to gamble remain overwhelming. Hired lobbyists are convincing the legislators and regulators to roll back even the limited Dodd-Frank reforms. (And please don’t think our government is less conflicted.) This is why the next financial crisis is already pre-programmed. But it works well when Fortunately, corporate governance works pretty well for small and growing firms—and there are concentrated especially in private equity firms, whose business it is to run their own portfolio firms under owners. tight supervision. In fact, private-equity firms often pay their corporate managers more than publicly-traded firms pay theirs—but they also fire them more often. Read all about it... The companion book contains a full chapter about corporate governance. It’s my favorite. You should read it. Corporate governance is how shareholders and creditors control the firm.
13.8. Incentive Issues
ANECDOTE
343
Fiduciary Responsibility, or the Fox Guarding the Henhouse
On Wednesday, December 29, 2004, the Wall Street Journal reported on page 1:
Dr aft
In the biggest U.S. merger this year, JP Morgan Chase & Co. announced last January it would acquire Bank One Corp. To assure investors it was paying fair price, JP Morgan told them in a proxy filing that it had obtained an opinion from one of “the top five financial advisors in the world.” — Itself. The in-house bankers at JP Morgan endorsed the $56.9 billion price—negotiated by their boss—as “fair.”
Next to the main article was a sidebar called “Passing Muster,” which explained:
A ‘fairness’ opinion tells a company’s board that a deal’s terms are fair to shareholders. Purpose: Legal protection from an investor claim that a deal was done without due care. Cost: A few hundred thousand dollars to a few million. Potential Conflicts • Bankers may have incentives to call a deal fair because most of their advisory fee is paid only if the deal closes. • Bankers’ fee is tied to the deal price. • Bankers may support a deal where executives will personally profit, in hopes of securing future work. • Bankers use financial data supplied by a client who wants the deal to go through. • When the deal maker is a bank, its own bankers often write the fairness opinion.
Remember that everyone—in-house bankers, management, and corporate boards—are employed by the shareholders, to whom they owe fiduciary responsibility and whose interests they are supposed to represent. It is a clear agency conflict for an employee to provide a fairness opinion. But it would also be difficult for management to have these in-house bankers fired for doing them a personal favor—another agency conflict. And there is also the original agency conflict: the incentive of acquiring managers to pay too high a price or of target managers to accept too low a price. Here is how the WSJ story continues: But during the negotiations, Bank One Chief Jamie Dimon had suggested selling his bank for billions of dollars less if, among other conditions, he immediately became chief of the merged firm, according to a person familiar with the talks. That suggestion wasn’t accepted by JP Morgan.
Obviously, Jamie Dimon did not offer to pay his own personal billions for the privilege of becoming CEO early, but Bank One’s shareholders’ billions. Obviously, the JP Morgan management did not decline these billions on behalf of their own pockets, but on behalf of JP Morgan shareholders’ pockets.
Still, there are of course the corporate boards that could have fired either the in-house bankers or their management teams. Neither happened. Instead, Jamie Dimon took over as head of JP Morgan, as scheduled, on December 31, 2005. On May 16, 2013, as more companies split the CEO and chairman position, news companies reported how Dimon had handpicked his board members for many years. Unlike many of his fellow bank executives, Dimon knew how to survive the Great Recession of 2008! The Wall Street Journal
Q 13.18. Describe common agency problems and explain how they are likely to bias corporate NPV calculations.
344
Capital Budgeting Applications and Pitfalls
13.9
After reading this chapter, you probably understand now why professors think “theory is easy.” The complications of real life make theory look like a child’s game. Yes, the principles of capital budgeting theory are easy—only their application is hard. It is usually very difficult to estimate future cash flows (and even their appropriate interest rates), especially for far-in-the-future returns. It is usually more important and more difficult to avoid errors for the expected cash flow (the NPV numerator) than it is for the cost of capital (the NPV denominator). The NPV formula is less robust to cash flow errors than it is to cost-of-capital errors, and it is “easier” to commit dramatic errors in the cash-flow estimation than in the cost-of-capital estimation. Here is an abbreviated checklist of items to consider when working out NPV estimates.
Dr aft
If you think academics like to make easy things difficult, you have it totally wrong. It is academics who try to avoid the difficult problems.
An NPV Checklist
Here is an abbreviated list of issues to worry about when using NPV.
• Appropriate (after-tax) dollars (Pages 80, 83):
– Have you quoted all relevant inputs and outputs in relevant-to-you after-tax dollars? This applies to both expected cash flows and to appropriate discount rates. (Corporate income taxes will be covered in more detail in Chapter 18.) – Have you properly included inflation? Preferably, have you performed all computations using nominal expected future cash flows and nominal costs of capital, with inflation used only to gross up nominal cash flows appropriately?
• Interactions (Pages 318, 321):
– Have you credited all projects with their contributions, positive or negative, to the values of other projects (externalities)? – Have you judged all projects “on the margin,” that is, without charging them for unalterable or previously made choices, such as sunk costs, overhead, and so on? – Have you used the cost of capital applicable to each project component, respectively, and not the (incorrect) overall average cost of capital? (Note: Some errors and simplifications here are unavoidable in the real world, because it is impossible to put different costs of capital on each paper clip.)
• Real options and flexibility (further discussed in the companion chapters on options and real options):
– Have you considered all possible future options (using scenario analyses) in order to find the correct expected cash flows, such as, 1. 2. 3. 4. 5. 6.
your ability to extend a product into different markets, your ability to find product spinoffs, your ability to learn about future products, your ability to stop the project if conditions are bad, your ability to delay the project if conditions are bad, your ability to mothball the project if conditions are bad and to restart the project if conditions improve, 7. your ability to accelerate the project if conditions are good, 8. your ability to expand the project if conditions are good,
and so on?
• Accuracy (Pages 55, 222, 336, 338):
– How accurate are your estimated project cash flows? – If project success and project cash flows were estimated by someone else, what are the assessor’s motives? How tainted can these estimates be? Does the estimator want the project accepted or rejected?
13.9. An NPV Checklist
345
– Is it possible to get another independent evaluation/audit of the project estimates? – Can your cash flow estimates be improved by doing more research? – Given unavoidable simplifications, assumptions, and errors, how sensitive/ robust are your NPV calculations to changes therein?
Dr aft
• Correct inputs (Page 315):
– Are your cash flows expected rather than promised? Are your interest rates expected rather than promised? (Recall: Expected interest rates are below promised interest rates due to default premiums, not just due to risk premiums.) – Are your expected cash flows the “average outcome” (correct), and not the “most likely outcome” (incorrect)? – Do your expected cash flow estimates include the correct weighted probabilities of low-probability events, especially for negative outcomes? – If you need to borrow money to execute the project, have you used the expected (not the promised) borrowing rate as your cost of capital? If capital is already available, are you using your expected lending (investments) rate as the appropriate cost of capital?
• Corporate income taxes (To be covered on Page 473f):
– For use of WACC and APV, is the numerator in your NPV calculation the expected cash flow “as if all equity financed”? (This means that the company bears the full brunt of its corporate income tax load.) – In the weighted cost of capital, is your debt cost of capital the expected (not the promised) interest rate on debt? Is your numerator the expected cash flow, not the promised cash flow?
A final warning: Although many of these issues seem obvious in isolation, they are much harder to spot and take care of in complex real-world situations than in our highlighted expositions. Watch out! Another warning against the most common error is worth its own box:
The most common NPV method is to estimate cash flows for the numerator, and to use an expected rate of return (cost of capital) from a model like the CAPM (see Chapter 10).
• The default risk is handled only in the numerator, that is, in the computation of expected cash flows.
• The time premium and risk premium are handled only in the denominator. The CAPM formula provides an expected rate of return, which contains only these two components.
• Do not try to adjust the cash-flow numerator for the time or risk premium. Do not try to add a default premium to the rate of return in the denominator. (This would yield a promised, not an expected, rate of return on capital.) Do not believe that you have taken default risk into consideration merely by using the CAPM expected rate of return in the denominator.
Q 13.19. The CEO projects earnings of $100 million next year. List three reasons why this might not be a good input into an NPV valuation.
ä WACC and APV, Sect. 18.2, Pg.473.
Easy here. Tough in the jungle.
IMPORTANT
346
Capital Budgeting Applications and Pitfalls
Summary This chapter covered the following major points:
Dr aft
• You should never confuse promised and expected cash flows in the numerator, or promised and expected rates of return in the denominator. The expected cash flows are often not the most likely cash flows, either.
• Corporations can reduce their risk by diversification—but if investors can do so themselves as easily, diversification per se does not create value. As a manager, you can create value only by increasing cash flows or decreasing the cost of capital. Diversification for the sake of diversification does not add value.
• You should not use the cost of capital applicable to the entire firm, but rather the cost of capital applicable to each new project. However, because the effort involved can be enormous, it is reasonable to use individual, project-specific costs of capital only when it really makes a difference.
• When selecting projects, consider all possible project combinations and choose the combination that gives you the highest overall NPV. • You should attribute to each project’s NPV its influence on other projects, either positive or negative. If a project is independent from other projects, you can consider its NPV in isolation, and add it to the total.
• You should think about how you can take advantage of, or create, positive externalities among projects. If you cannot, there is no reason for the firm to exist in the first place. • You should think “on the margin”—take all projects that contribute more marginal benefits than they create marginal costs.
• You should consider economies of scale, which can reduce average production costs and thus add to project value. • You should ignore sunk costs.
• You should take real options into account. These are the value of your ability to change course depending on future conditions. They include your flexibility to delay or accelerate projects, and to expand or shut down projects.
• You should be aware of your own biases, such as overconfidence, relativism, compartmentalization, and others. • You should realize that real-world implementation problems—which range from differences in short-term and long-term marginal costs, to political reasons and agency considerations inside corporations—often make taking the best set of projects difficult. • You should design your operations to reduce agency conflicts when it is marginally profitable to do so. • To make your task a little easier, refer to the NPV checklist in Section 13.9.
No doubt about it: Good capital budgeting is a difficult problem. Each subsection covered in this chapter can easily be expanded into a full chapter, or even a full book. There are pitfalls everywhere. In the end, capital budgeting is as much an art as it is a science. You have to rely as much on common sense and intuition as on the mechanics of valuation. The best analysis combines both.
End of Chapter 13 Material
347
Preview of the Chapter Appendix in the Companion In the Appendix
Dr aft
The appendix to this chapter shows how to value some specific real option scenarios with decision trees.
Keywords
Agency, 338. Audit, 340. Compartmentalization, 336. Corporate governance, 342. Diseconomies of scale, 324. Economies of scale, 327. Externality, 323. Hedging, 317. Heuristic, 322. Independent, 323. Interaction, 323. Limited attention span, 325. Limited capacity, 330. Monte Carlo simulation, 335. Moral hazard, 338. Natural monopoly, 328. Negative interaction, 324. On the margin, 326. Overconfidence, 336. Pay-for-performance, 341. Positive interaction, 323. Post-audit, 340. Private equity, 342. Process, 324. Real option, 332. Relativism, 336. Scenario analysis, 335. Simulation analysis, 335. Status quo, 325. Strategic option, 332. Sunk cost, 329. Synergies, 324.
Answers
Q 13.1 Yes, it makes sense to compare the project’s IRR to a hurdle rate. Indeed, if the hurdle rate is the cost of capital, the IRR rule tells you what you should do. Q 13.2 Comparing a project’s cost of capital to its hurdle rate would be silly, because your hurdle rate is just another name for your cost of capital in a perfect market.
Q 13.3 The Amazon.com bond’s stated 8% is a promised rate of return. It is not the expected rate of return. Therefore, it is not the cost of capital. Q 13.4 You cannot determine this, because you do not know the expected bond payoff. Q 13.5 The probabilities of different outcomes are as follows: Scenario
Probability
Y
PV
DDDD WDDD WWDD WWWD WWWW
0
1 2 3 4 5
$268 $507 $721 $911 $1,081
90% · 10% = 0.1000 90%1 · 10% = 0.0900 90%2 · 10% = 0.0810 90%3 · 10% = 0.0729 1 – above = 0.6561
1. The single most likely outcome (with 65.6% probability) is that the machine will operate for all 5 years (because there is only a 10% breakage probability each year). If this machine were guaranteed to work for exactly 5 years, then the present value would be PV = ($300/0.12) · (1 – 1/1.125 ) ≈ $1,081. The NPV would be $171. 2. The expected number of years that the machine will operate is 0.1·1+0.09·2+0.081·3+0.0728·4+0.6561·5 ≈ 4.1. If this machine were guaranteed to work for exactly 4.1 years, then the present value would be PV = ($300/0.12) · (1 – 1/1.124.1 ) ≈ $929. The NPV would be $19. 3. The true expected value is 0.1 · $268 + 0.09 · $507 + 0.081 · $721 + 0.0728 · $911 + 0.6561 · $1,081 ≈ $906. The NPV would be –$4. This number is lower than the $19, because the NPV at the expected outcome is not the same as the expected NPV. (The math name for this is Jensen’s inequality.)
(As usual, because of rounding, your answers may be slightly off from those I report here.)
Q 13.6 The merged firm has a lower standard deviation (it is safer), but this adds no value. Q 13.7 1. The new project’s value is $11/1.15 ≈ $9.57. At a cost of $10, the net present value is –$0.43.
2. The value today of the new project is $11/1.15 ≈ $9.57. Therefore, the weight of the new project is wnew = PVnew /PVcombined ≈ $9.57/$109.48 ≈ 8.74%.
3. The beta of the combined firm is βcombined = wold ·βold +wnew ·βnew ≈ 91.26% · 0.5 + 8.74% · 3 ≈ 0.719. � 4. The combined cost of capital according to the CAPM is E rcombined ≈ 3% + 4% · 0.719 = 5.876%.
5. Yes! The IRR of new is 10%. (For IRR, see Chapter 5, Page 73.) 10% is above the blended cost of capital of 5.876%. 6. The firm value would be
PV =
� � E Cnew + E Cold $105 + $11 � ≈ ≈ $109.57 1 + 5.876% 1 + E rcombined
Again, you conclude that the firm has destroyed $0.43.
Q 13.8 Zero externalities are convenient for valuation, because they allow you to add up NPVs. If there are nonzero externalities, the total NPV is larger or smaller than the sum of its part.
Q 13.9 Without taking the externality into account, the NPV of division A’s move would be negative. The $120,000 of costs would be higher than the benefit of $10,000/10% = $100,000. However, the correct answer is “Yes, division A should move.” Moving saves $10,000/10% = $100,000 in division A costs and $3,000/10%=$30,000 in division B costs. The total savings is therefore $130,000, which is $10,000 greater than the cost of the building.
348
Capital Budgeting Applications and Pitfalls
Q 13.10 The firm should not purchase the press, because it earns $2,000/10% = $20,000. But the press costs $10,000 to purchase and eliminates $1,500/10% = $15,000 of profits from the screw machines. The total cost of the press, including the $15,000 in opportunity costs, is $25,000. The project’s net present value is $20,000 – $25,000 = –$5,000.
Dr aft
Q 13.11 1. Either purchasing the desktop or the notebook would be a positive-NPV project. However, you should purchase the desktop, because it is cheaper (more bang for the buck). 2. You should still purchase the desktop. The marginal cost is $1,500. The marginal benefit is $11,000 – $9,000 = $2,000. 3. You should not purchase the notebook. The marginal cost is $2,500. The marginal benefit is $2,000.
5. From 44 to 45, the marginal per-unit sales is $294.75 – $288.64 = $6.11. From 45 to 46, it is $6.09. 6. From 44 to 45, the marginal per-unit cost is $254.25–$248.16 = $6.09. From 45 to 46, it is $6.11. 7. It is just about $0. (If you move from 44 to 45 units, or from 46 to 45 units, you gain 2 cents.) This is what it means to be at the optimal production level. 8. Your average per-unit net change at Q = 45 is still positive, but you should not expand production. If you do, you are ignoring the negative effects that unit number 46 would have on all your earlier units. This means that you would earn less money in total, not more.
Q 13.12 1. The profit of the firm is Profit(x = 10) = 10 · [$20 – $5 – $15/(10 + 1)] ≈ $136.36. 2. With 11 goods, the cost to produce is $5 + $15/(11 + 1) = $6.25. With 10 goods, it was $5 + $15/(10 + 1) ≈ $6.3636. The marginal production cost is $6.25 · 11 – $6.3636 · 10 ≈ $5.11. 3. The marginal cost would now be an additional $1 times 10 in rebates. It would therefore cost the firm $5.11 plus $10, or $15.11, assuming that the other clients also get the $1 discount ($19 price). Thus, because the marginal revenue of $19 exceeds the marginal cost of $15.11, the firm should still sign everyone up. Q 13.13 Total sales and costs are Units
Sales Price
Q
Q · (7 – Q/100)
1 2 . . . 43 44 45 46 47 . . .
$6.99 $13.96
$282.51 $288.64 $294.75 $300.84 $306.91
Production Cost
Net
Q · [5 + (Q + 20)/100]
$5.21 $10.44
$1.78 $3.52
$242.09 $248.16 $254.25 $260.36 $266.49
$40.42 $40.48 $40.50 $40.48 $40.42
1. The table shows that the optimal production is 45 units. 2. The average per-unit gross sales at Q = 45 is $294.75/45 = $6.55. 3. The average per-unit production cost at Q = 45 is $254.25/45 = $5.65. 4. The net sales at Q = 45 are $40.50/45 = $0.90.
Q 13.14 Yes, the firm should expand. The PV of the division’s profits will be $50,000/10% = $500,000. The division costs are $210,000 for new equipment and $20,000 per year in increased overhead. The PV of the increased overhead is $20,000/10% = $200,000. The total PV cost of the new division is $210,000+$200,000 = $410,000, and the PV of the benefits is $500,000. Thus, bringing in the new division represents a project with an NPV of +$90,000.
Q 13.15 1. The expected per-CD selling price is $6·90%+$10·10% = $6.40. 2. If $6.40 was the price, you would gear your factory to produce 150,000 CDs. Without flexibility, your factory would be worth 90% · [150, 000 · ($6 – $5)] + 10% · [150, 000 · ($10 – $5)] = 150, 000 · ($6.40 – $5) = $210,000. 3. With flexibility, you would expect to earn 90% · (150, 000 · [$6 – $5]) + 10% · (500, 000 · [$10 – $8]) = $135,000 + $100,000 = $235,000. 4. The value of flexibility is $235,000 – $210,000 = $25,000.
Q 13.16 Relativism may induce you to make mistakes on both types of projects (and it is not clear which one is worse): For small projects, you may chase a large percentage increase too vigorously. For large projects, you may not realize that even a small rate of return can be a lot of money. Q 13.17 Mental decision biases are the subject of Section 13.7. The text discussed overconfidence, relativism, and compartmentalization.
Q 13.18 Agency problems are the subject of Section 13.8. The text discussed eagerness for capital, employment concerns, direct theft, and desire for perks, power, and laziness. The effects can be manifold, often resulting is misvaluation of projects.
Q 13.19 First, the CEO’s projected figures probably represent the most likely outcome, not the expected outcome. It is probably more likely that the firm will go bankrupt due to totally unforeseen circumstances than that it will have a windfall. Second, the CEO has an incentive to distort the truth and report optimistic projections. This is an agency problem. Third, the CEO is probably subject to mental biases, too.
End of Chapter Problems
Q 13.20. Can you compare a project’s internal rate of return to its expected rate of return? Q 13.21. Does it make sense to distinguish between a promised and an expected internal rate of return? What do issuers provide? What do you usually need? Q 13.22. A zero-bond has a stated rate of return of 8%. Its price today is $92,593. What is its expected payoff?
Q 13.23. A machine that costs $2,000 is likely to break irreparably with 20% probability at the end of each year (assuming it worked the previous year). You can neither replace it nor use it for more than 5 years. (Many electric devices without moving parts have such breakdown characteristics.) The machine can produce $1,000 in profit every year. The discount rate is 12% per annum.
End of Chapter 13 Material
1. What is the most likely operating time? If this comes true, what is the value? 2. What is the expected operating time? If this comes true, what is the value?
Q 13.27. As the CEO of an expanding airlines cargo division, would you acknowledge that an increase in your operations would be harmful to the passenger division? Should you be charged for the increased use of shared maintenance facilities? Q 13.28. What are the main sources of positive externalities? What are the main sources of negative externalities?
Dr aft
3. What is the true net present value of this machine? (Hint: First work this out case by case for a two-year machine, then for a three-year machine. Think “D,” “WD,” “WWD,” “WWWD,” and “WWWWD,” where W means working and D means dead.)
349
Q 13.24. Practice the CAPM. A $300 million firm has a beta of 2. The risk-free rate is 4%; the equity premium is 3%. Assume that the firm can easily tap a perfect capital market to obtain another $95 million. The firm can also easily tap the financial markets. So far, it has had a policy of only accepting projects with an IRR above the hurdle rate of 10%. Suddenly, one of its main suppliers (perhaps one facing credit constraints) has approached the firm for a 1-year loan. Assume that the loan is risk free for you—you hold more than enough sway over your supplier to ensure repayment. The supplier wants to borrow $100 million and pay back $106 million next year. 1. Without the new loan, what is the firm expected to earn per year? 2. What is the NPV of the loan?
3. If the firm changes its policy and extends the loan, how would its value change? 4. If the firm changes its policy and extends the loan, approximately how would its beta change? 5. If the firm changes its policy and extends the loan, approximately how would its cost of capital change?
6. If the firm changes its policy and extends the loan, can you compute the combined firm’s NPV by dividing its expected cash flows (assets) by its combined cost of capital? 7. Should the firm change its policy?
Q 13.25. Assume that the risk-free rate is 5% and the equity premium is 2%. A $1 billion firm with a beta of 2 has just sold one of its divisions for a fair price of $200 million. The CEO is concerned that investors expect the firm to earn 9%, and so believes keeping the money in short-term Treasuries that only pay 5% would be a bad idea. Is it really a bad idea?
Q 13.26. What are the arguments for and against discounting every project by its own cost of capital?
Q 13.29. As a manufacturer, you have to decide how many regional distributors to sign up. Serving a distributor costs more the farther away it is from the factory, and different distributors have different demand. By region, gross revenues and costs are (in millions of dollars) as follows: Distributor
A
B
C
D
E
F
G
Gross Revenue Cost
$5 $2
$4 $2
$4 $3
$3 $4
$2 $4
$7 $5
$1 $6
There is no “time value of money” dimension in this problem. 1. Is it feasible to work out all possible combinations of distributors you can service? Is it sensible? 2. Which regions should you deliver to?
3. What is the total profit for serving them?
4. What is the marginal benefit and cost of serving the least profitable of your serviced distributors?
5. What would be the marginal benefit and cost of serving one more distributor?
6. Now assume that to get into this business, you would also have to set up the factory. This would cost you a one-time up-front expense of $5 million. You can think of this as spreading the cost across distributors. How would this change your decision?
Q 13.30. A firm can produce goods for an average per-unit cost of $5 + $10/(Q · $1 + 2). For example, to produce 10 goods would cost 10 · ($5 + $10/12) ≈ $58.33. The market price per good is $7 – Q · $1/10. So, you can fetch 10 · ($7 – $10/10) = $60 for selling 10 goods. Use a spreadsheet to answer the following questions. 1. What is the break-even point where total gross revenues are equal to total cost? 2. What is the gross profit (revenues minus costs) at the break-even point? 3. What is the marginal gross profit at the break-even point? 4. How many items should the firm produce?
5. What is the average per-unit gross profit at this point? 6. What is the marginal gross profit at this point?
350
Capital Budgeting Applications and Pitfalls
Q 13.31. Comment on, “It is best to allocate costs only to divisions that request a resource.”
Q 13.35. What are the types of real options that firms need to take into account in their project valuations?
Q 13.32. Comment on, “It is best to allocate costs to divisions that benefit from a resource.” Q 13.36. You have to purchase $600 worth of staples. You have just found out that the stationery store across from you charges $300 more than the warehouse outlet 20 miles away. Would you spend the 40 minutes to drive to the warehouse? Now, assume you are buying a Porsche that costs $100,000. You have just found out that the Porsche dealer also 40 minutes away offers the Porsche for $300 less. Assuming you can receive after-market service in both locations, would you drive 40 minutes to pay $99,700? What should you do from an economic perspective? Is this what you would be tempted to do?
Dr aft
Q 13.33. A perpetual firm’s headquarters consumes $1 million per year. It has six divisions of equal size, but not equal profitability. The annual profitabilities (in thousands of dollars) are as follows:
Project
Profitability
A
B
C
D
E
F
$180
$450
$900
$80
$130
$300
The cost of capital is r = 10%.
1. What is the firm’s NPV? 2. If the firm adopts a rule whereby each division has to carry its fair (size-based) share of the headquarter overhead. (Assume that the total amount of overhead does not decrease unless the whole firm is closed, in which case the overhead is 0.) What is the firm’s NPV?
Q 13.34. Your factory can either stamp 150,000 CDs at a cost of $5 per CD, or 500,000 CDs at a cost of $8 per CD. If your CD has a hit song, you can sell it to retailers for $10 per CD. If it is a moderate success, you can only charge $6 per CD. If it is a complete bomb, you cannot sell it at all. There is a 1-in-10 chance that your CD will be a hit, and a 3-in-10 chance that it will be a bomb. You will not find out whether you have a hit until next year, but fortunately this will be before you have to stamp CDs. Your cost of capital is 10% per year. You only have the lease of the factory for next year. There is no production this year. 1. What is the expected selling price per CD? 2. How many CDs should you produce at the expected selling price—that is, if you had to gear the factory for a particular production quantity today? 3. What is the value of your factory if you can decide next year? 4. What is the value of flexibility in this example?
Q 13.37. Explain how you can exploit human biases in attracting signups for your new health club.
Q 13.38. Describe a manifestation of an agency problem, where it is worse, and what can be done to remedy it.
Q 13.39. Are agency problems worse in startup or established firms? Discuss.
Q 13.40. Should you suppress all agency conflicts? Discuss.
Q 13.41. Contrast Google and Wal-Mart. Which agency conflicts are likely to inflict Google worse than Wal-Mart, and vice-versa? Discuss.
Q 13.42. Recall as many items from the NPV checklist as you can remember. Which are you most likely to forget?