ISPRS Annals of the Photogrammetry, Remote Sensing and Spatial Information Sciences, Volume II-3/W3, 2013 CMRT13 - City Models, Roads and Traffic 2013, 12 – 13 November 2013, Antalya, Turkey
BUILDING FOOTPRINTS EXTRACTION FROM OBLIQUE IMAGERY F. Nex a, E. Rupnik b, F. Remondinoa a
3D Optical Metrology (3DOM) unit, Bruno Kessler Foundation (FBK), Trento, Italy @fbk.eu, http://3dom.fbk.eu b GEO Department, Vienna University of Technology -
[email protected] Commission III - WG4 KEY WORDS: Matching, Automation, Oblique images, Extraction, Building ABSTRACT: Nowadays, multi-camera aerial platforms combining nadir and oblique cameras are experiencing a revival and several companies have proposed new image acquisition systems. Due to their various advantages, oblique imagery have found their place in numerous companies and civil applications. However, the automatic processing of such image blocks still remains a topic of research. Camera configuration indeed poses a challenge on the traditional photogrammetric pipeline used in commercial software but, on the other hand, gives the opportunity to exploit the additional information provided by the oblique views and allows a more reliable feature extraction. In particular, the information that can be provided in correspondence of building façades can open new possibilities for the building detection and footprint extraction. In this paper, a methodology for the automated extraction of building footprints from oblique imagery is presented. The extraction is performed using dense point clouds generated using an image matching algorithm. The developed methodology and the achieved results are described in detail showing the advantages and opportunities offered by oblique aerial systems for cartographic and mapping purposes. 1. INTRODUCTION The extraction of geometric and semantic information from image and range data is one of the main research topics in the Geomatics community. Between the different investigations, the automated building detection and footprint extraction have shown to be an important instrument for map updating, 3D city models generation, detection of unregistered buildings and change detection analyses. As a consequence, the development of automated solutions able to speed up the processing and reduce the costs of building detection and footprint extraction is greatly increased. Some works, using aerial and satellite acquisitions, detect buildings and delineate their footprints using images and exploiting shadows (Ok et al., 2013) or the generated DSM (Bredif et al., 2013; Nex and Remondino, 2012; Lafarge et al., 2008) or multi-spectral information (Zebelin et al., 2006). In other researches, the complementarity of different input data is investigated: LiDAR and multi-spectral images (Awrangjeb et al., 2010; Rottensteiner et al. 2007; Sohn and Dowman, 2007), multispectral images and GIS database (Dini et al., 2013). Beside the huge number of new sensors and systems proposed on the market, multi-camera oblique aerial systems represent one of the most innovative solutions. Their use was first adopted in the 1920s for military application but in the last years oblique imagery are becoming a standard technology for civil applications, thanks to the development of new commercial systems (Leica RCD30, Pictometry, Track’Air Midas, BlomOblique, IGI DigiCAM, Vexcel UltraCam Osprey, etc.). In the last years, most prominent cities in the world have been covered with oblique images and these flights are usually repeated every few years to keep up-to-date geodata. The images are usually coupled to GNSS and IMU information for georeferencing purposes. The main virtue of oblique images lies in its simplicity of interpretation and understanding for inexperienced users. The achieved information provides for a complete 3D information instead of a 2.5D data as in traditional nadir image blocks. Practical utility of this data is obvious but automated processing is still a challenge. These images were initially used for visualization purposes (i.e. Microsoft Bing) and just recently they have been used for metric purposes using
semi-automated and automated solutions. Several papers dealing with oblique images’ orientation have been already presented (Wiedemann and More, 2012; Gerke and Nyaruhuma, 2009) proposing the use of additional constraints within bundle adjustment (relative position between images, verticality of lines in the scene, etc.), or simply aligning the (not adjusted) oblique cameras to the (adjusted) nadir ones with the use of known relative position between images (Wiedemann and More, 2012). More recently other investigations have succeeded to automatically orient large image blocks with commercial (Fritsch et al., 2012) or open-source packages (Rupnik et al., 2013). Other research works have investigated the quality and the accuracy of the point clouds and successive products (e.g. building models) that can be generated using oblique imagery (Fritsch and Rothermel, 2013; Gerke, 2009; Besnerais et al., 2008). A filtered point cloud can be used to produce reliable polygonal models for visualization purposes (e.g. AppleC3 / iOS Maps). Anyway, the higher completeness of the information provided by oblique images allowed their use in very different applications, such as monitoring services during mass events and environmental accidents (Petrie, 2008; Grenzdörfer et al., 2008), road land updating (Mishra et al., 2008), administration services (Lemmens et al., 2008), building detection (Xiao et al., 2012), building damages classification (Nyaruhuma et al., 2012) and city modelling (Wang, 2012). In this paper a fully automatic methodology for building footprints extraction from oblique imagery is described. A reliable orientation procedure (Rupnik et al., 2013) is first applied and then dense point clouds are derived. The verticality of building façades is then exploited to detect buildings (filtering out the vegetation) and define their footprints in a reliable way for very different typologies of buildings. The completeness of the extracted building footprint is evaluated performing a visual inspection. 2. METHODOLOGY The workflow is composed of image orientation, dense matching, point cloud filtering and footprint extraction.
This contribution has been peer-reviewed. The double-blind peer-review was conducted on the basis of the full paper.
61
ISPRS Annals of the Photogrammetry, Remote Sensing and Spatial Information Sciences, Volume II-3/W3, 2013 CMRT13 - City Models, Roads and Traffic 2013, 12 – 13 November 2013, Antalya, Turkey 2.1
Image orientation and point cloud generation
The orientation of the images is performed using the APERO tool (Pierrot-Deseilligny and Clery, 2011). APERO adopts the following bundle adjustment strategy: i) computation of approximate values of all unknowns, ii) relative bundle adjustment in arbitrary coordinate frame (CF), iii) transformation of the results to a desired CF, iv) bundle adjustment for absolute georeferencing. Initial orientation approximations are computed with direct methods (spatial resection, essential matrix). As they work independently on one, two or three images, instead of the whole block, the risk of converging to a wrong solution is quite high. Complex geometry of oblique acquisitions make the process even more error prone. To ensure sufficiently good approximations for a large block of images, the most optimal order for the restitution of initial values is computed (Rupnik et al., 2013). An in-house developed tool creates a graph G that stores the topology of all image footprints. By analysing their overlaps, ground incidence angles as well as the number of common tie points, the best concatenation sequence is chosen. Then, the bundle in an arbitrary CF takes place. Finally the result is georeferenced with the help of external data i.e. projection centers from direct georeferencing. A dense point cloud is afterwards extracted using the MicMac (Pierrot-Deseilligny and Paparoditis, 2006) tool. The algorithm is based on an energy minimization function that keeps in count both a correlation and a regularization term in order to enforce surface regularities and avoid mismatches. MicMac works with master and slave images producing dense point clouds for each master image. It is based on a multi resolution approach, starting from a rough shape estimation and low resolution images and reaching extremely dense point clouds (up to 1 GSD resolution). As oblique imagery has very different conditions compared to traditional nadir one, the matching algorithm must keep in count a higher depth of field, larger perspective deformations and image scale changes. For these reasons, a very particular setting of the matching parameters was set, giving a low weight to the regularization term in the low resolution scales and progressively increasing this value in the higher resolution scales. In MicMac a dense reconstruction can be realised either in ground (‘ground terrain’) or image (‘ground image’) geometry. Aiming at a complete reconstruction (all building facades), the latter was selected as the image geometry allows to control from which images (masters) and points of views the scene is reconstructed. The in-house tool was extended to identify the relevant images for dense matching. Once a rectangular region of interest (ROI) is defined by a user, it is intersected with the footprints of the oriented images. The candidates for matching are then grouped according to their angle of incidence onto the ground. Out of all
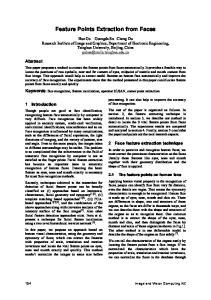
the candidates within a given group, those with perspective centers closest to the region itself and an overlap between neighbouring masters less than 20% are selected as masters. The ROI will eventually be fully covered with four sets of masters – one for each group (Figure 1). Dense point cloud computation is carried out separately in each image: building facades are normally reconstructed in four point clouds and the complete object is produced by merging the clouds. The masters are matched against a set of slave images contained within the graph G calculated during the image orientation phase. In Figure 2 an example of the achieved dense point clouds (resolution = 1 GSD) is shown.
Figure 1. Four sets of master images (each set marked with a distinct color) selected for the dense matching of a ROI. 2.2
Mixed pixels filtering
Photogrammetric point clouds can be still noise-affected and several mixed pixels can be present in case of rough depth variations. These mixed pixels are usually disposed in the direction of the perspective rays, where object borders and shadows occur, influencing the building footprints extraction (as well as the visual quality of the achieved point cloud). These points are usually grouped in clusters and cannot be easily removed simply by analysing the proximity of each point to its neighbours. For this reason, a filtering schema was developed, exploiting the master image position and attitude. The direction between the master image perspective centre and each point in the space is considered. Then, the local shape of the point cloud is computed considering the local surface direction in the point neighbourhood. Points are filtered when the local surface of the point cloud has almost the same direction of the perspective ray. In Figure 3 red points are filtered as the point cloud surface has locally the same direction of perspective rays (red angles), while the other points are preserved having a different direction (green angles). From our experience, a good filtering can be performed using thresholds of about 20°. In Figure 4 an example of the filtering results is presented: the wrong points appear to be completely removed.
Figure 2. Example of a dense point cloud from oblique images.
This contribution has been peer-reviewed. The double-blind peer-review was conducted on the basis of the full paper.
62
ISPRS Annals of the Photogrammetry, Remote Sensing and Spatial Information Sciences, Volume II-3/W3, 2013 CMRT13 - City Models, Roads and Traffic 2013, 12 – 13 November 2013, Antalya, Turkey visible although points corresponding to trees are still not removed. - Rough footprint detection. A raster image over the area is generated: the GSD is 1-2 times the point cloud resolution. The height values provided by the point clouds are stored in the raster according their planimetric coordinates. From this process a rough detection of building footprint is given, as most of the points are concentrated on the pixel defining the planimetric position of the walls. Anyway, the noise present around the façades prevent it from having a sharp position of each wall.
Figure 3. Schema of the mixed pixels filtering.
a)
b)
Figure 4. Examples of the original point cloud (a) and the filtered one after the removal of the mixed pixels (b). 2.3
Figure 5. Segmentation of a dense point clouds in vertical (red) and horizontal (points) points.
Footprint extraction
The building footprints can be defined as the outline of building roof borders vertically projected on the ground. Then, as also mapping agencies suggest, the building footprints can be modified considering the roof overhangs in order to infer the wall positions: this information can be directly extracted from oblique views of building. Point clouds on urban areas usually define four different main elements: roofs, walls, trees and ground that are characterized by different orientations and shapes. Buildings are usually characterized by vertical walls that define the footprint of each building and can be reconstructed using image matching on oblique images. Points laying on walls are very close each other, lay on vertical planes and have almost horizontal normal vectors, with the exception of balconies and noisy areas. On the other hand, trees are usually characterized by irregular and sparse positions of adjacent points and the distributions of normal vectors between adjacent points is usually very irregular. Finally, the ground and the roof are usually rather smooth surfaces with normal vectors vertical and other objects on the roads (i.e. parked cars) are usually smalls and of reduced heights. With these considerations in mind, the developed methodology for building footprint extraction consists of the following steps: - Normal vector and noise filtering. A first selection of points is performed considering only the points with local normal vector horizontal. In particular, a threshold of 10° is usually considered in order to segment the point cloud. An area of about 1 m around each point is usually considered for the corresponding normal vector estimation. In Figure 5, an example of the achieved results is shown. In this way, points in correspondence of balconies, roofs and ground (blue points) can be filtered from the walls points (red points). A noise filtering is then performed: most of the points in correspondence of trees, trunks and noisy façades, that hadn’t been removed before, are removed in this way. In Figure 6, the walls captured from a specific master image can be seen: all the main façades are
Figure 6. Extracted wall candidates from the produced point clouds. Some noise is still present in presence of trees. For this reason, the height values are considered to define the more suitable building façades position. In particular, points laying on each planimetric coordinates are analysed to define the correct building footprint position . Three different rules are kept in count: (a) the height difference between the higher and lower point, (b) the number of points and (c) the homogeneity of the points distribution in Z. The minimum difference in Z is usually set to 2.5 m, as it is the minimum height of a building. The minimum number of points depends on the GSD on the ground and the level of noise. A value ranging from 15 to 20 is usually adopted. Finally, the distribution of points must be regular on a façade: the mean distance between points should is kept in count. This constraint is almost true when flat façades are considered, but it fails when balconies overhang from the
This contribution has been peer-reviewed. The double-blind peer-review was conducted on the basis of the full paper.
63
ISPRS Annals of the Photogrammetry, Remote Sensing and Spatial Information Sciences, Volume II-3/W3, 2013 CMRT13 - City Models, Roads and Traffic 2013, 12 – 13 November 2013, Antalya, Turkey façade profile are present and points in correspondence of these regions are deleted. Points respecting all the rules are stored as wall points while points following rules (a) and (b) but not (c) are stored in a “reserve” layer and they could be used in the following step. After this process, points on trees are mostly removed as this regions are usually irregular and characterized by irregular distribution of Z in the space. - Morphological filtering. The boundaries extracted in the former step appear incomplete and irregular. Several parts of the main façades are generally missing, especially due to balconies or other overhanging structures. In this case, the façade is reconstructed considering the “reserve” layer and evaluating if these points can bridge regions of the same façade. In this way, the completeness of the façade detection is increased. Several gaps between different parts of the façades can be still filled with a dilation process (Figure 7a). - Skeletonization. At this stage the building façades are not defined yet by sharp lines but the façade outlines have still 2-3 pixels width. For this reason, a skeletonization algorithm (Rumpf and Telea, 2002) is performed in order to thin the façade outlines. The skeletonization algorithm could generate several useless edges in correspondence of noisy areas that are filtered out: short (less than 3 meters long), contorted (very curved) and disconnected from other edges are removed. - Footprint smoothing. The obtained footprints can be affected by some noise as they are extracted directly from the photogrammetric point clouds. For this reason, a smoothing is performed to define a regular shape of the object, easing each building outline in set of lines and curves. The great majority of building footprints can be mainly classified in sets of lines and (rarely) in second order curves. Therefore, each edge must be split in different basic entities that describe its linear or curved parts separately. Each separate basic entity is then simplified in lines and curves fitting the dominant point information with a robust least squares approach (Nex and Remondino, 2012). These lines are finally merged together to reconstruct the geometry of each footprint (Figure 7b).
with a 80 mm and the oblique ones with a 100 mm focal length. Oblique cameras were rotated in the four looking directions (forward, backward, left and right), 45° with respect to the nadir. Two different dataset were considered. The first dataset consists of about 200 images over a mixed areas, composed both by residential and industrial buildings. The second block has about 550 images (425 oblique, 125 nadir) covering an area of 8 x 3.5 km. Only in the central part of the block the images show all the building façades. The façades are both with and without balconies and several high trees are present in big boulevards. Some smaller buildings are in the inner parts of the courtyards. The shadows are quite long on the scene as the images were acquired at the end of February. In both cases, the overlap between images acquired by the same camera was 80% along track and 50% across track. The GSD of oblique images is about 14 cm. The imaging system was accompanied by the Applanix GNSS/IMU for the geo-referencing of the whole block in the UTM WGS84 reference system. Unfortunately no ground control point was available and the topographic map of the area was not sufficiently accurate and up-to-date to be used as ground truth.
Figure 8. The first (red rectangles) and the second (blue rectangles) test areas over the city of Milano (Italy). 3.2
a) b) Figure 7. Building boundaries after bridging and dilation processes (a) and after smoothing process (b).
3. PERFORMED TESTS Some tests were performed to evaluate the performances and reliability of the proposed methodology. The results hereafter presented regard only the building footprints extraction after the automated image orientation and dense point cloud generation. 3.1
Input data
The tests were performed with an image dataset over the city of Milano (Italy). The test area includes a dense urban neighbourhood with complex buildings and streets of different dimensions (see Figure 8). The aerial block was acquired with the Midas-BlomOblique system composed of 5 cameras (Canon Eos 1D Mark III) with different focal lengths: the nadir camera
Achieved results
The first area has a bigger extension and it is analysed considering 32 reference images with an overlap of about 2030%. A threshold of 2.0 meters for the minimum difference in Z and 20 points for the minimum number of points (see Section 2.3) were used. The extracted building footprints are shown in Figure 9. Only in the central part of the block the processed images considered all the building façades, while incomplete reconstructions are present at the borders of the block. The footprint extraction was considered satisfactory when all the four sides of the building were extracted along with the main elements for every building typology. Missing parts were mainly in the delineation of sub-footprints (i.e. adjacent buildings with different heights). The completeness of the reconstruction was evaluated on the central part of the area (ca 200 buildings) by visual inspection. From this analysis, 74% of the building footprints resulted correctly extracted and the percentage of detected building lines was about 94%. The incomplete buildings were mainly due to occlusions (i.e. trees or adjacent buildings) that avoided a continuos reconstruction of the wall surfaces as shown in Figure 9 (green rectangle) and in Figure 10. As mentioned, no ground truth was available on that area and so it was decided to further evaluate the correctness and the congruency of the extracted
This contribution has been peer-reviewed. The double-blind peer-review was conducted on the basis of the full paper.
64
ISPRS Annals of the Photogrammetry, Remote Sensing and Spatial Information Sciences, Volume II-3/W3, 2013 CMRT13 - City Models, Roads and Traffic 2013, 12 – 13 November 2013, Antalya, Turkey footprints by generating a true orthophoto and overlaying the building footprints (Figure 11). The achieved results showed the correct position of the lines in the inner part of the roof, as walls instead of roof outlines are surveyed. This correct reconstruction was confirmed all over the test area.
Figure 11. Examples of the extracted building footprints (skeletonized outlines) overlaid onto the true orthophoto.
Figure12. Extracted footprints from the second test area. Figure 9. Building outlines extracted in the first test area.
Figure 10. Example of incomplete footprint’s extraction due to the occlusions given by trees. The second test was performed on a smaller area but with a higher overlap between the reference images during the dense matching phase (and as a consequence an higher density of points) in order to evaluate if this parameter influences the completeness of the feature extraction. The achieved results (Figure 12) demonstrate how the extraction was generally better by increasing the image overlap. The percentage of correctly extracted footprints was about 90% whereas complete buildings were recovered with 78% success rate.
4. CONCLUSIONS AND FUTURE DEVELOPMENTS Although multi-camera systems were firstly used almost 100 years ago, they now live a “second life”. The interest for these
systems in the last few years is highlighted by the increasing number of Geomatics’ companies that are producing and commercializing this kind of devices. Multi-camera systems allows to collect a huge number of data that can be used in a variety of applications. In particular, their use in urban areas allows to collect information about façades and perform more novel investigations and feature extraction in comparison with traditional sensors. In this paper, a new methodology to extract building footprints from oblique images was presented. It exploits the geometric properties of the dense and accurate point clouds that are capable of delivering detailed building descriptions. Furthermore, orientation and distribution of extracted points on the façade surfaces are exploited to detect and reconstruct building footprints. The methodology has shown to give reliable results in very dense urban areas, as shown in the performed tests. The building outlines were in general correctly reconstructed. The success rate exceeded 90% on both test areas and this percentage is slightly higher when only main building walls are considered. Smaller parts of the buildings or partially occluded areas are sometimes not completely reconstructed. In most cases this problem is due to the presence of trees or very close structures that completely occlude these parts. The choice of the used reference images in the matching process can influence the quality of this result, with the general rule that the denser the point cloud, the higher the percentage of correctly reconstructed walls. The filtering and removal of trees is usually reliable although the main drawback of the developed method is the time requested in the point cloud generation.
This contribution has been peer-reviewed. The double-blind peer-review was conducted on the basis of the full paper.
65
ISPRS Annals of the Photogrammetry, Remote Sensing and Spatial Information Sciences, Volume II-3/W3, 2013 CMRT13 - City Models, Roads and Traffic 2013, 12 – 13 November 2013, Antalya, Turkey The paper is the first step of an on-going process that will be extended improving the approach to 3D building reconstruction. At this stage the extracted outlines represent loose edges affiliated to a building class. To make this information useful in e.g. change detection or maps production, further generalization and modelling will be necessary. Adoption of nadir images will be also considered to increase the completeness of the extracted footprints and to reduce the problems due to wall occlusions. Several investigations on the extraction of new features such as numbers and surfaces of window façades will be performed in order to extract reliable information in the smart cities domain (i.e. estimation of heat loss, building volumes, etc.). Finally, multi-temporal acquisitions will be investigated in order to evaluate the additional potentials of such data for change detection purposes. REFERENCES Awrangjeb, M., Ravanbakhsh, M., Fraser, C., 2010. Automatic detection of residential buildings using LiDAR data and multispectral imagery. ISPRS Journal of Photogrammetry and Remote Sensing, Vol. 65, pp. 457-467. Besnerais, G. L., Sanfourche, M. and Champagnat, F., 2008. Dense height map estimation from oblique aerial image sequences. Computer Vision and Image Understanding, Vol. 109, pp. 204–225. Brédif, M., Tournaire O., Vallet B., Champion N., 2013. Extracting the polygonal building footprints from digital surface models: A fullyautomatic global optimization framework. ISPRS Journal of Photogrammetry and Remote Sensing, Vol. 77, pp. 57-65. Dini, G.R., Jacobsen, K., Heipke, C., 2013. Delineation of building footprints from high resolution satellite stereo imagery using matching and GIS database. ISPRS Int. Archives of Photogrammetry, Remote Sensing and Spatial Information Sciences, Vol. 40(1W1). Fritsch, D., Kremer, J., Grimm, A., 2012. Towards All-in-one Photogrammetry. GIM International 26(4), pp. 18-23. Fritsch, D., Rothermel, M., 2013. Oblique image data processing – potential, experiences and recommendations. Proc. 54th Photogrammetric Week, D. Fritsch (Ed.), pp. 73-88. Gerke, M., 2009. Dense matching in high resolution oblique airborne images. ISPRS Int. Archives of Photogrammetry, Remote Sensing and Spatial Information Sciences, Vol. 38 (3/W4), pp. 77–82. Gerke, M. and Nyaruhuma, A., 2009. Incorporating scene constraints into the triangulation of airborne oblique images. ISPRS Int. Archives of Photogrammetry, Remote Sensing and Spatial Information Sciences, Vol. 38(1-4-7/W5), Hannover, Germany. Grenzdörfer, G., Guretzki, M., Friedlander, I., 2008. Photogrammetric image acquisition and image analysis of oblique imagery. The Photogrammetric Record, Vol. 23(124), pp. 372–368. Lafarge, F., Descombes, X., Zerubia, J., Pierrot-Deseilligny, 2008. Automatic building extraction from DEMs using an object approach and application to the 3D-city modeling. ISPRS Journal of Photogrammetry and Remote Sensing, Vol. 63, pp. 365-381. Lemmens, M., Lemmen, C., Wubbe, M., 2008. Pictometry: Potentials for land administration. Proc. 6th FIG Reg. Conf., San Jose, Costa Rica. Mishra, P., Ofek, E. and Kimchi, G., 2008. Validation of vector data using oblique images. In: Advances in Geographic Information Systems, 16th ACM SIGSPATIAL Int. Conference, Irvine (CA), USA.
Remote Sensing and Spatial Information Sciences, Vol. 1(3), pp. 257262. Nyaruhuma, J., Gerke, M., Vosselman, G., 2012. Verification of 3D building models using mutual information in airborne oblique images. ISPRS Annals of Photogrammetry, Remote Sensing and Spatial Information Sciences, Vol. I–3. Ok, A.O., Senaras, C., Yuksel, B., 2013. Exploiting shadow evidence and iterative graph-cuts for efficient detection of building in complex environments. ISPRS Int. Archives of Photogrammetry, Remote Sensing and Spatial Information Sciences, Vol. 40(1/W1). Petrie, G., 2008. Systematic aerial oblique photography using multiple digital cameras. 8th Int. Scientific & Technical Conf., Porec, Croatia. Pierrot-Deseilligny, M. and Clery, I., 2011. APERO - Open source bundle adjustment software for automatic calibration and orientation of a set of images. ISPRS Int. Archives of Photogrammetry, Remote Sensing and Spatial Information Sciences, Vol. 38(5/W16), Trento, Italy. Pierrot-Deseilligny, M. and Paparoditis, N., 2006. A multiresolution and optimization-based image matching approach: An application to surface reconstruction from Spot5-HRS stereo imagery. ISPRS Int. Archives of Photogrammetry, Remote Sensing and Spatial Information Sciences, Vol. 36(1/W41). Rottensteiner, F., Trinder, J., Clode, S., Kubik, K., 2007. Building detection by fusion of airborne laser scanner data and multi-spectral images: performance evaluation and sensitivity analysis. ISPRS Journal of Photogrammetry and Remote Sensing, Vol. 62, pp. 135-149. Rumpf, M., Tlera, A., 2002. A continuous skeletonization method based on level sets. In: Joint EUROGRAPHICS – IEEE TCVG Symposium on Visualization. Rupnik, E., Nex, F., Remondino, F., 2013. Automatic orientation of large blocks of oblique images. Int. Archives of Photogrammetry, Remote Sensing and Spatial Information Sciences, Vol. 40(1/W1), pp. 299-304. Sohn, G., Dowman, I., 2007. Data fusion of high-resolution satellite imagery and LiDAR data for automatic building extraction. ISPRS Journal of Photogrammetry and Remote Sensing, Vol. 62, pp.43-63. Wang, Y., 2012. Automatic extraction of building roofs from pictometry’s orthogonal and oblique images. ISPRS Int. Archives of Photogrammetry, Remote Sensing and Spatial Information Sciences,, Vol. 39(B3). Wiedemann, A. and More, J., 2012. Orientation strategies for aerial oblique images. ISPRS Int. Archives of Photogrammetry, Remote Sensing and Spatial Sciences, Vol. 39(B1). Xiao, J., Gerke, M. and Vosselman, G., 2012. Building extraction from oblique airborne imagery based on robust facade detection. ISPRS Journal of Photogrammetry and Remote Sensing, Vol. 68, pp. 56-68. Zebedin, L., Klaus, A., Gruber-Geymayer, B., Karner, K., 2006. Towards 3D map generation from digital aerial images. ISPRS Journal of Photogrammetry and Remote Sensing, Vol. 60, pp. 413-427.
ACKNOWLEDGEMENTS This work was funded by CIEM and 3M Projects (co-founded MarieCurie Actions 7th F.P. - PCOFOUNDGA-2008-226070, acronym ”Trentino Project” and ”Incoming Team 2009”) and FFG Austrian Research Promotion Agency Project No. 832011, the doctoral college Energy Systems 2030 (ENSYS2030) of Vienna University of Technology. The authors would like to thank Blom-CGR S.p.A. (Parma, Italy) for providing the oblique imagery.
Nex, F., Remondino, F., 2012. Automatic roof outline reconstruction from photogrammetric DSM. ISPRS Annals of Photogrammetry,
This contribution has been peer-reviewed. The double-blind peer-review was conducted on the basis of the full paper.
66