0
Broadband Competition Policy in Japan March 2008
Yasu TANIWAKI (
[email protected])
Director, Telecommunications Policy Division Telecommunications Bureau Ministry of Internal Affairs & Communications (MIC), JAPAN
1
Broadband Competition Policy in Japan
✔ ■Current Status of Broadband Market in Japan ■Outline of “New Competition Policy Program 2010” ■Specific Issues □Network Neutrality Issues □Revitalization of Mobile Business
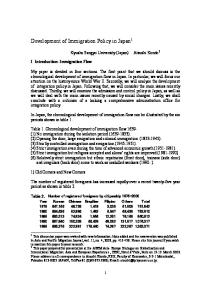
Transition in the Number of Japan’s Broadband Subscribers 【Number of Telecommunication Service Users】 (Unit: 10 thousand)
16,000,000
1 2 ,0 0 0
固 定 電Communications 話 (加 入 電 話 +I SDN) Fixed (telephony)
As of Jan. ' 08.1末 現 在 2008 10548.6
移 動 電 話Communications (携 帯 電 話 +PHS) Mobile (telephony)
高 速 ・超 高 速 イ ン ター ネット加 入 者 数 Broadband service
IP電 話 IP Telephony
1 0 ,0 0 0
9764
8,112
9869
9648
12,000,000
8,665
8 ,0 0 0
FTTH FTTH
5,781
6,263
5,456
6,678
6,285
6,028 6,164
6,223
6,263
6,196
6,077
6,133 5,685
5,907 5,245
As of Dec. 2007
5,961
6,022
5878
5917
5,636
5745
5808
5602.9
5239.8
8,000,000
5678
4,731
4 ,0 0 0
6,000,000
CATV CATV
3,825
As of Dec. 2007 2,830.2
2,691
1,951
2,330
1,541 943
1,170
433
22
830.5
1060.4 976.7
387 85
2,576
2,422
2,148 2,237
2 ,0 0 0
213 49 87 138 171
2,504 1375.9
1209.7 1145.7
1676.6 As of Dec. 2007
2,000,000
12,585 12,585 0 7/ 9 '0
7/ 3 '0
6/ 9 '0
6/ 3 '0
5/ 9 '0
4/ 3
4,000,000
FWA FWA
527.6
'0
2/ 3 '0
0/ 3 '0
8/ 3 '9
6/ 3 '9
4/ 3 '9
2/ 3
3,827,502 3,827,502
1300
0 '9
11,328,952 11,328,952
10,000,000
7,482
0/ 3
14,000,000
9982.6
9,147
'9
DSL DSL 13,133,113 13,133,113
9475 9,361
6 ,0 0 0
【Number of Broadband Service Users】
2
Tariff for Broadband Services
3
(yen/month)
IP phone charge PSTN phone charge
6,510 internet charge
IP phone charge
5,991
6000
5,754
5,985
5,250
5,200
5000
4,693 4,900
4000
4,389
4,095
4,095
4,206
3,505
3,969
3,570 3,465
3000
2,980
2,908
2000
1,344 1000
0
1,050 NTT East(1)
K-opticom
NTT East
(100 M)
(100 M)
(100 M)
(1) (2)
USEN (100 M)
FTTH
FTTH
(single residences)
(multiple residences)
Note 1: When using BB.excite as the ISP Note 2: When the service can be provided to 8 or more residences Note 3: Includes basic IP telephone charges as well
NTT East(1)
(47 M)
Softbank BB (50 M)
(3)
(3)
KDDI (50 M)
KDDI (5 M)
Itscom (30 M)
ADSL Sources: Respective company web sites
Itscom (512k)
Cable
Japanese Broadband Service in Global Comparison
4
Speed of DSL
Broadband prices (100kbit/s)
(Mbit/s)
(US dollar) Japan
0.07
Japan
51.2
Korea
0.08
Korea
51.2
Netherlands
Singpore
0.14
Sweden
0.23
Singapore
0.24 0.3
Italy Taiwan,Chaina
30.72
Sweden
24
Finland
24
Netherlands
0.34
France
0.36
Finland
0.36
United States
Taiwan,Chaina
12.288
Italy
12.288
France
0.49 0.51
Germany
20.48
The U.K.
0.63
Lithuania
0.69
Hong Kong,China
0.83
10.24
Kazakhstan
8.192
The U.K.
8.128
Portugal
8.128
Brazil
8
Portugal
0.93
Iceland
6.144
Bosnia・Herzegovina
0.93
Hong Kong,China
6.144
Poland
6.144 6.016
Canada
1.01
Macao,China
1.07
Germany
Brazil
1.08
Philippines
Belgium
1.21
0
0.2
0.4
0.6
0.8
1
1.2
1.4
5.12
0
10
20
30
40
50
Source : ITU Internet Reports 2006 ”digital.life”(December 2006)
60
Next Generation Broadband Strategy 2010 (August 2006) Status of broadband service availability
broadband service super high speed broadband(FT TH)
FY2005
FY2006
FY2010
(as of the end of March 2006)
(as of the end of March 2007)
(Target set by the government)
47.3 million (94%)
48.6 million (95%)
100%
40.2 million (80%)
42.7 million (84%)
90%
As a roadmap to fulfill “Next Generation Broadband Strategy 2010,” “Digital Divide Elimination Strategy,” including concrete measures to eliminate “broadband zero” area, will be released by MIC in June 2008. (Note) “Broadband availability map,” describing availability of broadband services (ADSL, FTTH etc.) in each town or village, has been provided via the internet.
5
6
Broadband Competition Policy in Japan
■Current Status of Broadband Market in Japan
✔ ■Outline of “New Competition Policy Program 2010” ■Specific Issues □Network Neutrality Issues □Revitalization of Mobile Business
7
From monopoly to competition
Further promotion of competition 1997 ∼
1985 ∼ Introduction Introduction of of market market principles principles Privatization Privatization of of NTT--PC NTT--PC
Reorganization Reorganization of of NTT NTT (1999) (1999) Deregulation Deregulation of of market market entry entry restriction restriction Abolition Abolition of of foreign foreign investment investment regulation (except for regulation (except for NTT NTT and and NTT regional companies) NTT regional companies) Establishment Establishment of of interconnection interconnection rules (introduction rules (introduction of of LRIC LRIC model) model)
Age of Telephony
2001 ∼ Strengthening Strengthening of of asymmetric asymmetric regulations regulations Establishment Establishment of of USF USF mechanism mechanism Setting Setting up up of of Telecommunications Telecommunications Business Business Dispute Dispute Committee Committee
From “ex-ante” regulation to “expost” regulation 2004 ∼ Abolition Abolition of of Type Type II and and Type Type IIII business business categories categories Drastic Drastic deregulation deregulation of of price price and and tariff tariff regulations regulations Introduction Introduction of of competition competition review review mechanism mechanism
Emergence of Internet
Transition to Full IP-based networks
Transition from PSTN to IP-based networks
Review of competition rules through transparent procedures
Review of Competition Rules corresponding to transition to full IP-based networks
Outline of Japanese Telecom Competition Policy
8
Current Status of Japanese Telecom Market Number of competitive telecom carriers April 1985 87
April 1989
April 1993
April 1997
738
1,259
4,726
April 2001
Feb 2008 14,441
9,348
Structure of NTT group (reorganized in July 1999) Regulated under NTT Law
NTT (Holding company) NTT DoCoMo
NTT Communication
NTT regional companies own 93% of all the access lines. (as of the end of March 2007)
NTT East
NTT West
Market Share of NTT East and West (as of the end of March 2007) (share by number of lines )
Copper lines
99.9%
Copper&fiber& CATV lines
92.5%
FTTH
78.9%
(share by revenue) revenue)
Fixed telephone (including ISDN) ADSL
FTTH service
90.6%
38.0%
69.0%
9
Development of DSL Service Market and Introduction of Interconnection Rules
10
(millions) 16
Others Approx. 62.0%
NTT E/W Approx. 38.0%
14 【End-Mar. 07】
12 10 8 6
Autumn Autumn 2000 2000 Establishment of collocation and unbundling rules for access networks 0 7 8 of NTT E/W
DSL DSL
Cable Cable Modem Modem
4 2 0 Mar-99 Sep-99 Mar-00 Sep-00 Mar-01 Sep-01 Mar-02 Sep-02 Mar-03 Sep-03 Mar-04 Sep-04 Mar-05 Sep-05 Mar-06 Sep-06 Mar-07
Changes in Market Environment and Review of Competition Policy Changes in competitive environment (1) Progress of broadband deployment (2) Development of horizontal market integration (3) Development of vertical market integration 【Development of horizontal market integration】
【Development of vertical market integration】
“New Competition Promotion Program 2010” (Sep 2006, revised in Oct 2007) Related to a review of a framework of competition rules to address the transition to IP-based networks, define a road map for deliberation to be implemented by the early 2010s.
11
Outline of “New Competition Promotion Program 2010” Comprehensive Review of Competition Rules to Address the Shift to IP Based Networks (Comprehensively implemented by early 2010s) 1.Promotion of Facility Based Competition
Promotion to Use Physical Networks Owned by Local Governments etc. Promotion of Diversification of Access Networks(WiMAX etc.) Review of Dominant Regulations Introduction of Competition Safeguard System (from FY 2007) Comprehensive review of Dominant Regulations (Implementation will be launched by FY 2010.)
2.Review of Interconnection Policy
Review of Calculation Method for Interconnection Charges of NTT E&W Establishment of Interconnection rules for NGNs
(by the end of FY2007)
3.Review of Universal Service System
Consideration (“feasibility study” in 2007 to be followed by precise consideration at the Information and Communications Council by the end of 2008)
4.Review of Tariff Policy
Review of the Price Cap Regulation etc. Promotion of Competition in the Mobile Communication Market (☞”Mobile Business Vitalization Plan” in September 2007)
5.Other Main Policies
Study concerning the Network Neutrality principles (the first SG report in September 2007, followed by the second report by the end of 2008) Review of Dispute Settlement Functions etc.
✔Status of NTT will be concluded following consideration in 2010. ✔Comprehensive legal framework including telecommunications and broadcasting will be concluded by 2010.
12
13
Broadband Competition Policy in Japan
■Current Status of Broadband Market in Japan ■Outline of “New Competition Policy Program 2010” ■Specific Issues
✔□Network Neutrality Issues □Revitalization of Mobile Business
Basic Framework for Network Neutrality
14
SG on Network Neutrality (Nov. 2006 – Sep. 2007) Change of Market Structure ■Changes on network structure (Transition from PSTNs to IP based networks) ■Progress of market integration such as FMC ■Proliferation of new communications such as P2P
Network neutrality (from the user perspective) (1) IP-based networks should be accessible to users and easy to use, allowing ready access to content and application layers. (2) IP-based networks should be accessible and available to any terminal that meets the relevant technical standards, and should support terminal-to-terminal (or “end-to-end”) communication. (3) Users should be provided with equality of access to telecommunications and platform layers at a reasonable price. Note: In this case, "the user" refers not just to end users but also includes content providers and other related companies that conduct business using IP networks.
Ensuring utilization of networks “with proper cost allocation”(A) & “without any discrimination”(B) Equitable cost distribution of networks (A) Neutrality of cost sharing models for upgrading the communications networks
Equal access to networks (B) Neutrality of telecommunications layer with respect to other layers
Basic Framework for Network Neutrality
15
SG on Network Neutrality (Nov. 2006 – Sep. 2007) Change of Market Structure ■Changes on network structure (Transition from PSTNs to IP based networks) ■Progress of market integration such as FMC ■Proliferation of new communications such as P2P
Network neutrality (from the user perspective) (1) IP-based networks should be accessible to users and easy to use, allowing ready access to content and application layers. (2) IP-based networks should be accessible and available to any terminal that meets the relevant technical standards, and should support terminal-to-terminal (or “end-to-end”) communication. (3) Users should be provided with equality of access to telecommunications and platform layers at a reasonable price. Note: In this case, "the user" refers not just to end users but also includes content providers and other related companies that conduct business using IP networks.
Ensuring utilization of networks “with proper cost allocation”(A) & “without any discrimination”(B) Equitable cost distribution of networks (A) Neutrality of cost sharing models for upgrading the communications networks
Equal access to networks (B) Neutrality of telecommunications layer with respect to other layers
IP Traffic on the Networks (Total Volume) ○○The Thetotal totalamount amountof ofIP IPtraffic trafficininJapan Japanwas wasestimated estimatedat at812.9Gbps 812.9GbpsininNov Nov2007, 2007, increased increasedby byabout about2.5 2.5times timesinin33years. years. [Gbps] 900
812.9Gbps (2007.11)
800
Estimated download traffic of broadband users in Japan
721.7Gbps (2007.5)
700 636.6Gbps (2006.11)
600 523.6Gbps (2006.5)
500
468.0Gbps (2005.11)
339.8Gbps (2007.11)
424.5Gbps (2005.5)
400 323.6Gbps (2004.11) 303.2Gbps (2004.10)
300
294.0Gbps (2007.11)
(ref.1) Monthly average of daily peak traffic exchanged at major IXs in Japan
269.4Gbps (2004.9)
200 199.4Gbps (2007.11)
0
1 2 3 4 5 6 7 8 9 10 11 12 1 2 3 4 5 6 7 8 9 10 11 12 1 2 3 4 5 6 7 8 9 10 11 12 1 2 3 4 5 6 7 8 9 10 11 12 1 2 3 4 5 6 7 8 9 10 11 12 1 2 3 4 5 6 7 8 9 10 11 12 1 2 3 4 5 6 7 8 9 10 11 12 1 2 3 4 5 6 7 8 9 10 11 12 1 2 3 4 5 6 7 8 9 10 11 12 1 2 3 4 5 6 7 8 9 10 11 12 1 2 3 4 5 6 7 8 9 10 11 12
100
1997
1998
1999
2000
2001
2002
2003
2004
2005
2006
Monthly average of daily traffic of Broadband customers (ADSL/CATV/FTTH) of major ISPs in Japan
(ref.2) Monthly average of daily traffic exchanged at major IXs in Japan
2007
Efforts for Grasping Current Status of Internet Traffic in Japan , MIC
16
Traffic Exchanged among ISPs(as of Nov 2007)
17
○ “The traffic flowing into domestic ISPs from foreign ISPs(Inbound traffic, B3)” has been remarkably increasing by twice in 1.5 year. It has exceeded “the traffic exchanged at any place outside domestic major IXs (mainly private peering, B2)” at Nov 2007.【left diagram】 ○ In the traffic exchanged among domestic ISPs, the percentage of “the traffic exchanged at domestic major IXs (B1)” has turned upward again. 〔B1〕 the traffic exchanged at domestic major IXs 〔B2〕 the traffic exchanged at any place outside domestic major IXs 〔B3〕 the traffic flowing into domestic ISPs from foreign ISPs [Gbps] <Outbound traffic from domestic ISPs> ISPs>
<Inbound traffic to domestic ISPs> ISPs>
[Gbps]
160
160
B1
B2
B3
140
B1
133.7
140
129.0
120
93.5
100
B2
B3
124.5 120
107.6 94.9
100 80.9
40 20
53.1 47.9 48.2 38.0 36.3 35.9 40.1 28.5 25.3 27.7
57.1
90.5 68.1
77.4 66.2
68.4
41.6
54.0
62.3
81.8
71.2
48.1
43.3
37.8
57.8 41.6
33.0 30.9 31.8 16.7 14.1 15.4
20
0
70.8 60.1
58.4
60 40
83.4
77.6
80
68.5 55.1
108.4
94.5
73.3
80 60
116.4
113.3
47.8 39.8
24.1
0 04.5
04.11
05.5
05.11
06.5
06.11
07.5
07.11
04.5
04.11
05.5
05.11
06.5
06.11
07.5
07.11
Efforts for Grasping Current Status of Internet Traffic in Japan , MIC
IP Traffic (Downstream) P2P traffic has a significant impact on networks rather than streaming and web surfing. Average P2P occupation rate increased by 30% at peak traffic level and by 10% at off peak level in 6 months period. Occupation rate of bandwidth
Others (web, mail etc.)
Randomly selected day in April 2006
Occupation rate of bandwidth
Randomly selected day in November 2005
Top
Bottom
18
19
IP Traffic (Upstream) P2P occupation rate is higher in upstream than in downstream. P2P traffic occupied no less than approx.50% throughout 24h in Apr.2006. Others (web, mail etc.)
Occupation rate of bandwidth
Occupation rate of bandwidth
Randomly selected day in November 2005
Randomly selected day in April 2006
Top
Bottom
Bandwidth Usage and P2P Users 10% of all users occupy 60 through 90% of the traffic
20
Distribution of uses in all traffic
Traffic volume
75% P2P traffic
25% Other traffic
(more than 90% of all users)
(less than 10% of all users)
P2P users (10%) controls 60 through 90% of the traffic.
63% Heavy users
(10% of P2P users)
37% average users (90% of P2P users)
User (ascending sort )
Top 10% of P2P users(*) occupy more than 60% of the traffic
Bandwidth used by heavy users completely differs from that used by average users.
Traffic volume
average user : 550Mbyte Top 10% among P2P users occupy over 60% of the traffic
x 30
x 190
P2P user : 17Gbyte
P2P heavy users: 104Gbyte P2P User (ascending sort ) (*) “the P2P users” are considered as the users whose P2P traffic exceeds over 1 Mbyte within 24 hrs. (Note) The data was provided by Plala Networks) (partly extracted)
Measured : 2003/6/30 – 2003/7/1 11:59 (*) the Plala Networks has controlled its P2P bandwidth since November 2003, therefore the latest published data in uncontrolled situation is for 2003.
Dispersion of Intelligence in Networks Newly emerging services coordinated between terminal equipment and intelligence in servers (SaaS, online data storage etc.)
networks (meshed End user as a “private” content provider
Remarkable improvement of computing capability of terminal equipment such as PCs
Ubiquitous economy, CGC(Consumer Generated Media), diversity of content delivery mode including P2P
21
Background of Dramatic Traffic Increase ■Broadly usage of P2P-based file exchange, driven by increasing availability for broader upload bandwidth in response to proliferation of FTTH service
■In addition to increase of rich content including video, many new business models with CGC (Consumer Generated Content) have emerged. ⇒Content may flow into the network from a variety of network edges
■Some new factors possibly to making Internet traffic increase. ●Emergence of new communications represented by M2M in line with progress of ubiquitous economy ●Increase of network utilization including SaaS within firms ●Proliferation of grid computing
22
Actions to Be Taken to Cope with Network Congestion Using P2 P ■Currently unclear if technological innovation can absorb incremental cost due to increasing traffic. ■For coping with dramatic traffic increase (network congestion), ensuring dynamic Interaction is required between networks and terminals, allowing networks to flexibly absorb traffic fluctuating. (☞network scalability)。 scalability ■Advantage of P2P in allow for improving content delivery efficiency should be utilized. Flexible choice of content delivery technologies such as C/S model and CDN as well as P2P should be ensured.
Field Trials by “P2P Network Experiment Council” (FY07-08)
23
P2P Network Experiment Council
24
z z “P2P “P2P Network Network Experiment Experiment Council” Council” was was established established in in August August 2007. 2007. z z Result Result of of experiments experiments will will be be summarized summarized by by end-March end-March 2009. 2009. ■ Purposes ・“P2P Network Experiment Council” was established with the aim of promoting new content delivery businesses using broadband network, and diffusing the use of broadband services to regional areas. ・ To achieve the above targets, the council participants exchange their information and views on new network services applying P2P application technologies, support P2P-experiments and P2P-services, and examine the results of experiments. ■ Participants(in alphabetical order) – Bitmedia Inc., BitTorrent K.K., BROTHER INDUSTRIES LTD., DREAMBOAT Co.Ltd., INFOCITY Inc., Internet Initiative Japan Inc., Grid Solutions inc., Japan Broadcasting Corporation, J-Stream Inc., Kadokawa Digix INC., Mandala, NEC Corporation, NHK ENTERPRISES Inc., NTT Communications Corporation, SOFTBANK BB Corp., TOKYO SHOSEKI CO.LTD., TOYAMA INTERNET SHIMINJUKU, TV Bank Corp., VeriSign Japan K.K. -MIC (as an observer)
P2P Network Experiment Council SG on Joint Delivery Architecture
SG on P2P Delivery Model P2P Security Guideline Drafting Group Content delivery service providers Content holders Culture
Education
Movies/ Cartoon Films
Sports
Games
Study Group On Effective Delivery Network
Telecommunication carriers, CDN service providers, P2P service providers ISPs, IXs, Content holders
Local Government A
Local Government B
Local Government C
Local Government D
Outline of “Guideline for Packet Shaping (Draft)”(March 2008) 1.Background of the Guideline Development of broadband Dramatic Traffic Increase A few heavy users are occupying most of the bandwidth
2.Principle of the Guideline 【Coverage of the Guideline】 ①
Traffic restriction of specific applications (e.g. P2P traffic)
② Traffic restriction or canceling the contract of heavy users whose traffic exceeds a certain threshold
【Basic concept】 In principle, ISPs should increase their network capacity when network traffic has increased. Some ISPs practise “Packet Shaping”
Packet shaping is allowed only in an exceptional situation. Packet shaping should be justified only from an objective criteria.
Based on the discussion in the “WG on Network Neutrality”, ISPs held a conference in Sep. 2007. (MIC is participating as an observer.)
3.Points at issue ◆ Relation to “Secrecy of Communications”(Article 6, Telecommunications Business Law) ◆ Relation to “Fairness in use”(Article 6, Telecommunications Business Law)
◆ How to provide users with information about packet shaping
Establishing the Guideline as a basic principle regarding ISPs’ practise of packet shaping
◆ _Further issues to be considered
4.Schedule March 17 Public comment (~April 14) ⇒
April 2008 Establishment of the Guideline
25
Guideline for Packet Shaping (Draft) 1. Background Background on on the the deliberations deliberations 1.
■ Dramatic traffic Increase / a few heavy users are occupying most of the bandwidth. ■ To tackle these problems, some ISPs currently practise “packet shaping.”
2. Purpose Purpose and and positioning positioning 2.
■ To avoid arbitrary use of packet shaping, the guideline is established as a basic principle regarding the practise of packet shaping by ISPs.
3. Coverage Coverage of of the the Guideline Guideline 3.
■ The guideline covers the following two cases. (1) Traffic restriction on specific applications (e.g. P2P traffic) (2) Traffic restriction or canceling the contract of heavy users whose traffic exceeds a certain threshold.
4. Basic Basic principles principles 4.
5. Secrecy Secrecy of 5. of communications communications 6. Fairness in in use use 6. Fairness
26
■ Basic principle means that ISP should increase the network capacity when traffic has increased. Packet Shaping is allowed only in an exceptional situation. ■ Specifically, Packet Shaping must be justified only from an objective criteria, such as when the QoS of general users is degraded by the traffic of P2P applications which occupy bandwidth excessively and continuously.
■ Clarifies specific cases when packet shaping is allowed as ISPs lawful pursuit of business. ■ Clarifies specific rules to be followed regarding “fairness in use”.
7. Disclosure of of information information 7. Disclosure
■ In terms of consumer protection, ISPs are required to provide sufficient information to users regarding their packet shaping policy (terms and conditions of contract, description of tariffs, etc.) ■ ISPs are also required to provide relevant information to CPs and other ISPs.
8. 8. Issues Issues for for further further consideration consideration
■ Coping with increase of video content (YouTube, etc.) ■ Information sharing systems among relevant players such as ISPs, CPs, etc.. ■ Cost sharing model (cost allocation among ISPs, additional charges for heavy users etc.)
3
Major points of Guideline(1/2)
27
(1)Relation to “secrecy of communications” ■ISPs analyze the header or payload information of the packet when they practise packet shaping*. Such information constitutes “secrecy of communications”(Article 4, Telecommunications Business Law). ■The guideline clarifies requirements and specific cases when packet shaping is legally allowed. *Cases when the equipment analyzes the data automatically are included.
Requirements for action to be allowed legally (1)Justification of action ①
(2) Necessity of action, balanced with justification
Cases when ISPs restrict traffic of specific applications
【 When ISPs “restrict” traffic of P2P applications such as “winny”】 <Conditions> ●Justification & necessity for action ・The QoS of general users is degraded by P2P traffic which occupies bandwidth excessively and continuously. ・Packet shaping is for maintaining network stability and securing QoS for other users. ●Validity of means ・The practise of packet shaping is applied only to specific apps whose traffic volume is extremely excessive.
Packet shaping may be justified as a lawful action.
②
(3) Validity of means
Cases when ISPs restrict use of bandwidth for specific users
【 When ISPs “shut out” traffic of P2P applications such as “winny”】 ●Such actions do not satisfy validity of means because ISPs can maintain their operations by other means such as restricting the traffic of P2P apps, which is recognized as a lighter restriction than shutting out the traffic.
Difficult to be justified as a lawful action * In the case where end users agree individually, ISPs can shut out the traffic of P2P applications.
【 When ISPs restrict use by heavy users】 <Conditions> ●Justification & necessity for action ・QoS of general users is degraded by traffic due to specific heavy users occupying the bandwidth excessively and continuously. ・Packet shaping is for maintaining network stability and securing QoS for other users. ●Validity of means ・The practise of packet shaping is applied only to specific users whose traffic amount is extremely excessive.
Packet shaping may be justified as a lawful action. ☞ It is permissible to check the traffic of respective users, for restricting the bandwidth of heavy users or giving them a warning them to decrease their use.
34
Major Points of Guideline(2/2)
28
( 2)Relationship to “fairness in use” ■The Guideline clarifies the rules to be followed when implementing packet shaping in the context of the relationship to “fairness in use” (Article 6, Telecommunications Business Law). 【Cases when ISPs restrict P2P traffic of specific heavy users】 <Conditions> ●ISPs must distinguish heavy users’ traffic from general users’ traffic based on objective data. ●Based on tariffs, the traffic restriction on heavy users should be limited to an equivalent traffic volume of general users.
In general, such an action is recognized as not violating the “fairness in use” principle.
( 3)How to provide information about Packet Shaping ①
【Cases when ISPs restrict traffic or charge additionally for specific heavy user groups】 ●Discriminatory practises are applied to users under the same conditions.
【Cases when ISPs restrict traffic of specific CPs】 ●CPs are also covered by the “fairness in use” principle.
Except when there is a valid reason, in general, such an action may be recognized as violating the “fairness in use” principle.
ISPs should provide sufficient information about their packet shaping policy to their users. (1)Required Information includes (2)Required measures for providing information (1)Required Information includes include include ◆◆ Implementation Implementation of of packet packet shaping shaping contract contract ◆◆ Terms Terms and and concrete concrete measures measures for for packet packet shaping shaping
(2)Required measures for providing information ◆◆ Clear Clear description description in in the the tariff tariff (addition (addition to to model model
article) article) ◆◆ Provision Provision of of relevant relevant information information on on HPs HPs etc. etc.
② The information on packet shaping policy is also useful for other ISPs and CPs, affected by this policy. In this context, it is required to disclose this information to other ISPs or CPs as well as to users. ③ ISPs with contracts (e.g., transiting or roaming) are required to share information about their respective packet shaping policies. Peering ISPs (with no contracts) are required to provide the same information to those ISPs as well as to users. 35
Relationship between Upper-tier ISP and Lower-tier ISPs
29
CP
ISP-A has an opportunity to compensate for the increasing equipment cost by collecting from CPs and ISP-B.
ISP-A Rich content
(video streaming, etc. )
transit
ISP-B
ISP-B has no opportunity to compensate for the increasing equipment cost difficult to collect directly from end users.
End user
30
Coping with the Traffic Increase
30
■Additional charge on heavy users? ✔User charges are a fixed rate on a best-effort basis. ⇒Possibility to disturb equality of cost burden among heavy users and light users. ✔In general, it is acceptable to collect an additional charge from heavy users. ✔On the other hand, issues to be considered exist: ・acceptable to develop multi-tiered Internet structures (fast lane and slow lane)? ・possible to find rational price differentiation between heavy users and light users? →In the meantime, a case-by-case approach should be taken. ■Additional charge for CPs? ✔Both the CP and ISP markets are competitive. →Market principle may work. ■Equality on cost allocation among ISPs? ✔Market mechanism may not work due to several factors such as asymmetry of information (eg. upper-tier ISP vs. lower-tier ISP), and increasing burden for enhancing network capacity. ✔It is appropriate to allow for packet shaping without any bit discrimination.
Basic Framework for Network Neutrality
31
SG on Network Neutrality (Nov. 2006 – Sep. 2007) Change of Market Structure ■Changes on network structure (Transition from PSTNs to IP based networks) ■Progress of market integration such as FMC ■Proliferation of new communications such as P2P
Network neutrality (from the user perspective) (1) IP-based networks should be accessible to users and easy to use, allowing ready access to content and application layers. (2) IP-based networks should be accessible and available to any terminal that meets the relevant technical standards, and should support terminal-to-terminal (or “end-to-end”) communication. (3) Users should be provided with equality of access to telecommunications and platform layers at a reasonable price. Note: In this case, "the user" refers not just to end users but also includes content providers and other related companies that conduct business using IP networks.
Ensuring utilization of networks “with proper cost allocation”(A) & “without any discrimination”(B) Equitable cost distribution of networks (A) Neutrality of cost sharing models for upgrading the communications networks
Equal access to networks (B) Neutrality of telecommunications layer with respect to other layers
32
Change of Market Structure and Network Neutrality
Physical network layer
Collaborative business models
Communication service layer
Business model developed by one single player
Vertical integration
Platform layer
a variety of content and applications
Ubiquitous networks Horizontal integration
Users including M2M
A variety of intelligence aroud networks
Content and application layer
Differences between the Internet and NGNs
33
■Internet a) No scheme to ensure overall QoS on end-end basis. b) Each NW is interconnected on a multilayer basis and the Internet itself is an open and autonomous network. c) Best effort model to find out best solution through collaboration among anonymous players. Interconnection with IP
B
C X
A
D
■Next Generation Networks(NGNs) a) IP-based networks are to be restructured from legacy PSTN networks. b) Networks are controlled by carriers to ensure QoS and security though the functions of SDP (Service Delivery Platform). video
Network Restructuring
Message
Video telephony
IP based networks
PSTNs
5
Freedom to Choose Networks Next Generation Network Application Servers
Application function
Video phone
34
Internet collaboration
Content ・・・・・・・ delivery
Interconnection among ISPs
B
Tier 1
C
Platform/Service function
Session Control
Authentication Security
Core node
Core Networks
Edge node
Optical access
collaboration
D
X
Network function (transmission)
Access Networks
Charging
Wireless LAN
PCs
collaboration
Other accesses
cell phones
QoS may differ according to network
A
Security and authentication system may depend on applications used in terminals
telephones
ubiquitous network
TVs
E
Networked home appliances
Interconnection Rules on Next Generation Networks
35
Application Servers Application function
Video phone Session Control
Platform/Service function
Access Networks
xDSL
Authentication Charging Security
Core node
Core Networks Network function (transmission)
Content ・・・・・・・ delivery
Edge node Optical access
Wireless LAN
Other accesses
Fixed/Mobile phones, networked home appliances , PCs.
Issues to be considered ■Scope of facilities required to be opened
✔In addition to NNI and SNI, additional measures should be taken to ensure openness between different layers, taking care of requests by competitive carriers as well as NTT East and West. ✔Necessary to let unbundling rules flexible, reflecting characteristics of IP based networks.
■Calculation methodology for access charges
✔Methodology to set access charges reflecting characteristics of IP based networks (appropriate profit level should be achieved for NTT East and West). ✔Developing charge settlement system between NGN and ISPs
■Setting appropriate terms required for interconnection (equivalency between NTT East & West and competitive carriers) ■Other issues including measures to ensure openness for video delivery platform, smooth coalition between fixed networks and mobile networks
Interconnection rules for NGN developed by NTT East/West are currently currently under discussion at Telecommunications Council. (The report is expected to be finalized by the end of March 2008.) 2008.)
Outline of Dominant Regulations Applied as one
Service regulations
Restrictions
Applied as necessary in case of exceeding 25% of the above weight returns
Tariff and price (cap) regulation ■Restriction of information usage only for specified business ■Equal treatment of other companies ■Equal treatment of manufacturers, etc. ■Firewall with specified carriers
Authorization of interconnection tariffs
Interconnection rules
36
■Restriction of information usage only for specified business ■ Equal treatment of other companies ■ Equal treatment of manufacturers, etc.
Notification of interconnection tariffs
Rules for interconnection tariffs (e.g. LRIC) Development of interconnection accounts Telecommunications facilities (fixed) designated as essential facilities
Facilities without any essentiality although the number of providers is limited due to availability of frequency
Facilities Access lines and related telecommunications facilities
Criteria
Telecommunications facilities serving a relatively larger proportion of subscribers
Access lines with more than 50% share (designated on a prefectural basis) NTT East and West
Type I designated facilities (fixed)
Base station lines and related mobile telecommunications facilities Access lines with more than 25% of share (designated on a business area basis) NTT DoCoMo etc.
Type II designated facilities(mobile)
37
Basic Directions for Reviewing Dominant Regulations Service regulations
+
Share of access lines
bottleneck
Identify the market having possibility to abuse market dominance* (vertically and
Essential facility
horizontally)
Interconnection related regulations to open up bottleneck facilities
Conduct restrictions
Market dominance
Identify submarkets (converged markets) * (Focus to be shed mainly on the horizontal equivalent competition)
Other market dominance
Caused by Market share * oligopolistic + α market environment
Identify the market having possibility to abuse market control power* (vertically and horizontally) Add these concepts
○ ○
Leverage of market dominance on relevant markets Possibilities of collective dominance in collaboration with allied companies
*mark indicates the possibility to take advantage of competition review mechanism.
Notification of tariff for interconnection
Conduct restrictions
Outline of Network Neutrality Issues Equitable cost allocation of networks Revealing network congestion(traffic volume doubled in 2 years)
Necessity for developing cost sharing model on building up additional network capacity
■Additional charge for heavy users(☞no specific factor to disturb healthy competition. More detail discussion on reasonable differentials between heavy users and light users etc.) are to be required. ■Additional payment by CPs to ISPs --- not required under the healthy competitive environment in CP and ISP market (dependent on market mechanism) ■cost cost allocation between upper tier ISPs and lower tier ISP (possibility (possibility for market mechanism not working effectively) effectively)
Necessary to develop scalable networks to absorb fluctuations of traffic
Basic principles on packet sharing to be specified to avoid disturbing competition, ensuring confidentiality of communications, proper measures to provide Information on packet shaping to subscribers etc.
Easing traffic congestion by taking advantage of P2P technology
certain level of criteria on packet shaping to be developed
Field trials on traffic dispersion using P2P technology
Development of “Guideline for packet shaping” shaping”
38
Equal access to networks
Development of NGNs
Progress of Market Integration
Necessity of preventing abuse of market dominance (ensuring horizontal and vertical fair competition
Establishment of interconnection rules on NGNs developed by NTT East and West
Issues to be considered include: ✔scope of facilities required to be opened ✔calculation method of access charges ✔terms for interconnection by competitive carriers ✔other issues including measures to ensure openness for video delivery platform, smooth coalition between fixed networks and mobile networks
Consideration of interconnection rules on NGN
Review of dominant regulation regulation in correspondence correspondence to market integration Issues to be considered include: ✔ Review of threshold definition on market dominance ✔ Prevention on abuse of market dominance among plural markets (Collective dominance, leverage of market dominance with other closely related markets) ✔ Establishment of mechanism to prohibit market dominance jointly abused by dominant carriers and related entities ✔ Utilization of competition review system
Consideration of reform of dominant regulations
Study Group on Internet Policy ☞
1st phase Study Group on Network Neutrality
(Nov 2006~September 2007)
New Competition Promotion Program 2010 (revised in October 2007)
New Competition Promotion Program 2010
2nd phase Study Group on Internet Policy
(February ~December 2008)
(Revised on 23 October 2007) 2007)
➢ Development of Environments Intended to Ensure Network Neutrality In the transition to IP-based networks, a study shall be undertaken concerning the framework for network neutrality, such as fair usage of networks (neutrality of the communications layer to the other layers) and fairness in cost sharing for the networks (neutrality of the cost sharing model for increasing network capacity). For this reason, MIC shall, based on the "Study Group on Network Neutrality" report (released in September 2007), continue to consider the following regarding several issues over network neutrality. (b) Consideration of How Network Neutrality and Competition Models should Be While network structures and market environments are changing drastically in front of us, MIC shall establish a new venue for consideration in FY2007 to extract and summarize a wide range of medium-term policy issues related to how network neutrality and the competition model should be, such as the appearance of business models with earnings models that differ from the existing ones, effects on the competition environment from increasing borderlessness driven by the Internet and the nature of the Internet governance related to it, how market environments should be developed as IPv4 is transitioning to IPv6, and the direction of business expansion in local regions by entities such as ISPs and CATV operators, and draw a definite conclusion, with 2008 as the approximate due date.
39
Issues to be Considered at Study Group on Internet Policy SG on Network Neutrality (Phase 1)
Equitable cost allocation of networks
P2P network experiment (~FY08)
SG on Internet Policy (Phase 2)
Follow-up
(further study)
Development for smooth content delivery systems Other possible solutions for network congestion
Business environment for ISPs Review on impact on market structure In the transition to IPv6
Network neutrality
Interconnection rules for NGN developed by NTT regional companies (to be concluded by the end of March 2008)
Equal access to networks
Review of dominant regulations (to be concluded by the end of 2008)
Other relevant matters
Promotion of diversity of access networks
Review of legal framework In correspondence to emerging new business models
SG on Platform Functions (Feb. – Nov. 2008)
Internet governance issues
Enhancement of CATV Development of models for sharing responsibility Consideration on new business models New competition rules in response to borderless internet
Development of overall internet strategy
Development of guideline for packet shaping (Spring 2008)
40
41
Broadband Competition Policy in Japan
■Current Status of Broadband Market in Japan ■Outline of “New Competition Policy Program 2010” ■Specific Issues □Network Neutrality Issues
✔□Revitalization of Mobile Business
42
Number of Mobile Service Subscribers (Unit : 10( thousand subscribers) 10,000 people subsc r ibed)
(r at e of inc r ease(%))
12,000
10,000
180 number of subscribers rate of increase from previous year
10,170 160
8,665
9,147
9,648 140
8,112
8,000
120
7,482 6,678
100
5,685
6,000
80
4,731 3,825
4,000
60
2,691 2,000
0 End of the year Number of subscribers Rate of increase from previous year
40
1,171 49
87
138
171
213
1989
1990
1991
1992
1993
1989
1990
1991
1992
20
433 1994
1993
1995
1994
1996
1997
1998
1999
2000
2001
2002
2003
2004
2005
0
2006
1995
1996
1997
1998
1999
2000
2001
2002
2003
2004
2005
2006
49
87
138
171
213
433
1,171
2,691
3,825
4,731
5,685
6,678
7,482
8,112
8,665
9,147
9,648
10,170
101.6
77.3
58.8
24.3
24.5
103.2
170.4
129.7
42.2
23.7
20.2
17.5
12.0
8.4
6.8
5.6
5.5
5.4
43
Change of APRU for Mobile Business Change of t he rat io by service in t he whole APRU
( Yen/ person) 15,000 12,000 9,000 6,000 3,000
8,235
7,853
7,570
7,004
6,769
6,662
1,346
1,607
1,805
1,740
1,867
1,992
6,889
6,245
5,766
5,263
4,902
4,670
2001
2002
2003
2004
2005
2006
dat a ARPU voice ARPU
0
(US$ per year)
ARPU(2003)
The ratio of the data APRU in the whole ARPUに占 めるデ ータARPUの比 率 APRU
(%) 30
1,000
25
800
Year
24 20
20 600
18
17 14
15
13
13
400
10 200
6
米国
オーストラリア
イタリア
韓国
ドイツ
フランス
(*)ARPU(Average Rate Per User)
0
英国
U. K.
It a ly
Ge rm an y
Fr an ce
Ko re a
Au st ra lia
U. S.
Ja pa n
0
日本
5
(MIC)
Market share by main mobile phone operators
44 HHI(*
share 100%
5.6% 5.3% 5.2% 5.0%
5.0% 4.9% 4.8% 4.6% 4.5% 4.3% 4.2% 4.1% 4.0% 3.8% 3.7% 3.5% 3.6% 3.7% 3.9% 4.1% 4.2% 4.3% 4.4% 4.5%
6000
90% 15.2% 15.6%15.9% 16.3%16.5% 16.7%16.8% 17.2%17.4% 17.3% 17.3% 17.2%17.1% 17.0%16.9%16.4%16.2% 16.0% 16.0%15.8% 15.6%15.5% 15.5% 15.6% 80% 5000 70%
22.4%22.2%21.7%21.5% 21.6% 21.7%21.8% 21.9% 22.2%22.5%23.0% 23.7%24.0%24.4%24.8% 25.3%25.6%25.9% 26.1%26.4%26.6% 26.8%
27.3%27.7%
60%
50%
3989 4000 4023 4024 4001 3993 3983 3966 3941 3943
3924 3903 3897 3902 3901 3926 3915 3896 3875 3855 3843
3827 3796 3756
4000
40%
30%
56.8% 56.9% 57.2% 57.2% 56.9% 56.7% 56.6% 56.3% 55.9% 55.8% 55.5% 55.0% 54.9% 54.8% 54.7% 54.8% 54.6% 54.4% 54.1% 53.8% 53.6% 53.4% 52.8% 52.2%
3000
20%
10%
0%
2000 01.6
01.9 01.12 02.3
02.6 02.9 02.12 03.3
Docomo group
ドコモグループ
03.6 03.9 03.12 04.3 04.6
au group (including Tu-ka)
auグループ(ツーカーを含む)
04.9 04.12 05.3
Softbank mobile
ソフトハ ゙ンクモ ハ ゙イル ( 旧VF) (previous Vodafone)
05.6
05.9 05.12 06.3 Others
その他( PHS/ドコモ を除く) (exclude PHS/Docomo)
06.6
06.9 06.12 07.3 (right)
HHI (右軸)
(*)HHI(Herfindahl-Hirschman Index) one of the indicator to measure the degree of monopolizing market. Squares the number of each operator’s market share and adds up. its range is from 0 to 10,000, and means higher degree of monopoly when it close to 10,000.
(from MIC)
Changes required in Mobile Business Business Model 1.0
Content application layer Content application layer
45
Business Model 2.0
Content & Applications
Content & Application
Platform layer Platform layer
Mobile Service Vertically integrated Business models
Progress broadband development and IP transition
FMC
Fixed Service
Open Mobile Business Environment
Network layer Network layer
Terminal layer Terminal layer
Mobile terminal
Users
variety of ubiquities terminals (including home appliances)
A various ways to utilize telecommunications services including M2M (machine to machine)
Ubiquities Network
Telecommunications Telecommunications service layer service layer
Mobile Service
Review of Sales Model for Mobile Business (1) Role of sales incentives
Matters to be considered
✔Activating the potential demand for high end terminals by providing users with “low price.” ✔Facilitating diversification of services through bundling terminals and services.
1. Lack of users’ users’ recognition that cost for terminals is implicitly financed by service price. 2. Rational and equal cost bearing has not been ensured among users. users. 3. increase of cost owed by carriers due to increasing sales incentives incentives consisting of one forth of APRU 4. Lack of diversity resulted by unifies sales method 5. Concerns for fair competition caused by that access charge or wholesale price is calculated based on rate base where sales incentives are included. 6. Limitation for diversity of terminal development with only carriers carriers can decide details of terminals. 7. Concerns for letting the terminal market shrink
Necessity for revising the current sales model
(discuss policy to clearly show users the terminal cost and the connection cost)
Current sales model
terminal price
Lack of transparency caused by bundling terminal price and service price
Existence of unfairness among users
sales Incentive
users cover
service fee
Cost equivalent to sales incentives can be recovered from service revenues within a certain period of time.
(rational) service fee
46
Review of Sales Model for Mobile Business (2) Current Model
New Model
Terminal price
Terminal price
(initial cost)
Sales Incentives
User
Excluded from rate base for access charge and/or wholesale price in the telecom business accounting rule
User
Terminal Fee [Monthly] (equivalent to the sales incentives for terminals)
47
■
Promotion of MVNO entry through reductions in access charge and wholesale price
■
Clarification of earnings and expenses related to terminal sales (implicit pressure to decrease sales incentives)
Compensated for sales incentives
Service fee [Monthly]
Partial introduction in 2008 Consideration of fullfull-scale introduction by 2010, at the latest
Service fee [Monthly] Separation Plan (separation of terminal fees from service fees)
Period Contract
Status of SIM unlock ■The real significance of SIM locks will disappear through the introduction of service period contracts. ■However, differences in 3G systems do exist (W-CDMA [Docomo / Softbank] and cmda2000 [au]); thus, SIM unlocks at this time could distort competition. ■In In principle, SIM unlock is desirable. Looking at the direction of future development for BWA and the terminal market, by 2010, this issue of SIM unlock will be concluded at the timing of 2010.
■ Correction of inequality on burden of terminal costs
■ Promotion of terminal diversification through SIM unlock
Promotion of New Entries of MVNOs ■ MVNOs (Mobile Virtual Network Operators) provide telecommunications service service without setting up their own wireless facilities. ■ MNO goes beyond simple telecommunications service provision to implement implement vertically integrated business including content/application content/application layer, represented by music and game distribution, and alliance with financial services. ■ It is expected players in other areas come as MVNOs into the mobile communications market and build up new business models. ■ A “winwin-win” win” relationship can be built between MNO and MVNO.
Service Diversification
Service provision
Users (Enjoy a diversity of services)
New Market Creation MVNO (Entry from a variety of business categories)
Added Value (Services and terminals)
MVNO
Wholesale service and/or interconnections
MNO (incumbent mobile telecom carriers)
Linkage of existing services with mobile services Creation of New Markets Economic Revitalization
games, e-money and more MNO (incumbent mobile telecom carriers)
Revitalization rsification Revitalizationof ofthe themobile mobilebusiness businessand andachieving achievingservice servicedive diversification through throughpromotion promotionof ofnew newentries entriesas asMVNO MVNOinto intothe themobile mobilemarket market
48
Outline of “Mobile Business Vitalization Plan” (September 2007) Content Application Layer Platform Layer
Mobile Business Vitalization Plan ■Study on business interoperability at platform layer (ID portability portability etc.) (Study to be launched by the end of FY 2007)
Communication Service Layer
Physical Network Layer
■Provision of information on applicability of related legal frameworks frameworks for MNOs and MVNOs (starting within FY2007) ■Considerations for MVNO acceptance when allocating frequencies for new systems
■Clarification of accounting related to sales incentives (revision (revision of ordinances on Telecommunications Business Accounting by the end of FY2007) ■Partial introduction of new fee plan (separation plan for service service fees and terminal price) in 2008 (final conclusion to be considered by 2010 at the latest) ■Reexamination of important explanatory items for consumers relating relating to terminal price and service fees (reexamination “Consumer Protection Guidelines” Guidelines” by the end of FY2007)
Terminal Layer
■Consideration of SIM unlocking (final decision to require for SIM SIM unlock to be made by 2010)
Discussion of comprehensive legal system for communications and broadcasting (ongoing discussion)
■Consideration of standard tariff for wholesale service provided by MNOs to MVNOs
Creation of special ubiquitous zones (discussion aimed at implementation)
■Revision of MVNO Business guidelines* (implemented by the end of 2007)
Diversification of mobile access network (ongoing discussion)
■Promotion of terminal platform standardization (creation of terminal terminal testbed, testbed, etc.)
Consumer Interface
■Discussion of measures for strengthening consumer protections
Maximize benefit for Japanese users and help give Japan’s ICT industry a comparative advantage
49
50
Any Question?