Am. J. Hum. Genet. 57:40-48, 1995
Molecular Characterization of Two Proximal Deletion Breakpoint Regions in Both Prader-Willi and Angelman Syndrome Patients S. L. Christian,' W. P. Robinson,2 B. Huang,' A. Mutirangura,3 M. R. Line,4 M. Nakao,5 U. Surti,6 A. Chakravarti,7 and D. H. Ledbetter' 'Diagnostic Development Branch, National Center for Human Genome Research, National Institutes of Health, Bethesda, MD; 2Institut fur Medizinische Genetik der Universitat Zurich, and Department of Medical Genetics, University of British Columbia, Vancouver; 3Department of Anatomy, Faculty of Medicine, Chulalongkorn University, Bangkok; 4University of Wisconsin, Stevens Point; 5Howard Hughes Medical Institute and Department of Molecular and Human Genetics, Baylor College of Medicine, Houston; 6Department of Pathology and Genetics, University of Pittsburgh, Pittsburgh; and 7Department of Genetics, Case Western Reserve University, Cleveland
Summary Prader-Willi syndrome (PWS) and Angelman syndrome (AS) are distinct mental retardation syndromes caused by paternal and maternal deficiencies, respectively, in chromosome 15q11-q13. Approximately 70% of these patients have a large deletion of -4 Mb extending from D15S9 (ML34) through D15S12 (IR10). To further characterize the deletion breakpoints proximal to D15S9, three new polymorphic microsatellite markers were developed that showed observed heterozygosities of 60%-87%. D15S541 and D15S542 were isolated from YAC A124A3 containing the D15S18 (IR39) locus. D15S543 was isolated from a cosmid cloned from the proximal right end of YAC 254B5 containing the D15S9 (ML34) locus. Gene-centromere mapping of these markers, using a panel of ovarian teratomas of known meiotic origin, extended the genetic map of chromosome 15 by 2-3 cM toward the centromere. Analysis of the more proximal S541/S542 markers on 53 PraderWilli and 33 Angelman deletion patients indicated two classes of patients: 44% (35/80) of the informative patients were deleted for these markers (class I), while 56% (45/ 80) were not deleted (class II), with no difference between PWS and AS. In contrast, D15S543 was deleted in all informative patients (13/48) or showed the presence of a single allele (in 35/48 patients), suggesting that this marker is deleted in the majority of PWS and AS cases. These results confirm the presence of two common proximal deletion breakpoint regions in both Prader-Willi and Angelman syndromes and are consistent with the same deletion mechanism being responsible for paternal and maternal deletions. One breakpoint region lies between D15S541/S542 and D15S543, with an additional breakpoint region being proximal to D15S541/S542. Received March 6, 1995; accepted for publication April 18, 1995. Address for correspondence and reprints: Dr. David H. Ledbetter, National Center for Human Genome Research, National Institutes of Health, Building 9, Room 1N105, 9 Memorial Drive, MSC 0940, Bethesda, MD 20892-0940. E-mail:
[email protected] © 1995 by The American Society of Human Genetics. All rights reserved. 0002-9297/95/5701-0005$02.00
40
Introduction
Prader-Willi syndrome (PWS) and Angelman syndrome (AS) are distinct mental retardation disorders, both involving cytogenetic abnormalities of chromosome 15q1l-q13, with different parent-of-origin effects. The frequency of these disorders is ~-1/10,000-1/25,000 for PWS (Holm 1981; Butler 1990) and 1/20,000 for AS (Clayton-Smith and Pembrey 1992). Approximately 70% of PWS cases are caused by a paternal deletion of 15q11-ql3, with 20%-25% displaying maternal uniparental disomy (Nicholls et al. 1989; Butler 1990; Robinson et al. 1991). In AS a similar percentage are due to a maternal deletion (Beuten et al. 1993; Saitoh et al. 1994), 21,000 newborns detected marker chromosomes in 0.024%-0.06%, making the frequency of inv dup(15) 1/3,500-1/9,000 (Webb 1994). In addition to the common recurrence of
Christian et al.: Deletion Breakpoints in PWS/AS
deletions and inv dup(15), other, less common abnormalities of this region have been observed, including duplications and triplications (Pettigrew et al. 1987; Clayton-Smith et al. 1993; Schinzel et al. 1994). Although this region is involved in cytogenetic aberrations with a high frequency, there are little data addressing the mechanism of these rearrangements. One study of 19 AS patients that used RFLP analysis identified two deletion classes (Knoll et al. 1990): class I was deleted for D15S18 and D15S9-D15S13, while class II was deleted for only D15S9-D15S13 (Knoll et al. 1990). The development of a YAC contig extending through -3.5 Mb of this region has facilitated the ordering of markers used in the RFLP analysis and definition of the common deletion breakpoints (Kuwano et al. 1992; Mutirangura et al. 1993b). FISH analysis using YACs from this region originally suggested that the proximal deletion breakpoint fell within a 370-kb YAC containing the D15S9 locus in seven PWS patients and three AS patients consistent with class II of the previous study, but no patients of class I were identified (Kuwano et al. 1992). On the distal side, breakpoints in eight of nine patients appeared to fall within a 200-kb YAC containing the IR10-1 (D15S12) locus (Kuwano et al. 1992). The purposes of the present study were (1) to develop new polymorphic microsatellite markers in proximal l5q near D15S9 (ML34) and D15S18 (IR39), (2) to map their genetic distance from the centromere by using ovarian teratomas of known meiotic origin to extend the genetic map of chromosome 15 and to examine the relationship of physical and genetic map distances in this region, and (3) to characterize at a molecular level the proximal deletion breakpoint regions in PWS and AS patients by expanding the number of patients analyzed with more informative proximal markers. Patients and Methods Patients
Studies were performed on 53 PWS and 33 AS deletion patients, some of which have been published previously (Kuwano et al. 1992; Robinson et al. 1993b; Zackowski et al. 1993). Each patient was known to be deleted for the interval from DiSS11 to GABRB3, by FISH and/or other molecular techniques. Peripheral blood samples were obtained with appropriate informed consent from the patient and both parents, for either DNA isolation by routine methods or whole-cell lysis using the QIAamp blood kit (Qiagen). Isolation of CA-Repeat Polymorphisms We previously reported the development of a YAC contig spanning 3.5 Mb on chromosome 15q11-q13 (Mutirangura et al. 1993b). To develop dinucleotiderepeat microsatellites proximal to DiSS11, we used
41
both yA124A3 isolated with a sequence-tagged site (STS) from D15S18 (IR39) and y254B5 isolated with an STS from D15S9 (ML34) (fig. 1). Two dinucleotiderepeat polymorphisms, D15S541 and D15S542, were identified within a single 1-kb fragment isolated from yA124A3 by using Alu-CA PCR as described elsewhere (Mutirangura et al. 1993a). D15S543 was developed from a cosmid library of y254B5 as described elsewhere (Nakao et al. 1994). Dot blot hybridization to 29 cosmids was performed by using the YAC right-end probe, which was predicted, on the basis of the previous FISH data, to be immediately proximal to the class II patient breakpoint. Cosmid 512 (c512) was positive for the YAC right end and was further characterized. A CA repeat within c512 was identified by dot blot hybridization and was isolated by using a modified vectorette-CA PCR method. In brief, 50 ng of cosmid DNA was cut with AluI, HaeIII, or HincII to give blunt ends. Reannealed vectorette oligonucleotides 5 '-ACTGCAGAGACGCTGTCTGTCGAAGGTAAGGAACGGACGAGAGAAGGGAGAG-3' (primer 1) and 5 '-CTCTCCCTTCTCGAATCGTAACCGTTCGATCGAGAATCGCTGTCTCTGCAGT-3' (primer 2) were ligated onto the blunt-ended DNA fragments overnight. PCR was performed as described elsewhere, by using a EcoRI-vectorette primer 5'-CGGAATTCCG AATGCTAACCGTCGATCGAGAATCGC-3' with either a Bam-CA primer (5'-CCCGGATCCTGTGTGTGTGTGTGTGTG-3') or a Bam-GT primer (5'CCCGGATCCACACACACACACACACA-3 ') (Feener et al. 1991; Mutirangura et al. 1993a). The products were double digested with EcoRI and BamHI, were isolated, and were cloned into pBluescript SK(-) (Stratagene). After sequencing of the cloning sites, unique primers were designed for each product. Microsatellite PCR Analysis One oligonucleotide of each primer set was end-labeled for 90 minutes at 37°C in a 10-,l reaction containing 10 ,uM primer, 0.025 mCi y(32P] ATP (Amersham) at 3,000 Ci/mmol, 10 mM MgCl2,5 mM DTT, 50 mM Tris-HCl pH 7.6, and 5 units of T4 polynucleotide kinase. The resulting labeled mix was either used immediately or stored at -20°C without further purification. The PCR reactions were performed in a reaction mixture containing 40 ng of genomic DNA or whole-cell lysate, 200,M of each dNTP, 10 mM Tris-HCl pH 8.4, 50 mM KCl, 1.2 mM MgCl2, and 0.5 units of Thermus aquaticus DNA polymerase (Perkin Elmer Cetus) in a total volume of 10 p1. Typically, 1 p1 of labeled probe plus 1 p1 of 10 ,uM unlabeled complementary primer was added per 100 ,l of PCR reaction mix. The PCR reactions were performed in a Perkin-Elmer 9600 thermocycler as follows: initial denaturation at 95°C for 4 min, followed by 30 cycles of denaturation at 940C for 30 s, annealing at 55°C for 30 s, extension
Am. J. Hum. Genet. 57:40-48, 1995
42 A. Physical Map
AS
PwS E
1
1 Mb
5345784 rH111
495D1 /
(
A124A3
264A1 25485
71B11 A156E1
326F6 307A12
378A12
230H12 132D4
B58C7
B230E3
A229A2
cen
1IR39 2 (S18)
} \
ML34
(S9)
4-3R
(S1i)
189-1 PW71 (S13) (S63)
49G3
33581
520A9
142A2
TD3-21
LS6-1
(Si0)
(S113)
2
tel+05
GABRB3
597
O GABRA5
93C9 1449A9
IRI (512)
894H7
CMWI (S24)
S5t 3
S541 S542 B. Genetic Map
cente 23te 12cM27 0 0 1 cM
fg-"s~~ ~C
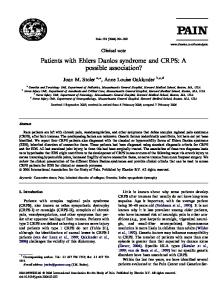
A, Physical map: summary of chromosome l5ql1-q13 including a 4-Mb YAC contig (Kuwano et al. 1992; Mutirangura et Figure I al. 1993b). The jagged lines represent the regions of breakage in the common deletion found in PWS/AS. The PWS and AS critical regions are indicated by double-pointed arrows (Buxton et al. 1994; Sutcliffe et al. 1994). The two classes of proximal deletions are indicated by the "I" and "II" within the squares. The new microsatellites D1SS541, D15S542, and D15S543 are listed below the line. B, Genetic map. The genetic distance (in cM) was determined by using ovarian teratomas of known meiotic origin (table 2). Lines have been used to connect loci on the physical and genetic maps.
at 72°C for 30 s, and a final extension at 720C for 5 min. The PCR product mixture was diluted 2:3 with formamide loading buffer (Sambrook et al. 1989), denatured at 95°C for 2 min, and was placed on ice. One to three microliters of the product was separated on a 35cm X 45-cm 6% acrylamide (19:1 bis)/5.6 M urea/32% formamide gel (Litt et al. 1993). The gels were prewarmed to 500C prior to being loaded and were allowed to run for -2-3 h. The wet gels were transferred to Whatman filter paper or old film, were covered with plastic wrap, and were exposed to Kodak XAR-5 film for 6-18 h at -70°C with two intensifying screens. Gene-Centromere Mapping A total of 105 ovarian teratomas that (a) arose by either whole-genome meiosis I nondisjunction (type I) or by meiosis II nondisjunction (type II) or endoreduplication (type III) or (b) were of mitotic origin (type IV), as well as their corresponding host tissues, were available for analysis. Cytogenetic analysis of host-teratoma pairs at nine chromosomal heteromorphisms and genetic markers at >50 loci were used to identify the mechanism of origin (Deka et al. 1990; Surti et al. 1990). Type III and IV teratomas are uninformative for linkage mapping. Thus, 65 types I and II ovarian teratomas and their hosts were genotyped for S541 and S543. Samples uninformative for S541 were then typed for S542, to achieve the maximum number of informative samples.
Of these samples, 24 type I teratomas and 41 type II teratomas were informative and thus were utilized for map analysis. The determination of the interlocus distances and associated lod scores was performed as described elsewhere (Chakravarti et al. 1989; Deka et al. 1990; Mutirangura et al. 1993a). Results
Development of New Dinucleotide-Repeat Polymorphisms Three dinucleotide repeats-D15S541, D15S542, and D15S543-were developed from the two most proximal YACs in the contig (fig. 1). Alu-CA PCR identified a single -1-kb fragment from yA124A3 with two internal CA repeats: D15S541 contained (CA)18 repeats, and D15S542 contained (CA)14TA(CA)9 repeats. Analysis of 100 chromosomes demonstrated observed heterozygosity values of 72% for S541 and 87% for S542 (table 1). Our previous FISH data had suggested a common breakpoint within y254B5 (Kuwano et al. 1992). Therefore, we identified a cosmid from the proximal (right) end of y254B5, to develop a new polymorphic microsatellite marker, D15S543. This locus is unusual in that a single set of primers amplified two different polymorphic systems on different chromosomes. A second reverse primer was created 22 bp downstream, in an attempt to eliminate the non-chromosome 15 polymor-
43
Christian et al.: Deletion Breakpoints in PWS/AS
Table I New Chromosome IS Microsatellites
Locus
D15S541
Primer Sequences
.........
F: GCATI'IT1I1IGGTTACCTGTATG R: GTCTTCCAGGTFITATGGTTGTCJ
l
Size (bp)
Heterozygosity
-150
72%
D15S542
.........
F: AGCAGACTCCGGAACCTCATC1 {R: CCTGCCTTCTFITGCTGGGGCTGJ
-140
87%
D15S543
.........
F: GCTGTGTTCACI'TTCCAGAG R 1: GCTGTGATCTGT1TITCAACAGAG R 2: GGCGCCATGAGTGFITII GTCG
-140
61%
phism, but both loci were still amplified (table 1). Analysis of a monochromosomal hybrid mapping panel (Ledbetter et al. 1990) demonstrated that the "upper" polymorphism mapped to chromosome 16 and that the "lower" polymorphism mapped to chromosome 15 (data not shown). Previous reports have identified duplicated regions between chromosomes 15 and 16 (Buiting et al. 1992; Nagaoka et al. 1994; Tomlinson et al. 1994). The chromosome 15 polymorphism has been given a designation of "D15S543," with an observed heterozygosity of 61%. Gene-Centromere Mapping with Ovarian Teratomas A variety of genetic studies require the determination of the meiotic origin of nondisjunction, for which polymorphic genetic markers that map close to the centromere are necessary. Although conventional genetic mapping in reference pedigrees can be used for such centromeric mapping, the lack of known and easily assayable centromeric polymorphisms, such as that for chromosome 15, hamper this approach. Instead, gene-centromere mapping in nondisjunction products, such as in benign ovarian teratomas, for which every centromere is informative, is easily implemented (Chakravarti et al. 1989). Only those ovarian teratomas that arise by whole-genome meiosis I (type I) or II (type II) nondisjunction are useful for mapping purposes; ovarian teratomas that arise by whole-genome endoreduplication or by mitotic proliferation cannot be used for gene-centromere mapping (Chakravarti et al. 1989). Human ovarian teratomas are parthenogenetic, usually have a normal 46, XX karyotype, and, in >70% of cases, arise by whole-genome nondisjunction at meiosis I or II (Surti et al. 1990). Type I teratomas have heterozygous centromeres; genetic markers close to the centromere are also heterozygous unless crossing-over occurs, in which case markers distal to the chiasma are reduced to homozygosity 50% of the time. Type II teratomas have homozygous centromeres, as do genetic markers close to it; crossing-over maintains markers as heterozygous distal to the chiasma. Quantitative methods have been devel-
oped that allow the use of information on heterozygosity at marker loci to map them relative to the centromere and with respect to each other (Chakravarti et al. 1989; Deka et al. 1990; Mutirangura et al. 1993a). PCR analysis on the marker loci D15S541, D15S542, and D15S543 was performed to genotype 24 informative type I and 41 informative type II benign ovarian teratomas, as well as their corresponding hosts. Since D1SS541 and D15S542 were developed from the same -1-kb fragment and showed an identical heterozygosity/homozygosity pattern in all teratomas that were jointly informative, they were haplotyped. Genotype data on D15S541/542 and D15S543, as well as our previously published data on DiSS11, D1SS113 and GABRB3 (Mutirangura et al. 1993a), were combined and jointly analyzed for relative distances from the centromere. For constructing the map, we used the results of physical mapping, which suggests the order 15cen-DlSS541/542-Dl5S543-DlSS11 -DlSSi13GABRB3. Based on this map, table 2 presents the female genetic distances (in cM) and the associated multipoint lod scores (see Materials and Methods in Mutirangura et al. 1993a). The results show that the new markers D15S541/542 and D15S543 map very close to each other (distance 2.7 cM; lod score 6.58) but that, in genetic terms, D15S541/542 is at a considerable distance from the chromosome 15 centromere (distance 12 cM; lod score 3.98). Not unexpectedly, DiSS11, which is -1 Mb distal to D15S543, shows no detectable recombination with D15S543. The other genetic distances are not significantly different from those published by us earlier (Mutirangura et al. 1993a). It is still surprising that D15S541/542, which is physically close to the chromosome 15 centromere, demonstrates a genetic distance of 12 cM. Our previous mapping showed DiSS11 to be 13 cM distal to the centromere: the current data show the same interval to be 14.7 cM-a difference that is not statistically significant. These mapping data suggest that there may be a female recombination hotspot in the pericentromeric long arm of human chromosome 15.
Am. J. Hum. Genet. 57:40-48, 1995
44
Table 2 Gene-Centromere Mapping of Chromosome IS Polymorphisms in Ovarian Teratomas No. OF INFORMATIVE TERATOMAS/NO. OF HETEROZYGOUS TERATOMAS
Type I (n = 24)
MARKER Locusa 15cen
24/24
.....................
41/0
MULTIPOINT LOD SCOREb
MAP DISTANCEb (CM)
..
D15S541/D15S542 (IR39) ......... D15S543 (ML34) ....................... D1SS11 (4-3R) ....................... D15S113 (LS6-1) ....................... 32/11 GABRB3 ........................ 18/16 a
Type II (n = 41)
3.98 35/9 20/19 6.58 8/725/8 .0 7.28 26/7 18/16 2.3 ± 2.0 6.77 16/1431/13 .0 7.82
12.0 ± 3.1 2.2 ± 2.7
Loci are arranged in their presumed physical order relative to the centromere.
For the three intervals 15cen-(S11), (S11)-(S113), and (S113)-GABRB3; data were estimated from all teratomas, by likelihood analysis as described in Patients and Methods. b
Analysis of PWSIAS Deletion Patients
The three microsatellites were used to analyze the position of the proximal deletion breakpoint on 86 PWS or AS patients known to be deleted from D1SS11 through GABRB3 (Kuwano et al. 1992; Robinson et al. 1993b; Zackowski et al. 1993). Figure 2 shows examples of the genotype and family data on two PWS and two AS patients, for the three loci. Of 86 patients (53 PWS and 33 AS) analyzed for D15S541/D15S542, 80 were inforAS Patients
PWS Patients I
I Cls
I
F PtM #1
cs 11 F Pt M #2
---
I
cla I F Pt M #3
Cass
F Pt M #4
D15SS41
D15
D15SU3
Microsatellite analysis. Representative data for S541, Figure 2 S542, and S543 are illustrated for four families; F = father; Pt = patient; and M = mother. A, PWS deletion patients. In patient 1, S541 and S543 were uninformative, while S542 showed a paternal deletion, indicating class I. Patient 2 was uninformative for S543, while S541 and S542 were both informative for biparental inheritance, indicative of class II. B, AS deletion patients. Patient 3 was fully informative for all three markers, showing a maternal deletion for S541, S542, and S543, indicative of class I. Patient 4 was also fully informative for all three markers, showing biparental inheritance for S541 and S542 with a maternal deletion for S543, indicative of class II.
mative for at least one of the two markers. The data on the informative patients confirmed the presence of two classes of deletion as described by Knoll et al. (1990) (table 3). Overall, 44% (35/80) were deleted for S541/ S542, indicating that the deletion breakpoint is proximal to this locus and similar to class I (fig. 2). The other 56% (45/80) were heterozygous at S541/S542, indicating that the deletion breakpoint in this group is distal to this locus. Comparison of the PWS patients versus the AS patients (table 3) showed no significant differences, in relative frequency of the two breakpoint regions, between paternally and maternally derived deletions. A subset of 48 patients (21 PWS and 27 AS) were analyzed for D15S543. Of these, 13/48 were informative for a deletion of this locus, while the remaining 35/48 demonstrated only a single allele (fig. 2). No patients were heterozygous for D15S543, suggesting that this marker is deleted in the majority of PWS and AS cases. This result was unexpected on the basis of the previous FISH data, which had suggested that the right end of y254B5, used to identify c512 from which S543 was derived, extended proximally across the deletion breakpoint for class II patients (Kuwano et al. 1992). For 8/10 patients previously analyzed by FISH, DNA was available for microsatellite analysis on the patient and both parents. Of five informative cases, two were in class I and represented discrepancies with the YAC FISH results. These two patients were deleted for S541/ S542 and had a single allele for S543 but had previously shown a positive FISH signal for y254B5 of reduced intensity on the deleted homologue relative to the normal homologue. In an attempt to clarify this discrepancy, FISH was performed by using c512, from the proximal end of y254B5, on the one patient available for study (data not shown). This result showed a dele-
45
Christian et al.: Deletion Breakpoints in PWS/AS
metaphase band (