Rebuttal Testimony and Schedules Jeffrey C. Robinson
Before the Minnesota Public Utilities Commission State of Minnesota
In the Matter of the Application of Northern States Power Company, a Minnesota corporation for Authority to Increase Rates for Electric Service in Minnesota
Docket No. E002/GR-10-971 Exhibit___(JCR-1)
Bonus Tax Depreciation
May 4, 2011
Table of Contents I.
Introduction and Qualifications
1
II.
Summary and Organization
3
III.
Accelerated and Bonus Depreciation and NOL Carry Forward Explanation of the Company Proposal
4
IV. V.
11
VI.
Comparison of the Company Proposal to Ratemaking Principles and Normalization Requirements Discussion of the OES Proposal
19 24
VII.
Conclusion
27 Schedules
Statement of Qualifications
Schedule 1
2011 and 2012 Rebuttal Bridge Schedules for NOL
Schedule 2
Net Additional Bonus Tax Depreciation
Schedule 3
2010 – 2015 Pre-Existing Loss Determination
Schedule 4
2010 -- 2015 Revenue Requirement Impact of Bonus & Loss Carry-Forward
Schedule 5
i
1
I. INTRODUCTION AND QUALIFICATIONS
2 3
Q.
PLEASE STATE YOUR NAME AND BUSINESS ADDRESS.
4
A.
My name is Jeffrey C. Robinson. My business address is 1270 Kolff Court, Newport, Minnesota 55055.
5 6 7
Q.
BY WHOM ARE YOU EMPLOYED AND WHAT IS YOUR POSITION?
8
A.
Since my retirement from Xcel Energy Services Inc. (“XES” or the “Service
9
Company”) as Manager of Revenue Analysis at the end of 2006, I have been
10
providing support to the Regulatory area of XES on a part time contract
11
basis. My resume is included as Exhibit ____(JCR-1), Schedule 1.
12 13
Q.
PLEASE SUMMARIZE YOUR QUALIFICATIONS AND EXPERIENCE.
14
A.
I have over 34 years of employment experience with Northern States Power
15
Company, a Minnesota corporation (“Xcel Energy” or the “Company”) and
16
have an extensive background in matters that concern the capital invested in
17
utility property and depreciation. I have held management positions in the
18
areas of Depreciation Services, Depreciation & Nuclear Furl Accounting,
19
Corporate Economics & Depreciation, and Capital Asset Accounting. From
20
1994 until my retirement at the end of 2006, I was the manager of Revenue
21
Analysis.
22
regulatory process on a part time contract basis. This has included overall
23
revenue requirements testimony, depreciation testimony, and work on a
24
variety of regulatory petitions related to cost recovery and accounting.
Since my retirement, I have continued to support the rate
25 26
Q.
FOR WHOM ARE YOU TESTIFYING?
27
A.
I am testifying on behalf of Xcel Energy. Docket No. E002/GR-10-971 Robinson Rebuttal 1
1 2
Q.
WHAT IS THE PURPOSE OF YOUR REBUTTAL TESTIMONY?
3
A.
Since the filing of the Company’s Direct Testimony in this case, a Federal tax
4
law has been passed that provides 100 percent Bonus Tax Depreciation on
5
qualifying assets placed in service from September 9, 2010 through
6
December 31, 2011, which will provide more deductions that the Company
7
can currently utilize in 2011. The impact of this change was discussed
8
through several data request responses in which the Company outlined its
9
approach for adjusting its 2011 Test Year revenue requirement and riders to
10
address the complications created by the significant level of additional tax
11
deductions arising from the new Federal tax law.
12
Testimony of Ms. Nancy Campbell on behalf of the Office of Energy
13
Security (“OES”), she has recommended a reduction to the 2011 current
14
income tax expense based on her interpretation of the new Federal tax law
15
and our responses to information requests pertaining to that new law.
In the filed Direct
16 17
The purpose of my Rebuttal Testimony is to address how that tax law
18
change affects the both the 2011 Test Year and our proposed 2012 step
19
increase. I also address the OES’s recommended adjustment, and explain
20
and clarify the Company’s position regarding the rate making treatment of
21
the additional bonus depreciation and resulting Net Operating Losses
22
(“NOLs”), including effects on the revenue requirement in the 2011 Test
23
Year and in 2012 including both base rates and riders.
24
Testimony will also include updates to reflect recent Internal Revenue
25
Service (“IRS”) guidance relating to application of the 100 percent bonus
26
depreciation authorized under the new Federal tax law, and the effects of the
27
termination of the Merricourt Wind Generating Facility
My Rebuttal
Docket No. E002/GR-10-971 Robinson Rebuttal 2
1 2
II. SUMMARY AND ORGANIZATION
3 4
Q.
PLEASE SUMMARIZE YOUR REBUTTAL TESTIMONY.
5
A.
The current tax savings that the Company has obtained from bonus and
6
accelerated depreciation have provided substantial customer benefits
7
through rate base reductions that reduce the revenue requirement. Bonus
8
and accelerated depreciation are also expected to provide substantial benefits
9
into the future.
10 11
The Company’s proposed rate making treatment of bonus tax depreciation
12
and NOLs provides a rate base reduction (and corresponding reduction in
13
the revenue requirement) for all tax savings obtained by the Company as
14
soon as those tax savings are realized. In doing so, it complies with federal
15
income tax law requirements that apply to federal bonus and accelerated
16
depreciation. The Company’s proposal also continues the use of tax
17
normalization consistent with the rate making principles used to set rates in
18
Minnesota.
19 20
The Company’s proposal reflects the 100 percent bonus tax deprecation that
21
became available in December 2010, including recent IRS guidance limiting
22
the availability of 100 percent bonus depreciation, along with the effect of
23
the termination of Merricourt. The Company’s proposal also reflects a rate
24
base increase to the 2011 test year cost of service to make an adjustment for
25
the fact that when rate rider and non-rider mechanisms are analyzed in
26
aggregate, tax benefits provided to ratepayers in these separate rate setting
27
processes have nominally exceeded the level of tax savings that can currently Docket No. E002/GR-10-971 Robinson Rebuttal 3
1
be utilized by the Company, even before consideration of new bonus
2
depreciation.
3 4
The OES initial proposal to reduce current taxes should not be adopted
5
because it does not properly recognize the effects of deferred taxes and it
6
does not follow the tax normalization practice used to set rates in Minnesota.
7
The OES initial proposal could also cause the Company to become out of
8
compliance with federal income tax law requirements for the Company to
9
use federal accelerated and bonus depreciation.
10 11
Q. HOW IS YOUR REBUTTAL TESTIMONY ORGANIZED?
12
A.
My Rebuttal Testimony is organized into the following sections:
13
III.
Accelerated and Bonus Depreciation and NOL Carry Forward
14
IV.
Explanation of the Company Proposal
15
V.
Comparison of the Company Proposal to Ratemaking Principles and Normalization Requirements
16 17
VI.
Discussion of the OES Proposal
18
VII. Conclusion
19 III. ACCELERATED AND BONUS DEPRECIATION
20
AND NOL CARRY FORWARD
21 22 23
Q.
PRIOR YEARS?
24 25
HAS THE COMPANY USED ACCELERATED AND BONUS DEPRECIATION IN
A.
Yes. The Company has used accelerated depreciation for both federal and
26
state income taxes for many years and has also used federal bonus tax
27
depreciation for federal income taxes in years in which that bonus Docket No. E002/GR-10-971 Robinson Rebuttal 4
1
depreciation has been available. The Company is like most utilities in this
2
regard. The Company has normalized all of its income taxes, including both
3
federal and state, as I will explain later in my Rebuttal Testimony.
4 5
Q.
WHAT IS BONUS TAX DEPRECIATION?
6
A.
Bonus tax depreciation is the result of provisions in federal tax laws that
7
allow the Company to deduct either 50 percent or 100 percent of qualifying
8
capital investments in the first year an investment is placed in-service. In the
9
case of the 50 percent bonus depreciation, the remaining 50 percent is
10
depreciated for tax purposes using the existing accelerated depreciation
11
schedules. The Tax Relief Act of 2010 (“2010 TRA”), which became law in
12
December 2010, provided 100 percent bonus tax depreciation (“100 Percent
13
Bonus Depreciation”) for certain projects placed into service from
14
September 9, 2010 through December 31, 2011. In the case of 100 Percent
15
Bonus Depreciation, the entire amount of the investment in a project is
16
permitted as a tax deduction in the first year the project is placed in-service.
17
Both the bonus tax depreciation deductions and the existing accelerated
18
depreciation deductions are normalized for accounting and ratemaking.
19 20
Q.
YEARS?
21 22
HAS BONUS DEPRECIATION BEEN SIGNIFICANT TO THE COMPANY IN RECENT
A.
Yes. Since the onset of the recession in 2008, Congress has enacted three
23
separate laws that provided 50 percent bonus tax depreciation in efforts to
24
stimulate the economy.
25
James J. Duevel, the Company has had NOLs in 2008, 2009 and 2010. In
26
December of 2010, Congress for the first time enacted provisions that
27
allowed 100 Percent Bonus Depreciation in the 2010 TRA. The 2010 TRA
As explained in the Rebuttal Testimony of Mr.
Docket No. E002/GR-10-971 Robinson Rebuttal 5
1
has provided a number of our large construction projects with significant
2
amounts of tax deductions such that we are unable to make use of all of
3
these deductions in 2011.
4 5
Q.
CAN YOU DESCRIBE IN BASIC TERMS HOW NORMALIZATION WORKS?
6
A.
Yes. Normalization refers to an accounting process that creates deferred tax
7
balances to recognize the tax attributable to the timing difference between
8
book accounting and tax accounting. In the case of accelerated depreciation,
9
current income taxes are reduced by the value of the accelerated depreciation
10
deduction multiplied by the tax rate. At the same time, a deferred income
11
tax expense is recorded by multiplying the difference between the accelerated
12
deduction used for tax and the straight line depreciation expense used for
13
book, times the tax rate. This deferred tax expense represents the tax effect
14
of this accelerated depreciation compared to book accounting, and is added
15
to an Accumulated Deferred Income Tax (“ADIT”) balance.
16 17
For the purpose of setting customer rates in a Cost Of Service Study
18
(“COSS”), customer rates are charged for both the current income tax
19
expense and the deferred income tax expense. However, the ADIT balance
20
is applied as a reduction to rate base, which gives customers credit and a
21
reduction in rates. The reduction in rates reflects the Company’s use of
22
taxes that have been collected from customers that are not due and payable
23
in the Company’s current taxes.
24 25 26
Q.
HAS
THE
COMPANY’S
USE OF ACCELERATED AND BONUS DEPRECIATION
PROVIDED SUBSTANTIAL BENEFITS TO CUSTOMER RATES?
Docket No. E002/GR-10-971 Robinson Rebuttal 6
1
A.
Yes. The tax normalization accounting has led to substantial reductions in
2
the Company’s rate base for both federal and state accelerated depreciation
3
and federal bonus depreciation for many years. I have estimated the effects
4
of this tax normalization process for the years since 2008, which are set forth
5
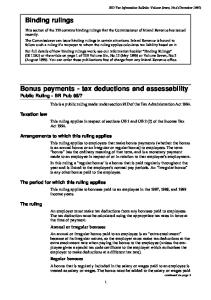
in Table 1 below:
6 7
Table 1: Effects of Tax Normalization of
8
Accelerated and Bonus Depreciation
9
(Dollars in Millions)
Rate Base Effect Revenue Requirement Effect
10 11
2008 ($733) ($95)
2009 2010 ($867) ($1,030) ($112) ($133)
2011 ($1,195) ( $154)
12 13
As Table 1 shows, the Company’s normalization of accelerated and bonus
14
depreciation has provided substantial benefits to customers from reductions
15
to the rate base and revenue requirement even before considering the 100
16
Percent Bonus Depreciation provided in the 2010 TRA.
17 18
Q.
THE TAX NORMALIZATION BECOME MORE COMPLEX AS A RESULT OF
BONUS DEPRECIATION THAT HAS BEEN AVAILABLE SINCE 2008?
19 20
HAS
A.
Yes. Bonus depreciation that has been available since 2008, in conjunction
21
with the Company’s capital investment program, has resulted in more
22
deductions than the Company could currently use since 2008. The result will
23
be a substantial balance of unused NOLs as of December 31, 2011.
24 25
Q.
PLEASE EXPLAIN IN MORE DETAIL WHAT A NOL REPRESENTS.
26
A.
As described above and described in more detail in the Rebuttal Testimony
27
of Mr. Duevel, a NOL results when the Company has more tax deductions Docket No. E002/GR-10-971 Robinson Rebuttal 7
1
than can be utilized in the current period. Specifically, the NOL represents
2
values that are not usable in the current period. NOLs must be carried back
3
or carried forward to another period where the NOL can be applied to
4
reduce current taxes. Unused tax credits are also carried back or forward in
5
similar fashion. In general, federal tax law allows NOLs to be carried back
6
up to two years (one year for unused tax credits) and forward 20 years. The
7
State of Minnesota only allows carry forward.
8 9
Q.
YOU CONSIDERED THESE CARRY BACK AND CARRY FORWARD
PROVISIONS IN YOUR ANALYSIS?
10 11
HAVE
A.
Yes I have. However, as outlined in the Mr. Duevel’s Rebuttal Testimony,
12
the Company did not have any capacity to carry back NOLs from 2010 or
13
2011. As such, I prepared my Rebuttal Testimony and analysis of rate
14
making impacts reflecting only NOL carry forwards.
15 16
Q.
YOU PLEASE WALK THROUGH A SIMPLE EXAMPLE ON HOW DEFERRED
TAXES AND NOL RECOGNITION WORK TOGETHER?
17 18
CAN
A.
Yes.
First, I will assume we have a pre-tax book income of $250 and an
19
effective tax rate of 40 percent. Pre-tax book income represents the net
20
income on a book basis before the recognition of current and deferred
21
income taxes. Effective tax rate represents the rate at which all state and
22
federal, current and deferred taxes are accrued. In this example, 40 percent
23
of $250 equals $100. That means the sum total of current income taxes and
24
deferred income taxes will equal $100.
25
Docket No. E002/GR-10-971 Robinson Rebuttal 8
1
To illustrate how deferred taxes and NOL recognition work together, I have
2
prepared Table 2 below that contains three different levels of accelerated tax
3
deductions:
4
Table 2: Bonus Tax Depreciation and NOL Example
5
Example 1 Example 2 Example 3 Pre-Tax Book Income Current Tax Expense NOL Impact
$250 $50
$250 $0
$250 ($50)
Deferred Tax Expense (& rate base reduction) NOL Impact
$50
$100
$150
Example 3 (Including NOL) $250 ($50) $50 $0 $150
6 7 8 9 10 11 12 13 14 15
Total Current and Deferred Taxes Effective Tax Rate
$100
$100
$100
($50) $100 $100
40%
40%
40%
40%
16 17
Example 1: In this example, current tax expense equals $50 and deferred tax
18
expense equals $50.
19
receiving accelerated tax depreciation in excess of the straight line book
20
depreciation by $125. As far as the rate making process is concerned in
21
Example 1, the COSS income statement would include the total of current
22
and deferred taxes of $100. Also, rate base would be reduced by $50 to
23
represent the value of taxes collected that are not current.
The $50 of deferred tax expense is the result of
24 25
Example 2: In this example, the Company receives an additional $125 of
26
accelerated tax depreciation compared to Example 1 ($250 total). This
27
results in current tax expense being reduced to $0 and deferred tax expense Docket No. E002/GR-10-971 Robinson Rebuttal 9
1
equals $100. The $100 of deferred tax expense is the result of now receiving
2
$250 of accelerated tax depreciation deductions. This means that accelerated
3
tax depreciation exceeded the straight line book depreciation by $250. As
4
for the rate making process in Example 2, the COSS income statement
5
would include the total of current and deferred taxes of $100. Also, rate
6
base would be reduced by the full $100 to represent the fact that all taxes
7
collected are not current.
8 9
Example 3: In this example, yet another $125 of accelerated tax depreciation
10
is recognized. The $150 of deferred tax expense is the result of receiving
11
$375 of accelerated depreciation in excess of straight line book. This has
12
now generated a situation in which current taxes are negative. As far as the
13
rate making process is concerned in Example 3, the COSS income statement
14
would include the total of current and deferred taxes of $100.
15
complication lies in the fact that rate base can only be reduced by $100, not
16
$150, as the Company will only collect $100 from customers and will not
17
receive a refund check or otherwise be able to use the unused negative taxes
18
represented by the NOL. Instead, the tax rules contain a provision to deal
19
with the value of excess deductions that cannot be currently utilized and are
20
represented by the NOL.
The
21 22
Specifically, all $125 of additional deductions received in Example 3 are
23
considered excess and represent the NOL. The accounting associated with
24
this essentially reverses the accounting associated with these additional
25
deductions, as they cannot be currently utilized. As a result, current taxes are
26
moved from the negative $50 back to zero. Deferred taxes are reduced by
27
the same $50, leaving the new total at $100. Finally, the deferred tax Docket No. E002/GR-10-971 Robinson Rebuttal 10
1
reduction of $50 creates an offset to the $150 rate base reduction resulting in
2
the rate base deduction totaling the full $100 of deferred taxes that are
3
collected in rates. I have reflected the required NOL impacts in the final
4
column of Table 2 to illustrate this process.
5 6
Q.
YOU DETERMINED THE AMOUNTS AND IMPACTS OF THE
2010
AND
2011 NOLS FOR THE MINNESOTA ELECTRIC JURISDICTION?
7 8
HAVE
A.
Yes, I have. Using the mechanics of NOL and tax credit carry forwards
9
combined with the appropriate tax normalization accounting outlined above,
10
I have calculated the value of NOL and tax credit carry forward amounts
11
combined with the associated changes to deferred tax expense and ADIT
12
balances to determine the appropriate adjustments that need to be included
13
in the Company’s Rebuttal COSS as presented in the Rebuttal Testimony of
14
Company Witness Ms. Anne E. Heuer.
15 IV. EXPLANATION OF THE COMPANY PROPOSAL
16 17 18
Q.
AND ANALYSIS.
19 20
PLEASE SUMMARIZE THE FACTORS ADDRESSED IN THE COMPANY PROPOSAL
A.
The Company proposal and analysis address the ratemaking treatment of the
21
2010 and 2011 NOLs reflecting full tax normalization of all federal and state
22
income taxes. The Company proposal also addresses the effect of the 100
23
Percent Bonus Depreciation, the recent IRS guidance, and the termination of
24
the Merricourt project. The recent IRS guidance and the termination of the
25
Merricourt project occurred after the Company’s response to OES
26
Information Request 109.
The Company is also proposing a rate base
Docket No. E002/GR-10-971 Robinson Rebuttal 11
1
adjustment needed to match the tax benefits provided to customers with the
2
tax deductions that have been currently utilized by the Company.
3 4
Q.
PERIOD WAS COVERED BY YOUR ANALYSIS OF THE
COMPANY
PROPOSAL?
5 6
WHAT
A.
The analysis I performed covered the period 2010 – 2015. The purpose for
7
this extended period is to illustrate, with the data available today, the
8
estimated timing of when these NOL carry forward benefits will be utilized
9
under the Company proposal, and to provide the necessary adjustments to
10
the Company’s proposed Rebuttal 2011 Test Year COSS and 2012 Step
11
adjustment.
12 13
Q.
PLEASE DESCRIBE THE DATA SOURCES USED TO CONDUCT YOUR ANALYSIS.
14
A.
The primary source data used in my analysis were various Minnesota
15
jurisdiction electric COSS. For 2010, my COSS source was the 2010 bridge
16
year used to develop the 2011 test year. For 2011 and 2012, my source was
17
the Company’s Rebuttal position COSS. For 2013 – 2015, I utilize longer
18
range model information that the Company had available. These studies
19
provided the initial basis from which to analyze the current income tax
20
position for the Minnesota electric retail jurisdiction.
21 22
Q.
COMPLETE YOUR ANALYSIS?
23 24
WHAT OTHER INFORMATION ITEMS AND ADJUSTMENTS WERE NECESSARY TO
A.
The other key component needed for the analysis is the additional bonus tax
25
depreciation generated by the 100 Percent Bonus Depreciation.
This
26
amount reflects the recent IRS guidance concerning application of 100
27
Percent Bonus Depreciation, and the impact of the April 1, 2011 termination Docket No. E002/GR-10-971 Robinson Rebuttal 12
1
of Merricourt.
2
all rate rider properties in the analysis. The basis for this rider inclusion is
3
discussed later in my testimony.
Finally, all COSS base information was adjusted to include
4 5
Q.
WAS YOU ANALYSIS CAREFULLY PERFORMED?
6
A.
Yes. It involved several steps and detailed information. First, I input all of
7
the various information items from the source COSS in summary form and
8
verified that I could replicate the indicated total revenue requirement. Next,
9
these starting values were adjusted to include rate rider amounts resulting in
10
a COSS by year adjusted to include riders. The effects of the 100 Percent
11
Bonus Depreciation was analyzed utilizing the additional guidance provided
12
by the IRS to determine specific net changes in year by year tax depreciation
13
compared the data included in the base COSS, which was prepared prior to
14
the 2010 TRA. This analysis involved a joint effort between the Tax Services
15
department and the Capital Asset Accounting department.
16
adjustments were provided to me by utility and functional class at specific
17
detail to assign or allocate to the Minnesota electric retail jurisdiction. The
18
value associated with the cancelation of Merricourt was also included in this
19
net adjustment. Exhibit___(JCR-1), Schedule 2, provides a bridge schedule
20
that starts with the Company’s Rebuttal COSS for 2011 and 2012 and
21
illustrates the addition of rate riders, as well as the adjustment to remove
22
Merricourt. The net change in bonus tax depreciation resulting from the 100
23
Percent Bonus Depreciation as allocated to the Minnesota retail electric
24
jurisdiction is provided as Exhibit___(JCR-1), Schedule 3. This information
25
was combined and used to determine the year by year value of excess
26
deductions and credits requiring carry forward to a future period. Given
27
these carry forward amounts, the associated deferred tax expense adjustment
These net
Docket No. E002/GR-10-971 Robinson Rebuttal 13
1
was calculated and ADIT balances were accumulated for use as a rate base
2
offset.
3 4
Q.
DESCRIBE HOW THE
COMPANY
MADE ITS DETERMINATION OF THE
NOLS IN THIS CASE?
5 6
PLEASE
A.
The Company has made an aggregate determination of the Minnesota
7
Electric jurisdictional level of NOLs for 2010 and 2011 that takes into
8
consideration both base rates and riders. Making an aggregate determination
9
is the appropriate method to determine the NOLs.
10 11
Q.
WHY IS IT APPROPRIATE TO DETERMINE NOLS ON AN AGGREGATE BASIS?
12
A.
An aggregate determination is appropriate because it will provide benefits to
13
ratepayers sooner than a separate determination, which could delay those
14
benefits.
15
experiencing a loss and the other was not, making an NOL determination
16
separately on each item would lead to deferring the loss and moving it to a
17
future period.
18
applied to the other category that did not have a loss. The net result of this
19
is that benefits would not be returned to customers as quickly if an NOL
20
determination is done separately. The Company is recommending that the
21
NOL determinations be done in aggregate with rate rider and non-rider
22
mechanisms combined resulting in a single adjustment to the base rate
23
process so that these benefits can be returned more quickly.
If, for example, one category of base rates or riders was
An aggregate determination would allow the loss to be
24 25 26
Q.
WERE
THERE OTHER FACTORS THAT AFFECTED THE NET RESULT OF THE
COMPANY’S DETERMINATIONS?
Docket No. E002/GR-10-971 Robinson Rebuttal 14
1
A.
Yes.
After determining that a combined approach was preferred, the
2
Company set up and evaluated the NOLs using COSSs for multiple periods.
3
The primary mechanics of this process involve a year by year assessment of
4
the current taxable income. To the extent that taxable income is negative, a
5
NOL is derived. The NOL reflects the level of deductions that cannot be
6
used in the current period, and establishes a balance to be carried forward to
7
a future period when the deductions can be used. The NOLs also determine
8
the amounts that are an offset to the ADIT balance to limit the net rate base
9
deduction to a level consistent with a zero taxable income. A similar process
10
is utilized for production tax credits that also cannot be currently utilized
11
creating a corresponding offset to the ADIT associated with the value of the
12
credit being carried forward.
13 14
Q.
WHAT WAS THE RESULT OF THIS ANALYSIS?
15
A.
Based on this analysis, the Company determined it had already passed
16
through to customers more tax benefits in riders and in the originally filed
17
Test Year than were available, even on a combined basis, and even before
18
consideration of 100 Percent Bonus Depreciation provided under the 2010
19
TRA. The Company is proposing to correct for the excess pass through of
20
benefits by rebalancing so that the tax benefits provided to ratepayers match
21
the tax deductions that can be realized by the Company. The proposed
22
adjustment has been included in the rebuttal COSS as supported by Ms.
23
Heuer in her Rebuttal Testimony.
24 25
Q.
WHAT WAS THE RESULT OF THE TERMINATION OF MERRICOURT?
26
A.
The termination of Merricourt caused the removal of significant 100 Percent
27
Bonus Depreciation and a significant amount of Production Tax Credits Docket No. E002/GR-10-971 Robinson Rebuttal 15
1
(“PTCs”). The 2011 bonus tax depreciation was reduced by approximately
2
$400 million and 2011 PTCs were reduced by approximately $11 million
3
annually on a total Company basis, beginning in 2012.
4 5
Q.
WHAT WAS THE RESULT OF THE RECENT IRS GUIDANCE?
6
A.
The recent IRS guidance reduced the portion of the Nobles wind farm
7
investment (placed in-service in 2010) that qualified for 100 Percent Bonus
8
Deprecation. The Company had expected the entire Nobles investment to
9
qualify for 100 Percent Bonus Depreciation when it responded to OES IR
10
109. The more conservative recent IRS guidance means that the 100 Percent
11
Bonus Depreciation will apply to only about 20 percent of the total Nobles
12
project cost rather than the entire Nobles project as originally expected. It
13
should be noted that the remaining 80 percent of the Nobles project
14
continues to qualify for 50 percent bonus depreciation, which is still a
15
significant benefit to our customers.
16
depreciation was reduced however, the recent IRS guidance provided
17
increases in 2012 for long-term construction assets.
As a result, 2010 bonus tax
18 19
Q.
WHAT WERE THE RESULTS OF THE COMPANY’S ANALYSIS?
20
A.
The results of the Company’s analysis are summarized in Table 3, below:
21 22 23 24 25 26 27 Docket No. E002/GR-10-971 Robinson Rebuttal 16
1
Table 3: Revenue Requirement Summary
2
($ in millions)
3 4 5 6 7 8
Revenue Requirement Impact 2010 2011 2012 2013 2014 2015
Pre-existing 100% Bonus Loss Depreciation $1.8 $0.0 $1.9 ($0.3) $0.8 ($4.2) $0.0 ($15.3) $0.0 ($20.4) $0.0 ($19.1)
Net Change $1.8 $1.6 ($3.4) ($15.3) ($20.4) ($19.1)
9 10 11
As described above, the Company first developed a COSS, including both
12
rider and non-rider components, adjusted for the removal of Merricourt, and
13
determined the value of the pre-existing NOLs and the associated revenue
14
requirements.
15
requirements as indicated in the “Pre-existing Loss” column of Table 3.
This determination resulted in additional revenue
16 17
The Company then determined the revenue requirement impact of the Tax
18
Relief Act of 2010, after consideration of the pre-existing NOLs. This
19
determination included the Company’s original interpretation of 100 Percent
20
Bonus Depreciation updated for the impact of the recent IRS guidance and
21
the cancelation of the Merricourt wind project.
22
revenue requirement impacts associated with these three items are shown as
23
decreases to annual revenue requirements in the “100% Bonus
24
Depreciation” column of Table 3. The “Net Change” column of Table 3
25
represents the combined annual change in revenue requirements associated
26
with the Pre-existing Loss and the 100% Percent Bonus Depreciation.
The calculated annual
27 Docket No. E002/GR-10-971 Robinson Rebuttal 17
1
Q.
DOES
A NET INCREASE IN THE
2011
REVENUE REQUIREMENT MEAN THAT
2
THE REVENUE REQUIREMENT INCREASED AS A RESULT OF A DECREASE IN
3
CURRENT FEDERAL INCOME TAXES?
4
A.
No. The increase in the 2011 revenue requirement was not the result of a
5
decrease in current federal income taxes. The increase in the 2011 revenue
6
requirement was the result of assessing the NOL on a combined basis with
7
rate rider and non-rider mechanisms added together and the adjustment for
8
the excess pass through of tax benefits to customers. This combined result
9
is being recognized in the base rate process.
10 11
Q.
YOU COMPARE THE RESULT OF THESE CHANGES TO THE BENEFITS
ANTICIPATED IN THE RESPONSE TO OES INFORMATION REQUEST 109?
12 13
CAN
A.
Yes. The magnitude of benefits available to customers is reduced from the
14
level anticipated in the Company’s response to OES Information Request
15
109, and the period that these benefits need to be carried forward to future
16
years is also reduced.
17
anticipates full utilization of all unused NOLs by the year 2014 with the
18
ability to begin to consume a portion of these carry forward benefits
19
beginning in 2012. The Rebuttal Testimony of Mr. Richard A. Ostberg
20
addresses the impact of the 2012 reduction on the step increase request.
Based on current information, the Company
21 22
This estimate is somewhat dependent on two key factors. First, it assumes
23
no additional tax legislation which affect 2011 and 2012. Second, it assumes
24
the level of income in the 2011 Test Year based on the Company’s Rebuttal
25
Testimony and the Company’s proposed step increase in 2012. It also
26
assumes that we will file a rate case for a 2013 Test Year and earn our
27
authorized return in that year and subsequent years. Docket No. E002/GR-10-971 Robinson Rebuttal 18
1 2
Q.
THE
COMPANY
PREPARED A DETAILED ANALYSIS OF PREEXISTING
NOLS AND THE IMPACT OF 100 PERCENT BONUS DEPRECIATION?
3 4
HAS
A.
Yes. The Company has prepared both a detailed analysis of NOLs and the
5
impact of 100 Percent Bonus Depreciation, along with a bridge schedule to
6
illustrate the step by step values associated with this process. The detailed
7
calculations associated with the pre-existing NOLs as a result of combining
8
rate rider and non-rider mechanisms into a single COSS are shown in
9
Exhibit __ (JCR-1), Schedule 4. The detailed calculations associated with the
10
impact of 100 Percent Bonus Depreciation, the recent IRS guidance, and the
11
termination of the Merricourt project are shown in Exhibit __ (JCR-1),
12
Schedule 5.
13 14
V. COMPARISON OF THE COMPANY PROPOSAL TO RATE-
15
MAKING PRINCIPLES AND NORMALIZATION
16
REQUIREMENTS
17 18
Q.
DOES
THE
COMPANY’S
PROPOSAL COMPLY WITH
FEDERAL
INCOME TAX
NORMALIZATION REQUIREMENTS?
19 A
Yes it does.
22
Q.
PLEASE SUMMARIZE THOSE REQUIREMENTS.
23
A.
As explained in Mr. Duevel’s Rebuttal Testimony, the Federal tax
20 21
24
normalization requirements pertaining to federal accelerated tax depreciation
25
(including bonus tax depreciation) requires that accelerated tax depreciation
26
be reflected in rates through adjustments to rate base and not more rapidly
27
than the utility is able to use the accelerated depreciation deductions to Docket No. E002/GR-10-971 Robinson Rebuttal 19
1
reduce current taxes. This is accomplished by the recording of deferred
2
income tax expenses that normalize the difference between book income
3
and tax income and restore these differences in rates through the rate base
4
adjustment related to the balance of ADIT.
5 6
Q.
NORMALIZATION REQUIREMENTS APPLY TO THE NEW
100 PERCENT
BONUS DEPRECIATION AMOUNTS?
7 8
DO
A.
Yes. As Mr. Duevel explained, all new Federal tax depreciation amounts (including the 100 Percent Bonus Depreciation) require normalization.
9 10 11
Q.
CAN BE MADE?
12 13
ARE THERE LIMITATIONS ON THE LEVEL OF RATE BASE ADJUSTMENTS THAT
A.
Yes. Changes in current tax resulting from 100 Percent Bonus Depreciation
14
cause a shift between current and deferred income taxes resulting in rate
15
base changes through the ADIT, not income statement changes. Rate base
16
reductions are limited to the amount resulting from the use of depreciation
17
deductions that reduce current taxes to zero that have been included in rates
18
paid by customers. In other words, the ADIT adjustment cannot exceed the
19
level of current income tax savings that has resulted from use of accelerated
20
depreciation.
21 22
Q.
HOW DOES THIS LIMITATION APPLY TO NOLS?
23
A.
As explained in the Rebuttal Testimony of Mr. Duevel, a NOL represents
24
the value of deductions that cannot be used in the current period. This acts
25
as an offset to the additional tax deductions and limits the current period use
26
so that taxes do not go below zero. The normalization requirements also
27
prevent the rate base from being reduced by amounts that have not led to Docket No. E002/GR-10-971 Robinson Rebuttal 20
1
current tax savings. In other words, normalization requirements prevent rate
2
base reductions from being made for the future tax savings represented by
3
an NOL, including the future tax savings represented by an NOL carry
4
forward. The result is that the ADIT reduction to rate base must be reduced
5
by the portion attributable to the NOL.
6 7
Q.
YOU
SUMMARIZE
THE
RESULT
OF
APPLYING
NORMALIZATION
REQUIREMENTS TO NOLS?
8 9
CAN
A.
Yes.
By applying normalization to the NOL determination, a negative
10
deferred income tax expense is generated that equals the tax rate times the
11
NOL. As deferred tax expenses caused by the bonus depreciation reduce
12
rate base, a negative deferred tax expense (as a consequence of the NOL)
13
limits the rate base reduction to a level that is consistent with the Company’s
14
ability to utilize these benefits.
15 16
Recognition of the NOL in rate base is just a means of tracking current
17
deductions on an aggregate basis rather than a net basis. The NOL is
18
established at the level that brings current tax to zero.
19
provide for the appropriate level of deferred income tax expense when this
20
approach is used. The need to apply the combined tax rate to taxable
21
income and then assign it to either current or deferred tax expense in the
22
cost of service, as illustrated in my simple example presented earlier in my
23
Rebuttal Testimony, is a requirement of normalized tax treatment, and this
24
step was missing from Ms. Campbell’s proposed adjustment.
Our calculations also
25 26 27
Q.
IS IT IMPORTANT FOR THE RATEMAKING TREATMENT TO COMPLY WITH THE FEDERAL TAX NORMALIZATION ACCOUNTING REQUIREMENTS?
Docket No. E002/GR-10-971 Robinson Rebuttal 21
1
A.
Yes. The Company’s ability to use accelerated and bonus depreciation for
2
federal income tax purposes is dependent on compliance with Federal
3
income tax normalization requirements for ratemaking purposes.
4 5
Q.
CUSTOMERS BENEFITTED FROM THE APPLICATION OF ACCELERATED
DEPRECIATION?
6 7
HAVE
A.
Yes. As illustrated in Table 1 which I explained earlier in my Rebuttal
8
Testimony, the rate base reduction associated with accelerated deductions
9
exceeds $1 billion in 2011 causing annual revenue requirements to be
10
reduced by $154 million. Very substantial revenue requirement reductions
11
have been applied in all of the Company’s rate cases. If the Company had
12
not been in compliance with Federal income tax normalization requirements
13
for ratemaking purposes, these reductions would not have been possible. If
14
the Company lost the ability to use federal accelerated and bonus
15
depreciation, there would be severe consequences for both the ratepayers
16
and the Company.
17 18
Q.
FULLY NORMALIZED JURISDICTION?
19 20
FOR THE PURPOSE OF SETTING RATES, IS MINNESOTA CONSIDERED TO BE A
A.
Yes.
Based on my experience in preparing rate case data for the vast
21
majority of cases filed by the Company in Minnesota, the Company has
22
consistently applied a practice of normalizing timing differences between
23
book and tax income and expense. This consistent treatment has also been
24
the standard used by the Commission for the purpose of setting customer
25
rates in Minnesota. This has included a number of timing differences that
26
are not required by law to be normalized but are consistent with the
27
established normalization ratemaking practice. Docket No. E002/GR-10-971 Robinson Rebuttal 22
1 2
Q.
CAN YOU PLEASE IDENTIFY A FEW OF THE MATERIAL TIMING DIFFERENCES COMPANY
3
NORMALIZED BY THE
4
PRACTICE AND INCLUDED IN PRIOR RATE CASES FOR THE PURPOSE OF
5
SETTING CUSTOMER RATES?
6
A.
CONSISTENT WITH ITS ACCOUNTING
Some of the more significant timing differences that are normalized for tax
7
purposes include: (i) timing differences between the book accrual related to
8
retirement medical funding and the tax deductible expense; (ii) the timing
9
difference between the book accrual for the non-qualified nuclear
10
decommissioning fund compared to the tax deduction for incurred
11
decommissioning expense; and (iii) most recently, nuclear outage costs
12
currently deducted for tax purposes and amortized for book purposes. This
13
approach reflects that timing differences in which investors supply funds are
14
added to rate base and timing differences when customers or the
15
government supplies funds are treated as reductions to rate base. This
16
symmetry assures that customers pay only a return on investor supplied
17
capital and that investors have an opportunity to earn on the funds actually
18
invested.
19 20
Q.
IS THE COMPANY’S PROPOSED TREATMENT OF NOLS CONSISTENT WITH THIS
21
COMPANY’S
22
RATEMAKING?
23
A.
BOOK ACCOUNTING PRACTICE AND ESTABLISHED
COMMISSION
Yes it is. The establishment of the deferred tax liability associated with
24
accelerated tax depreciation deduction combined with an offsetting deferred
25
tax asset associated with the NOL that represents the value of tax deductions
26
that cannot be currently utilized is consistent with historical practice of full
27
tax normalization for purposes of setting customer rates in Minnesota. Docket No. E002/GR-10-971 Robinson Rebuttal 23
1 2 3
VI. DISCUSSION OF THE OES PROPOSAL
4 5
Q.
YOU REVIEWED THE INCOME TAX ADJUSTMENT PROPOSED BY
MS.
CAMPBELL ON BEHALF OF THE OES IN HER FILED DIRECT TESTIMONY?
6 7
HAVE
A.
Yes, I have.
Q.
CAN
8 9
MS. CAMPBELL
USED TO
DETERMINE THAT AN ADJUSTMENT WAS NECESSARY?
10 11
YOU SUMMARIZE THE BASIS UPON WHICH
A.
It is my understanding that in Ms. Campbell’s analysis of the 2010 TRA
12
increasing the bonus tax depreciation from 50 percent to 100 percent,
13
combined with the Company’s supplemental response to OES-0109 that in
14
part indicated that current income taxes would be set to zero resulted in her
15
recommendation to reduce current income tax expense by $12,587,000.
16
This adjustment was then provided to Mr. Dale Lusti as an adjustment to the
17
income statement in the OES COSS resulting in a revenue requirement
18
reduction of $21,469,000 after gross-up for income taxes.
19 20
Q.
DID
MS.
CAMPBELL ARRIVE AT THE
$12,587,000
REDUCTION TO
CURRENT INCOME TAX EXPENSE?
21 22
HOW
A.
Ms. Campbell used the Company’s filed test year COSS included in the
23
direct testimony of Ms. Heuer as the basis for this adjustment.
Ms.
24
Campbell’s adjustment was based on three steps.
25
statement current income tax expense included in the COSS totaled
26
($49,524,000).
27
income deficiency and the requested revenue deficiency represents a gross
First, the income
Second, the difference between the indicated operating
Docket No. E002/GR-10-971 Robinson Rebuttal 24
1
up for income taxes, which is needed so that the requested revenue
2
deficiency will yield an additional after tax operating income that equals the
3
operating income deficiency. This amount totaled $62,111,000. Third, the
4
net of the $62,111,000 gross-up and the negative $49,524,000 income
5
statement amount equals the $12,587,000 adjustment proposed by Ms.
6
Campbell.
7 8
Q.
9
THIS
ADJUSTMENT
REQUIREMENTS AND
CONSISTENT
COMMISSION
WITH
THE
TAX
NORMALIZATION
ADOPTED NORMALIZATION PRACTICE
DESCRIBED ABOVE?
10 11
IS
A.
No, it is not.
Q.
WHAT
12 13
MS. CAMPBELL’S
PROPOSED CURRENT INCOME TAX ADJUSTMENT?
14 15
CONCERNS DO YOU HAVE WITH RESPECT TO
A.
I have three basic concerns.
First, the adjustment proposed by Ms.
16
Campbell did not meet normalization requirements and did not reflect the
17
excess tax savings that had been returned to customers in riders. The
18
adjustment proposed by Ms. Campbell adjusted current income tax without
19
an offsetting adjustment to deferred income tax for the additional 100
20
Percent Bonus Depreciation that reduces current income tax to zero, which
21
is required by normalization. Had Ms. Campbell increased deferred income
22
taxes by the same amount and included the deferred tax amount as an
23
adjustment to rate base, her approach would have been consistent with the
24
normalization of this adjustment on a net basis based on the Company’s filed
25
COSS. However, that would have only covered the non-rider amounts
26
included the test year, and ignored the excess amount of current tax savings
27
that had already been returned to customers in the rate rider process. Docket No. E002/GR-10-971 Robinson Rebuttal 25
1 2
Second, the OES adjustment reflected a doubling up of the gross up factor.
3
By starting with an adjustment that includes a gross-up factor, the
4
$12,587,000 has already been converted to revenue requirements.
5
applying this expense/tax adjustment to the income statement in the OES
6
COSS, the revenue requirement was grossed-up a second time resulting in a
7
revenue requirement change of $21,469,000.
By
8 9
Third, the OES elected to base the adjustment on the Company’s filed
10
COSS, rather than the OES recommended COSS. The net result is that the
11
OES’s COSS is left in a negative current tax position.
12 13
Q.
ARE YOUR CONCLUSIONS WITH RESPECT TO THE ADJUSTMENT AS
PROPOSED BY THE OES?
14 15
WHAT
A.
As discussed above, the adjustment as proposed by the OES is not
16
consistent with the Commission’s prior normalization standard for setting
17
rates and not consistent with the federal tax law normalization requirements,
18
resulting in inappropriate changes to the combined level of current and
19
deferred taxes in the income statement instead of appropriately adjusting rate
20
base only.
21
deferred income tax expense offset, leaving only an adjustment to rate base
22
as a result of changes in the level of deferred tax expense. The OES
23
proposed adjustment also does not consider rate riders in combination with
24
non-rider base rates to determine an overall current tax level in rates. Due to
25
the omission of deferred taxes and the need to also address rate riders in this
26
process, the OES recommendations should not be adopted.
When tax normalization is applied, changes in current and
27 Docket No. E002/GR-10-971 Robinson Rebuttal 26
1
VII. CONCLUSION
2 3
Q.
WHAT
ARE YOUR CONCLUSIONS WITH REGARD TO THE PROPER IMPACT ON
COMPANY’S
2011
2012
STEP INCREASE, IN
4
THE
5
RELATION TO THE ADDITIONAL BONUS TAX DEPRECIATION AND NOLS?
6
A.
PROPOSED
TEST YEAR AND
As described in this rebuttal testimony, recent tax legislation has provided
7
more tax deductions to the Company than it has been able to currently use.
8
The Company believes that an NOL representing the tax value of the
9
deduction that cannot be currently utilized should be determined on a
10
combined basis, including both rate rider and base rate amounts together.
11
This approach will return these benefits to customers more quickly than an
12
approach that determines unused NOLs separately. When performing these
13
calculations, we determined that the Company had already been in an NOL
14
position, and had returned more benefits to customers than were usable by
15
the Company.
16
customers causes an increase in revenue requirements of $1.9 million in the
17
2011 Test Year and $0.8 million in the proposed 2012 step increase.
As a result, adjustment for the excess return of benefits to
18 19
In addition, the Company is recommending a revenue requirement decrease
20
of $0.3 million in the 2011 test year and $4.2 million in the proposed 2012
21
step associated with the benefits derived from the 2010 TRA that was passed
22
since the Company filed its direct case. The net of these two separate
23
determinations results in a 2011 test year revenue requirement increase of
24
$1.6 million and a 2012 step revenue requirement decrease of $3.4 million.
25
The determination of these benefits is based on the Company’s rebuttal
26
COSS and has been incorporated in the final revenue deficiency
27
recommendations of Ms. Heuer and Mr. Ostberg. Docket No. E002/GR-10-971 Robinson Rebuttal 27
1 2
The adjustments proposed by the Company are consistent with the historic
3
tax normalization approach used to set customer rates in Minnesota and
4
comply with Federal normalization requirements. In the end, the net result
5
of these adjustments causes a shift between current and deferred income
6
taxes, leaving current income taxes at zero, and the total taxes collected from
7
customers in the category of deferred taxes. Rate base is reduced by the total
8
taxes collected from customers, as the entire tax amount represents deferred
9
taxes, not current taxes. In future periods as taxable income turns positive,
10
all unused NOLs carried forward are utilized to reduce the current tax level
11
to zero and provide additional rate base deductions.
12
further reduce revenue requirements based on the utilization of depreciation
13
deductions. The net result is an equitable balance providing customers
14
reduced revenue requirements as quickly as benefits are utilized without
15
penalizing the Company by reducing rates in advance if this utilization.
This process will
16 17
Q.
DOES THIS CONCLUDE YOUR REBUTTAL TESTIMONY IN THIS PROCEEDING?
18
A.
Yes, it does.
Docket No. E002/GR-10-971 Robinson Rebuttal 28
Northern States Power Company, a Minnesota corporation Statement of Qualifications Jeffrey C. Robinson
Docket No. E002/GR-10-971 Exhibit___(JCR-1), Schedule 1 Page 1 of 3
Independent Contract January, 2007 - current Xcel Energy Retiree (employed 9/72 – 12/06)
Jeffrey C Robinson LLC 1270 Kolff Ct Newport, MN 55055
Current Responsibilities Since my retirement form Xcel Energy Services Inc. (“XES” or the “Service Company”) as Manager of Revenue Analysis at the end of 2006, I have been providing support to the Regulatory area of XES on a part-time contract basis. This has included overall revenue requirements testimony in North Dakota and Minnesota as well as assisting with a variety of regulatory petitions related to cost recovery and accounting. In my most recent position as manager of Revenue Analysis which I held from 1994-2006, I was responsible for the general administration of the Revenue Analysis area and for the preparation and presentation of cost of service studies, revenue requirement determinations and jurisdictional annual reports for electric and gas rates filed on behalf of Northern States Power Company, Minnesota, with the Minnesota Public Utilities Commission (MPUC), the North Dakota Public Service Commission, the South Dakota Public Utilities Commission and the Federal Energy Regulatory Commission (FERC). Previous Employment (1972-1994) Operations Analyst - NSP Tax Depreciation Analyst - NSP Manager, Depreciation Services - NSP Manager, Depreciation & Nuclear Fuel Accounting - NSP Manager, Corporate Economics and Depreciation - NSP Manager, Capital Asset Accounting – NSP Manager, Revenue Requirements – NSP Manager, Revenue Analysis – XES Education University of Wisconsin, River Falls - Bachelor of Science Major - Mathematics Certifications Certified Depreciation Professional (1997-2003) Professional Associations and Registrations Past Chair - Edison Electric Institute, Depreciation Accounting Committee (1984-1985) Society of Depreciation Professionals Articles or Papers Published or Presented Jeffrey C. Robinson, “A Sinking Fund Approach to Nuclear Fuel Disposal Recovery,” Iowa State University Regulatory Conference 1980 - Vol. 19. May 1980.
Northern States Power Company, a Minnesota corporation Statement of Qualifications Jeffrey C. Robinson
Docket No. E002/GR-10-971 Exhibit___(JCR-1), Schedule 1 Page 2 of 3
Jeffrey C. Robinson, “A Sinking Fund Approach to Nuclear Fuel Disposal Recovery,” A.G.A. - EEI Depreciation Accounting Committee, Journal of Papers - Administration Year 1980 -1981, Vol. 2, June 1980. Jeffrey C. Robinson, “Mechanized Depreciation Accounting Systems,” A.G.A. - EEI Depreciation Accounting Committee, Journal of Papers - Administrative Year 1980-1981, Vol. 2, February 1981. Jeffrey C. Robinson, “Revenue Requirements Related to Unit-Of-Production Depreciation,” A.G.A. EEI Depreciation Accounting Committee, Journal of Papers - Administrative Year 1981-1982, Vol. 3, February 1982. Jeffrey C. Robinson and Cheryl R. Hatfield, “Economic Comparison of Nuclear Decommissioning Funding Alternatives,” Proceedings of the A.G.A. Depreciation and EEI Depreciation Accounting Committee, Administrative Year 1986-1987, Vol. 8, September, 1987. Jeffrey C. Robinson, “Economic Evaluation of Power Plant Life Extension,” Proceedings of the A.G.A. Depreciation and EEI Depreciation Accounting Committee, Administrative Year 1987-1988, Vol. 9, September, 1988. Previous Testimony FERC, Nuclear Fuel Disposal, Docket No. ER81-651-000, 1981 FERC, Nuclear Fuel Disposal, Docket No. ER81-653-000, 1981 FERC, Tax Normalization, Docket No. ER88-72-000, 1988 FERC, Nuclear Decommissioning, Docket No. ER88-75-000, 1988 Minnesota, Ramsey County District Court, Depreciation, File No. 456710, 1984 Minnesota, Nuclear Decommissioning, Docket No. E002/GR-87-670, 1987 Minnesota, Nuclear Decommissioning, Docket No. E002/GR-89-865, 1989 Minnesota, Nuclear Fuel Storage, Docket No. E002/CN-91-19, 1991 Minnesota, Depreciation and Nuclear Decommissioning, Docket No. E002/GR-92-1185, 1992 Minnesota, Pre-Merger Revenue Requirements, Merger Rate Plan, Savings Allocations, Docket No. E,G-002/PA-95-500, 1995 Minnesota, Rate Base, Docket No. G002/GR-97-1606, 1997 Minnesota, Overall Revenue Requirements, Rate Base, Income Statement, Docket No. G002/GR-041511, 2004 Minnesota, Overall Revenue Requirements, Rate Base, Income Statement, Docket No. E002/GR-051428, 2005 Minnesota, Overall Revenue Requirements, Rate Base, Income Statement, Docket No. G002/GR-061429, 2005 Minnesota, Nuclear Rate Stability Plan, Docket No. G002/GR-08-1065, 2008
Northern States Power Company, a Minnesota corporation Statement of Qualifications Jeffrey C. Robinson
Docket No. E002/GR-10-971 Exhibit___(JCR-1), Schedule 1 Page 3 of 3
North Dakota, Depreciation, Docket No. 10,979, 1987 North Dakota, Overall Revenue Requirements, Rate Base, Income Statement, Case No. PU 400-04578, 2004 North Dakota, Overall Revenue Requirements, Rate Base, Income Statement, Case No. PU-06-525, 2005 North Dakota, Depreciation, Case No. PU-07-776, 2008 South Dakota, Nuclear Decommissioning, Docket No. F-3764, 1988
Docket No. E002/GR-10-971 Exhibit___(JCR-1), Schedule 2 Page 1 of 1
Northern States Power Company, a Minnesota corporation Electric Utility - State of Minnesota 2011 and 2012 Rebuttal Bridge Schedules for NOL
($000's)
Line No.
1 2 3 4 5 6
7 8 9 10 11 12 13 14 15 16
2011 Rebuttal Bridge for NOL
Description
Rebuttal Position Pre New Bonus and NOLs (1)
Operating Revenues Retail Asset & Non Asset Margin Sharing Interdepartmental Other Operating Gross Earnings Tax Total Operating Revenues
$2,669,383 ($1,113) $607 $613,600 $0 $3,282,477
Expenses Operating Expenses: Fuel & Purchased Energy Power Production Transmission Distribution Customer Accounting Customer Service & Information Sales, Econ Dvlp & Other Administrative & General Amortization Total Operating Expenses
$1,143,912 $639,774 $160,950 $93,346 $52,768 $85,075 $151 $173,154 $20,268 $2,369,399
17
Depreciation
$315,063
18 19 20 21 22 23
Taxes: Property Gross Earnings Deferred Income Tax & ITC Federal & State Income Tax Payroll & Other Total Taxes
$109,889 $0 $156,171 ($46,100) $26,491 $246,451
24 Total Expenses 25
Allowance for Funds Used During Construction
26 Total Operating Income
Add Riders for NOL Calculation (2) $34,716
2012 Rebuttal Bridge for NOL
2011 Rebuttal Remove Merricourt in Position with Riders RES & Base (3) (4) ($25,118)
8,971 $43,687
($25,118)
$1,185 $12,910
($1,185)
Rebuttal Position Pre New Bonus and NOLs (1)
Add Riders for NOL Calculation (2) $59,110
2012 Rebuttal Remove Merricourt in Position with Riders RES & Base (3) (4)
$2,678,981 (1,113) 607 622,571 $0 $3,301,046
$2,837,036 (1,113) 610 655,642 $0 $3,492,175
($33,671)
$1,171,956 $673,856 $173,718 $97,385 $54,791 $90,323 $155 $186,498 $24,512 $2,473,194
$0 $31,914
($2,183)
$1,171,956 $673,856 $203,449 $97,385 $54,791 $90,323 $155 $186,498 $24,512 $2,502,925
$36,930 $96,040
($33,671)
$2,183 $29,731
($2,183)
$2,862,475 (1,113) 610 692,572 $0 $3,554,544
($4,200) $9,895
($1,185)
$1,143,912 $639,774 $173,860 $93,346 $52,768 $85,075 $151 $173,154 $16,068 $2,378,109
$2,268
($1,615)
$315,716
$343,362
$13,774
($12,713)
$344,423
($1,742)
($20,110) $14,141
$118,322 $0 $91,816 $43,439 $27,145 $280,722
$2,459
$20,696 ($12,096)
$110,124 $0 $156,757 ($44,055) $26,491 $249,317
$32,053 ($26,175)
($33,079) $37,808
$119,039 $0 $90,790 $55,072 $27,145 $292,046
$235
$8,835
($5,969)
$20,998
($8,769)
$2,943,142 $53,988
$47,517
$0
$0
$47,517
$22,689
($16,349)
$411,892
$442,414
$42,015
($21,762)
$462,667
$5,585,578 $478,684 $405,553 $73,132 $124,734
$238,455 $20,436 $22,689 ($2,253) ($3,843)
($146,671) ($12,570) ($16,349) $3,780 $6,447
$5,677,362 $486,550 $411,892 $74,658 $127,338
$5,819,737 $498,751 $442,412 $56,340 $96,094
$431,118 $36,947 $42,015 ($5,068) ($8,644)
($249,310) ($21,366) ($21,762) $396 $675
$6,001,545 $514,332 $462,665 $51,668 $88,125
$2,930,912 $53,988 $405,553
$3,097,278
$8,337
$2,987
$54,025
($11,909)
$3,139,394
27 28 29 30 31
Calculation of Revenue Requirements Rate Base Required Operating Income Operating Income Operating Income Deficiency Revenue Deficiency Total Revenue Requirement
$2,793,611
$30,873
($18,671)
$2,805,813
$2,932,627
$50,466
($32,996)
$2,950,097
32 33 34 35 36 37 38 39 40 41 42 43 44 45 46
Calculation of Income Taxes Operating Revenue - Operating Exp - Amortizations - Taxes oth than Inc Operating Income before Adjs Additions to Income Deduct from Income Debt Synchronization State Taxable Income State Income Tax before Credits State Tax Credits Federal Taxable Income Fed Income Tax before Credits Federal Tax Credits Income Tax
$3,282,477 $2,349,131 $20,268 $136,380 $776,698 $174,516 $855,250 $160,306 ($64,342) ($6,306) $531 ($57,505) ($20,127) $19,137 ($46,100)
$43,687 $14,095 ($4,200) $235 $33,557 $10,498 $63,377 $6,844 ($26,166) ($2,564) $0 ($23,601) ($8,260) $1,271 ($12,096)
($25,118) ($1,185) $0 $0 ($23,933) ($7,679) ($58,513) ($4,209) $31,110 $3,049 $0 $28,062 $9,822 ($1,271) $14,141
$3,301,046 $2,362,041 $16,068 $136,615 $786,322 $177,335 $860,114 $162,940 ($59,397) ($5,821) $531 ($53,045) ($18,566) $19,137 ($44,055)
$3,492,175 $2,448,682 $24,512 $145,467 $873,514 $188,684 $736,334 $167,026 $158,838 $15,566 $531 $143,803 $50,331 $21,925 $43,439
$96,040 $31,914 $0 $2,459 $61,667 $5,066 $97,340 $12,373 ($42,980) ($4,212) $0 ($38,768) ($13,569) $8,394 ($26,175)
($33,671) ($2,183) $0 ($1,742) ($29,746) ($3,000) ($96,690) ($7,155) $71,099 $6,968 $0 $64,131 $22,446 ($8,394) $37,808
$3,554,544 $2,478,413 $24,512 $146,184 $905,435 $190,750 $736,984 $172,244 $186,957 $18,321 $531 $169,166 $59,208 $21,925 $55,072
Docket No. E002/GR-10-971 Exhibit___(JCR-1), Schedule 3 Page 1 of 1 Northern States Power Company, a Minnesota corporation Electric Utility - State of Minnesota Net Additional Bonus Tax Depreciation Job Creation Act of 2010 Dollars in Thousands
1 2 3 4 5 6
Additional Bonus Production Transmission Distribution Common & General Total Net Change
2010 30,531 9,736 4,905 5,333 50,506
2011 207,820 77,398 68,105 45,872 399,194
2012 258 34,060 33,342 (1,667) 65,994
2013 (31,365) 30,706 (6,846) (22,267) (29,771)
2014 (39,529) (13,870) (7,571) (13,639) (74,610)
2015 (34,394) (12,535) (7,004) (6,426) (60,360)
Northern States Power Company, a Minnesota corporation 2010 - 2015 Pre-Existing Loss Determination
Docket No. E002/GR-10-971 Exhibit___(JCR-1), Schedule 4 Page 1 of 4
2010 - 2015 Pre-Existing Loss Determination 1 2 3 4 5 6 7 8 9 10 11 12 13 14 15 16 17
Input Assumptions Weighted Cost of Debt Weighted Cost of Equity Composite Cost of Capital Composite Tax Rate Current Tax Rate Federal Tax Rate State Rate Income Tax GrossUp Factor Current COSS MN Jur Revenue Requirement Rate Base Plus CWIP Balance Plus Plant In-Service Less Book Depreciation Reserve Less Accum Deferred Taxes Plus Other Rate Base Average Rate Base (BOY/EOY)
18 19 20 21 22 23 24 25 26 27 28 29 30 31 32 33 34 35 36
Plus Debt Return Plus Equity Return Total Return Income Statement Plus Operating Expense Plus Amortization Expense Plus Payroll & Other Taxes Plus Property Taxes Plus Book Depreciation Plus Deferred Taxes Plus RR Gross Up for Income Tax Less AFUDC Less AFUDC RR Gross Up for Income Tax Less Other Revenues Less Wind Production Tax Credit Less Wind PTC Gross up for Income Tax Less Investment Tax Credit (INPUT) Less ITC RR Gross up for Income Tax Total Income Statement Expense
37 38
Total Current Tax Expense Tax Depr, Removal, CPI & Other
39
MN Jurisdictional Revenue Requirement
2.98% 5.86% 8.84% 40.87% 41.37% 35.00% 9.80% 0.705611462
2.87% 5.70% 8.57% 40.87% 41.37% 35.00% 9.80% 0.705611462
2.87% 5.70% 8.57% 40.87% 41.37% 35.00% 9.80% 0.705611462
2.87% 5.70% 8.57% 40.87% 41.37% 35.00% 9.80% 0.705611462
2.87% 5.70% 8.57% 40.87% 41.37% 35.00% 9.80% 0.705611462
2.87% 5.70% 8.57% 40.87% 41.37% 35.00% 9.80% 0.705611462
2010 663,207 11,195,220 5,651,308 1,030,171 132,906 5,309,854
2011 632,213 12,078,797 5,974,266 1,194,505 135,122 5,677,362
2012 693,038 12,805,455 6,347,507 1,322,616 173,175 6,001,545
2013 936,763 13,583,746 6,790,248 1,398,985 187,825 6,519,101
2014 1,174,227 14,492,779 7,265,367 1,450,411 174,651 7,125,878
2015 1,044,405 15,772,382 7,725,453 1,498,262 174,651 7,767,723
158,234 311,157 469,391
162,940 323,610 486,550
172,244 342,088 514,332
187,098 371,589 558,687
204,513 406,175 610,688
222,934 442,760 665,694
2,354,862 37,829 27,043 99,595 289,041 168,326 59,904 47,522 33,532 620,739 7,135 5,035 104 73 2,322,460
2,362,041 16,068 26,491 110,124 315,716 156,757 79,948 53,988 38,095 622,571 19,482 13,747 0 0 2,319,263
2,478,413 24,512 27,145 119,039 344,423 90,790 163,044 47,517 33,529 692,572 22,270 15,714 0 0 2,435,764
2,638,880 19,327 28,367 117,367 385,752 71,975 216,964 69,771 49,231 779,978 21,520 15,185 0 0 2,542,946
2,738,217 21,038 29,643 130,673 411,823 53,233 275,028 81,475 57,490 842,944 21,506 15,175 0 0 2,641,066
2,906,925 19,356 30,977 137,369 439,242 67,084 294,437 103,500 73,031 875,657 21,506 15,175 0 0 2,806,522
14,203 683,628
8,625 682,779
91,531 546,234
131,028 521,832
180,857 481,458
184,725 531,808
2,791,852
2,805,813
2,950,096
3,101,633
3,251,753
3,472,216
Northern States Power Company, a Minnesota corporation 2010 - 2015 Pre-Existing Loss Determination
Docket No. E002/GR-10-971 Exhibit___(JCR-1), Schedule 4 Page 2 of 4
2,805,813 (0)
2,950,097 (1)
0
0
0
0
0
0
Impact on Deferred Tax Impact on Rate Base Impact On Debt Return Impact on Equity Return
0 0 0 0
0 0 0 0
0 0 0 0
0 0 0 0
0 0 0 0
0 0 0 0
11 12
Impact on Current Tax New Bonus Impact on Revenue Requirements
0 0
0 0
0 0
0 0
0 0
0 0
13
Current Taxes After Bonus
14,203
8,625
91,531
131,028
180,857
184,725
14 15 16
NOL & Credit Carry-Forward Unused PTC Credits Unused PTC Credit RR Gross Up for Income Tax
(7,135) (5,035)
(6,342) (4,475)
13,478 9,510
0 0
0 0
0 0
17
Current Tax After Unused Credits
26,372
19,442
68,543
131,028
180,857
184,725
18
NOL Carry-Forward (Unused Deductions)
(37,605)
37,605
0
0
0
0
19 20 21 22
Impact on Deferred Tax Impact on Rate Base Impact On Debt Return Impact on Equity Return
(22,503) 11,252 335 659
9,026 17,990 516 1,025
13,478 6,739 193 384
0 0 0 0
0 0 0 0
0 0 0 0
23 24 25 26
Impact on Current Tax Total Current Tax Expense Total Current Tax Expense (Excl ITC) Rev Req Impact of Loss & Credit Carryforward
11,121 37,316 37,494 1,783
(19,442) (0) (0) 1,943
9,781 78,324 78,324 849
0 131,028 131,028 0
0 180,857 180,857 0
0 184,725 184,725 0
27
Net Revenue Requirement Impact
1,783
1,943
849
0
0
0
28 29 30 31
EOY Unused Deduction Balance Tax Effect of Deduction Balance EOY Unused Credit Balance Total (EOY Rate Base)
37,605 15,368 7,135 22,503
0 0 13,478 13,478
0 0 0 0
0 0 0 0
0 0 0 0
0 0 0 0
32
Total Revenue Requirements
2,793,634
2,807,755
2,950,945
3,101,633
3,251,753
3,472,216
1 2 3 4 5 6
Additional Bonus Production Transmission Distribution Common & General Total Net Change
7 8 9 10
Northern States Power Company, a Minnesota corporation 2010 - 2015 Pre-Existing Loss Determination
1
Revenue Requirement Validation
2 3 4 5 6 7 8 9 10 11
Rate Base CWIP Plant In-Service Book Depreciation Reserve Accum Deferred Liability Accum Deferred Liability (Bonus) Accum Deferred Asset (NOL) Accum Deferred Asset (PTCs) Other Rate Base Total Rate Base
12 13
Debt Return Equity Return
Docket No. E002/GR-10-971 Exhibit___(JCR-1), Schedule 4 Page 3 of 4
2,793,634 0
2,807,755 0
2,950,945 0
3,101,633 0
3,251,753 0
3,472,216 0
2010 663,207 11,195,220 (5,651,308) (1,030,171) 0 7,684 3,568 132,906 5,321,106
2011 632,213 12,078,797 (5,974,266) (1,194,505) 0 7,684 10,306 135,122 5,695,352
2012 693,038 12,805,455 (6,347,507) (1,322,616) 0 0 6,739 173,175 6,008,284
2013 936,763 13,583,746 (6,790,248) (1,398,985) 0 0 0 187,825 6,519,101
2014 1,174,227 14,492,779 (7,265,367) (1,450,411) 0 0 0 174,651 7,125,878
2015 1,044,405 15,772,382 (7,725,453) (1,498,262) 0 0 0 174,651 7,767,723
158,569 311,817
163,457 324,635
172,438 342,472
187,098 371,589
204,513 406,175
222,934 442,760
Northern States Power Company, a Minnesota corporation 2010 - 2015 Pre-Existing Loss Determination
Docket No. E002/GR-10-971 Exhibit___(JCR-1), Schedule 4 Page 4 of 4
2010 1
Total Revenues
2
Expenses
3 4 5 6 7 8 9 10 11 12 13 14 15 16 17 18 19 20 21 22 23 24 25 26 27 28 29 30
2011
2012
2013
2014
2015
2,703,181
2,807,755
2,861,972
3,101,633
3,251,753
3,472,216
Plus Operating Expense Plus Amortization Expense Plus Payroll & Other Taxes Plus Property Taxes Plus Book Depreciation Plus Deferred Taxes Less Other Revenues Calculate Taxable Income and Federal & State Taxes Total Revenues (Model Revenue Requirements) Tax Depreciation, Removal & CPI Bonus Tax Depr NOL Carryforward (Unused Deductions) CPI Tax Income Removal Expense Debt Return Amortization Expense Operating Expenses Payroll & Other Taxes Property Taxes Plus Other Revenues Total Taxable Income State Taxes Federal Taxable Income Federal Taxes Total State & Federal Taxes Tax Credits Credit Carryforward Net State & Federal Taxes (Equals ITC)
2,354,862 37,829 27,043 99,595 289,041 145,823 620,739
2,362,041 16,068 26,491 110,124 315,716 165,783 622,571
2,478,413 24,512 27,145 119,039 344,423 104,268 692,572
2,638,880 19,327 28,367 117,367 385,752 71,975 779,978
2,738,217 21,038 29,643 130,673 411,823 53,233 842,944
2,906,925 19,356 30,977 137,369 439,242 67,084 875,657
2,703,181 683,628 (37,605) 158,569 37,829 2,354,862 27,043 99,595 620,739 (0) (0) (0) (0) (0) 7,239 (7,135) (104)
2,807,755 682,779 37,605 163,457 16,068 2,362,041 26,491 110,124 622,571 31,762 3,113 28,649 10,027 13,140 19,482 (6,342) (0)
2,861,972 546,234 172,438 24,512 2,478,413 27,145 119,039 692,572 186,764 18,303 168,461 58,961 77,264 22,270 13,478 41,516
3,101,633 521,832 187,098 19,327 2,638,880 28,367 117,367 779,978 368,740 36,137 332,604 116,411 152,548 21,520 131,028
3,251,753 481,458 204,513 21,038 2,738,217 29,643 130,673 842,944 489,155 47,937 441,217 154,426 202,363 21,506 180,857
3,472,216 531,808 222,934 19,356 2,906,925 30,977 137,369 875,657 498,503 48,853 449,650 157,377 206,231 21,506 184,725
31
Total Expenses
2,333,350
2,373,652
2,446,744
2,612,717
2,722,541
2,910,023
32
Operating Income
369,831
434,104
415,228
488,916
529,212
562,193
33
AFUDC
47,522
53,988
47,517
69,771
81,475
103,500
34
Net Operating Income
417,353
488,092
462,745
558,687
610,688
665,694
35 36 37 38 39
Required Operating Income (Rate Base x Required Return) Operating Income Deficiency (Required Operating Income less Operating Income) Revenue Conversion Factor (1/(1-t))
470,386
488,092
514,910
558,687
610,688
665,694
40
Revenue Deficiency COSS Revenue Deficiency Net Change
41 42
53,033
-
52,165
-
-
-
1.705611462
1.705611462
1.705611462
1.705611462
1.705611462
1.705611462
90,453 88,670
0
88,972 88,124
0
0
0
$1,783
1,943
$849
0
0
0
Northern States Power Company, a Minnesota corporation 2010 - 2015 Revenue Requirement Impact of Bonus Loss Carry-Forward
Docket No. E002/GR-10-971 Exhibit___(JCR-1), Schedule 5 Page 1 of 4
2010 - 2015 Revenue Requirement Impact of Bonus & Loss Carry-Forward 1 2 3 4 5 6 7 8 9 10 11 12 13 14 15 16 17
Input Assumptions Weighted Cost of Debt Weighted Cost of Equity Composite Cost of Capital Composite Tax Rate Current Tax Rate Federal Tax Rate State Rate Income Tax GrossUp Factor Current COSS MN Jur Revenue Requirement Rate Base Plus CWIP Balance Plus Plant In-Service Less Book Depreciation Reserve Less Accum Deferred Taxes Plus Other Rate Base Average Rate Base (BOY/EOY)
18 19 20 21 22 23 24 25 26 27 28 29 30 31 32 33 34 35 36
Plus Debt Return Plus Equity Return Total Return Income Statement Plus Operating Expense Plus Amortization Expense Plus Payroll & Other Taxes Plus Property Taxes Plus Book Depreciation Plus Deferred Taxes Plus RR Gross Up for Income Tax Less AFUDC Less AFUDC RR Gross Up for Income Tax Less Other Revenues Less Wind Production Tax Credit Less Wind PTC Gross up for Income Tax Less Investment Tax Credit (INPUT) Less ITC RR Gross up for Income Tax Total Income Statement Expense
37 38
Total Current Tax Expense Tax Depr, Removal, CPI & Other
39
MN Jurisdictional Revenue Requirement
2.98% 5.86% 8.84% 40.87% 41.37% 35.00% 9.80% 0.705611462
2.87% 5.70% 8.57% 40.87% 41.37% 35.00% 9.80% 0.705611462
2.87% 5.70% 8.57% 40.87% 41.37% 35.00% 9.80% 0.705611462
2.87% 5.70% 8.57% 40.87% 41.37% 35.00% 9.80% 0.705611462
2.87% 5.70% 8.57% 40.87% 41.37% 35.00% 9.80% 0.705611462
2.87% 5.70% 8.57% 40.87% 41.37% 35.00% 9.80% 0.705611462
2010 663,207 11,195,220 5,651,308 1,018,920 132,906 5,321,106
2011 632,213 12,078,797 5,974,266 1,176,514 135,122 5,695,352
2012 693,038 12,805,455 6,347,507 1,315,878 173,175 6,008,284
2013 936,763 13,583,746 6,790,248 1,398,985 187,825 6,519,101
2014 1,174,227 14,492,779 7,265,367 1,450,411 174,651 7,125,878
2015 1,044,405 15,772,382 7,725,453 1,498,262 174,651 7,767,723
158,569 311,817 470,386
163,457 324,635 488,092
172,438 342,472 514,910
187,098 371,589 558,687
204,513 406,175 610,688
222,934 442,760 665,694
2,354,862 37,829 27,043 99,595 289,041 145,823 71,026 47,522 33,532 620,739 0 0 104 73 2,323,248
2,362,041 16,068 26,491 110,124 315,716 165,783 60,506 53,988 38,095 622,571 13,140 9,272 0 0 2,319,664
2,478,413 24,512 27,145 119,039 344,423 104,268 172,825 47,517 33,529 692,572 35,748 25,224 0 0 2,436,035
2,638,880 19,327 28,367 117,367 385,752 71,975 216,964 69,771 49,231 779,978 21,520 15,185 0 0 2,542,946
2,738,217 21,038 29,643 130,673 411,823 53,233 275,028 81,475 57,490 842,944 21,506 15,175 0 0 2,641,066
2,906,925 19,356 30,977 137,369 439,242 67,084 294,437 103,500 73,031 875,657 21,506 15,175 0 0 2,806,522
37,494 646,022
(0) 720,384
78,324 546,234
131,028 521,832
180,857 481,458
184,725 531,808
2,950,945
3,101,633
3,251,753
3,472,216
2,793,634
2,807,755
Northern States Power Company, a Minnesota corporation 2010 - 2015 Revenue Requirement Impact of Bonus Loss Carry-Forward
Docket No. E002/GR-10-971 Exhibit___(JCR-1), Schedule 5 Page 2 of 4
2,793,634 0 30,531 9,736 4,905 5,333 50,506
2,807,755 0 207,820 77,398 68,105 45,872 399,194
2,950,945 0 258 34,060 33,342 (1,667) 65,994
3,101,633 0 (31,365) 30,706 (6,846) (22,267) (29,771)
3,251,753 0 (39,529) (13,870) (7,571) (13,639) (74,610)
3,472,216 0 (34,394) (12,535) (7,004) (6,426) (60,360)
Impact on Deferred Tax Impact on Rate Base Impact On Debt Return Impact on Equity Return
20,640 (10,320) (308) (605)
163,138 (102,209) (2,933) (5,826)
26,970 (197,263) (5,661) (11,244)
(12,167) (204,665) (5,874) (11,666)
(30,491) (183,336) (5,262) (10,450)
(24,667) (155,757) (4,470) (8,878)
11 12
Impact on Current Tax New Bonus Impact on Revenue Requirements
(21,500) (1,772)
(170,674) (16,296)
(35,470) (25,406)
4,190 (25,516)
23,757 (22,445)
18,921 (19,095)
13
Current Taxes After Bonus
15,994
(170,674)
42,854
135,219
204,614
203,645
14 15 16
NOL & Credit Carry-Forward Unused PTC Credits Unused PTC Credit RR Gross Up for Income Tax
0 0
(13,140) (9,272)
(35,748) (25,224)
15,796 11,146
33,091 23,350
0 0
17
Current Tax After Unused Credits
15,994
(148,263)
103,826
108,276
148,174
203,645
18
NOL Carry-Forward (Unused Deductions)
(50,506)
(367,690)
122,201
295,994
0
0
19 20 21 22
Impact on Deferred Tax Impact on Rate Base Impact On Debt Return Impact on Equity Return
(20,640) 10,320 308 605
(163,403) 102,342 2,937 5,833
14,192 176,947 5,078 10,086
136,760 101,471 2,912 5,784
33,091 16,546 475 943
0 0 0 0
23 24 25 26
Impact on Current Tax Total Current Tax Expense Total Current Tax Expense (Excl ITC) Rev Req Impact of Loss & Credit Carryforward
21,500 37,316 37,494 1,772
148,263 0 0 16,042
(69,096) 34,730 34,730 21,233
(108,276) 0 0 10,237
24,015 172,189 172,189 2,083
0 203,645 203,645 0
27
Net Revenue Requirement Impact
0
(254)
(4,173)
(15,279)
(20,362)
(19,095)
28 29 30 31
EOY Unused Deduction Balance Tax Effect of Deduction Balance EOY Unused Credit Balance Total (EOY Rate Base)
50,506 20,640 0 20,640
418,195 170,904 13,140 184,043
295,994 120,964 48,887 169,851
0 0 33,091 33,091
0 0 0 0
0 0 0 0
32
Total Revenue Requirements
2,793,634
2,807,502
2,946,772
3,086,355
3,231,391
3,453,121
1 2 3 4 5 6
Additional Bonus Production Transmission Distribution Common & General Total Net Change
7 8 9 10
Northern States Power Company, a Minnesota corporation 2010 - 2015 Revenue Requirement Impact of Bonus Loss Carry-Forward
1
Revenue Requirement Validation
2 3 4 5 6 7 8 9 10 11
Rate Base CWIP Plant In-Service Book Depreciation Reserve Accum Deferred Liability Accum Deferred Liability (Bonus) Accum Deferred Asset (NOL) Accum Deferred Asset (PTCs) Other Rate Base Total Rate Base
12 13
Debt Return Equity Return
Docket No. E002/GR-10-971 Exhibit___(JCR-1), Schedule 5 Page 3 of 4
2010 663,207 11,195,220 (5,651,308) (1,018,920) (10,320) 10,320 0 132,906 5,321,106 158,569 311,817
2011 632,213 12,078,797 (5,974,266) (1,176,514) (102,209) 95,772 6,570 135,122 5,695,484 163,460 324,643
2012 693,038 12,805,455 (6,347,507) (1,315,878) (197,263) 145,934 31,014 173,175 5,987,968 171,855 341,314
2013 936,763 13,583,746 (6,790,248) (1,398,985) (204,665) 60,482 40,989 187,825 6,415,908 184,137 365,707
2014 1,174,227 14,492,779 (7,265,367) (1,450,411) (183,336) 0 16,546 174,651 6,959,088 199,726 396,668
2015 1,044,405 15,772,382 (7,725,453) (1,498,262) (155,757) 0 0 174,651 7,611,966 218,463 433,882
Northern States Power Company, a Minnesota corporation 2010 - 2015 Revenue Requirement Impact of Bonus Loss Carry-Forward
Docket No. E002/GR-10-971 Exhibit___(JCR-1), Schedule 5 Page 4 of 4
2010 1
Total Revenues
2
Expenses
3 4 5 6 7 8 9 10 11 12 13 14 15 16 17 18 19 20 21 22 23 24 25 26 27 28 29 30
2011
2012
2013
2014
2015
2,703,181
2,807,502
2,862,821
3,086,355
3,231,391
3,453,121
Plus Operating Expense Plus Amortization Expense Plus Payroll & Other Taxes Plus Property Taxes Plus Book Depreciation Plus Deferred Taxes Less Other Revenues Calculate Taxable Income and Federal & State Taxes Total Revenues (Model Revenue Requirements) Tax Depreciation, Removal & CPI Bonus Tax Depr NOL Carryforward (Unused Deductions) CPI Tax Income Removal Expense Debt Return Amortization Expense Operating Expenses Payroll & Other Taxes Property Taxes Plus Other Revenues Total Taxable Income State Taxes Federal Taxable Income Federal Taxes Total State & Federal Taxes Tax Credits Credit Carryforward Net State & Federal Taxes (Equals ITC)
2,354,862 37,829 27,043 99,595 289,041 145,823 620,739
2,362,041 16,068 26,491 110,124 315,716 165,518 622,571
2,478,413 24,512 27,145 119,039 344,423 145,429 692,572
2,638,880 19,327 28,367 117,367 385,752 196,568 779,978
2,738,217 21,038 29,643 130,673 411,823 55,833 842,944
2,906,925 19,356 30,977 137,369 439,242 42,417 875,657
2,703,181 646,022 50,506 (50,506) 158,569 37,829 2,354,862 27,043 99,595 620,739 (0) (0) (0) (0) (0) 104 (104)
2,807,502 720,384 399,194 (367,690) 163,460 16,068 2,362,041 26,491 110,124 622,571 13,140 (13,140) -
2,862,821 546,234 65,994 122,201 171,855 24,512 2,478,413 27,145 119,039 692,572 0 0 0 0 0 35,748 (35,748) 0
3,086,355 521,832 (29,771) 295,994 184,137 19,327 2,638,880 28,367 117,367 779,978 90,201 8,840 81,361 28,476 37,316 21,520 15,796 0
3,231,391 481,458 (74,610) 199,726 21,038 2,738,217 29,643 130,673 842,944 548,189 53,723 494,467 173,063 226,786 21,506 33,091 172,189
3,453,121 531,808 (60,360) 218,463 19,356 2,906,925 30,977 137,369 875,657 544,238 53,335 490,903 171,816 225,151 21,506 203,645
31
Total Expenses
2,333,350
2,373,387
2,446,389
2,606,283
2,716,473
2,904,276
32
Operating Income
369,831
434,115
416,431
480,072
514,918
548,845
33
AFUDC
47,522
53,988
47,517
69,771
81,475
103,500
34
Net Operating Income
417,353
488,103
463,948
549,843
596,394
652,345
35 36 37 38 39
Required Operating Income (Rate Base x Required Return) Operating Income Deficiency (Required Operating Income less Operating Income) Revenue Conversion Factor (1/(1-t))
470,386
488,103
513,169
549,843
596,394
652,345
40
Revenue Deficiency COSS Revenue Deficiency Net Change
41 42
53,033
-
49,220
-
(0)
-
1.705611462
1.705611462
1.705611462
1.705611462
1.705611462
1.705611462
90,453 90,453
0
83,951 88,124
0
(0)
0
($0)
(254)
($4,173)
(15,279)
(20,362)
(19,095)