TECH REVIEW
An Alternative Method for the Rapid Generation of Stable, High-Expressing Mammalian Cell Lines By GREGORY T. BLECK
B
iopharmaceutical companies are constantly evaluating new methods for mammalian cell line development that offer any of the following benefits: shorter time lines, improved consistency, higher production, better genetic stability, and increased flexibility. Each of these advantages extends a large cost benefit to companies as their recombinant protein products are moved from development into the clinic and finally to commercial launch. A versatile system has been developed that is capable of transferring genes of interest into a wide variety of mammalian host cells and offers a number of the above advantages over other methods. The system, which is referred to as GPEx™ (an acronym for “gene product expression”), utilizes replication-defective retroviral vectors, derived from Moloney murine leukemia virus (MLV) and pseudotyped with vesicular stomatitis virus G protein (VSV-G), to stably insert single copies of genes into dividing cells. Retrovectors deliver genes coded as RNA that, after entering the cell, are reverse transcribed to DNA and integrated stably into the genome of the host cell. Two enzymes, reverse transcriptase and integrase, provided transiently in the vector particle, perform
Figure 1. GPExTM cell line engineering.
Figure 2. Transgene expression construct. Genetic elements are not drawn to scale.
this function. These integrated genes are maintained through subsequent cell divisions as if they were endogenous
cellular genes. By controlling the number of retrovector particles accessing the cell, multiple gene insertion (desir-
Gregory T. Bleck, Ph.D. (
[email protected]), is director, molecular biology and transgenics, Gala Biotech business unit of Cardinal Health, Middleton, WI. www.bioprocessingjournal.com
•
September/October 2005
1
able for high-yielding cell cultures) can be achieved without any of the traditional amplification steps. This article describes the use of the GPEx technology for transferring genes into
Chinese hamster ovary (CHO) cells for the purpose of consistently producing cell lines with high production levels in a short amount of time (Fig. 1).
Features of the Technology
Works on Any Mammalian Cell Line as Well as Other Cell Lines The process utilizes VSV-G as an envelope on the retrovector particles. This envelope protein allows the retrovectors to insert genes into all mammalian cells, in addition to numerous other cell types, due to its ability to bind to various membrane phospholipids and glycolipids.1–3 Each Copy of the Transgene Is Inserted at a Different Genomic Location Retrovector gene insertions occur at unique locations in the cell genome, with a single copy of the gene inserted at each independent site. Unlike most other methods of transgene insertion that are undefined “passive” processes, each insertion by a retrovector is an “active” process that is modulated by the integrase enzyme.4 This unique insertion process eliminates the occurrence of “head-to-tail” multiple-singleloci transgene inserts in these cell lines. Transgene Inserts Into Target “Open” or “Active” Regions of the Cell Genome The MLV retrovectors have been shown to preferentially insert into or around the transcription start point of genes.5,6 This preference for transcriptionally “active” regions of the genome allows for higher, more consistent levels of expression per copy of the gene inserted as compared to other methods of gene insertion.
Figure 3. Retrovector production process.
No Need for Antibiotic Selection or Use of Toxic Compounds for Gene Amplification Due to the extremely high gene insertion efficiency of the GPEx process, no selectable markers (e.g., neomycin, blasticidin, hygromycin, or puromycin resistant genes) are needed for cell line generation. This has a number of advantages over other cell line development methods, including reduced costs for culturing cells, no additional taxing of the cells due to production of the selectable marker, and reduced time to clonal cell line selection. High transduction efficiency and the ability to do repeat cell transductions generate
Figure 4. Cell line development method.
2
BioProcessing Journal
•
September/October 2005
high copy number cell lines using this process, eliminating the need to amplify gene copy number by adding toxic compounds such as methotrexate.
Straightforward Addition of Extra Genes to Cell Pools or Previously Developed Cell Lines The high transduction efficiency, coupled with no antibiotic selection requirement, allows easy addition of one or more genes encoding one or more processing enzymes or modifying proteins to cell lines producing a recombinant protein of interest. For antibodies, heavy (HC) and light chains (LC) are easily titrated to the correct gene ratio to yield maximum antibody production. Gene ratio titering can be accomplished through specific screening during clonal selection or an individual transduction of a specific chain, if required. High-Expressing Cell Population Prior to Clonal Selection Cell pools producing milligram to gram quantities of protein early in the development process (prior to selection of a high-expressing clone) allows for early detailed protein characterization. Having a high-expressing cell pool as a starting point also reduces the number of clones that need to be screened in order to identify high-expressing stable clonal cell lines. The data presented in this article are from a number of GPEx generated CHO cell lines producing various recombinant proteins, antibodies, and Fc fusions. Each of the projects shown below varied due to differences in the initial project plan. Because project plans differed in final expectations/ goals, not all analyses were performed on each cell line. Materials and Methods
Gene Constructs The backbone vector used for all cell line development is shown in Figure 2. Because the system is based on an RNA virus, and gene introns would be removed during retrovector production, only cDNAs are used in the system. The internal promoter controls expression of the transgene, the RESE
element assists with RNA export from the nucleus to the cytoplasm, and the poly-adenylation signal is contained within LTR2. The transgene of interest for each project was cloned into the backbone vector and subsequently used for retrovector production. Each of the genomic inserts generated with the GPEx process contains all genetic elements shown in Figure 2.
Retrovector Production Retrovectors were produced in a human embryonic kidney cell line
(HEK 293) that has been transformed to constitutively express the MLV gag, pro, and pol genes.2 This cell line has been master cell banked and fully characterized in detail. Most importantly, the 293 packaging cell line does not contain the MLV envelope (env) gene or the MLV packaging region such that in the absence of both the transgene construct, which provides the viral RNA packaging region, and an envelope gene, the 293 packaging line produces particles consisting of the required structural elements and enzymes, but these
Table 1. 14-Day T-flask pooled cell line production of various proteins.
Pooled Cell Line
Production (mg/L)
Recombinant Protein 1
35
Recombinant Protein 2
40
Recombinant Protein 3
49
Recombinant Protein 4
54
Antibody A
46
Antibody B
49
Antibody C
56
Antibody D
69
Antibody E
90
Antibody F
99
Antibody G
102
Antibody H
104
Antibody I
171
Antibody J
87
Antibody K
191
Antibody L
95
Antibody M
169
Antibody N
277
Antibody O
87
Antibody P
155
Antibody Q
142
Fc Fusion 1
159
Fc Fusion 2
178
Fc Fusion 3
244
www.bioprocessingjournal.com
•
September/October 2005
3
particles are not active because they lack an envelope and an RNA genome. To create active retrovector particles containing the transgene of interest, a plasmid containing the expression construct (Fig. 2) and a plasmid encoding the VSV-G gene were introduced into the 293 cells via calcium-phosphate transfection.7 The expression construct becomes the RNA genome of the retrovector. The VSV-G envelope causes pseudotyping of the retrovector, allowing the retrovectors to become capable of cell transduction. Expression of the VSV-G gene by the cells is a terminal event resulting in syncytium formation and, ultimately, cell death. However, for a period of about three days, the 293 packaging cell line-transgene constructVSV-G system produces high titers of active retrovector particles (Fig. 3). The high titer retrovector is then concentrated by ultracentrifugation and used for cell transductions.
Cell Culture A master cell bank of the CHOS cell line (Invitrogen, Carlsbad, CA) was the source for all cell line development projects. Cells were cultured in serum-free PFCHO LS medium
(HyClone, Logan, UT) for all described work; however, 2% fetal bovine serum (HyClone) was added to the culture medium for approximately 10–14 days during the limited dilution cloning step. Cells were typically cultured at 37° C and 5% CO2. Cell counts and viabilities were estimated using the Cedex system (Innovatis, Bielefeld, Germany). Fed-batch culture was performed using commercially available supplements (HyClone). All process development was completed with a single round of analysis using generic conditions and commercially available media/supplements (HyClone).
Cell Line Development Cell lines expressing recombinant proteins and antibodies were produced as shown in Figure 4. Transductions were performed at a multiplicity of infection of at least 1,000 retrovector particles per cell. For generating antibody-producing cell lines, an initial transduction of CHO cells was performed using a retrovector containing the LC gene. The LC-expressing pool of cells was then transduced with a retrovector containing the HC gene. Upon completion of a single transduction, or both LC and HC
Table 2. Clonal cell line specific productivities. The reported productivities are an average of the best 3 clones developed for each project. S.D.= Standard Deviation of the top 3 clones.
Protein Product
4
Top 3 Cell Lines Average PCD S.D.
transductions in the case of antibodies, the resulting pool of cells produces functional protein. For most projects, single cell clones were isolated from the pool using limited dilution cloning. Approximately 300–500 clonal lines were screened for production levels and various protein-specific characteristics.
Transgene and mRNA Analysis DNA or RNA was isolated from cells during the log growth phase. A quantitative real-time PCR-based assay was used to estimate the number of gene copies inserted in the cell lines. The MLV packaging region of each gene insert was used as the target sequence to estimate the total number of transgene insertions. The β-1,4-galactosyltransferase-1 gene was used as an endogenous marker gene to control for the amount of genomic DNA in each reaction. The gene index was calculated by subtracting the transgene assay threshold cycle from the control assay threshold cycle. A similar quantitative real-time PCR assay along with a reverse transcription step was used to determine the level of HC and LC mRNA being expressed. A portion of the constant region of the HC and LC was used to determine HC and LC mRNA levels respectively. The glyceraldehyde-3-phosphate dehydrogenase (GAPDH) gene was used as a control mRNA for the CHO cell lines. Isolated RNA was reverse transcribed and three quantitative real-time PCR (HC, LC, control) reactions were run in triplicate. Similar to the assays performed with genomic DNA, a transgene mRNA index value was calculated by subtracting the sample threshold cycle number for either the HC or LC assays from the control GAPDH assay threshold cycle value.
Recombinant Protein 4
27
5
Antibody B
21
2
Antibody C
17
1
Antibody D
30
10
Antibody E
30
1
Antibody F
32
2
Antibody G
16
1
Antibody H
33
4
Antibody I
35
8
Antibody J
24
4
Fc Fusion 1
55
5
Pooled Cell Line Production
Fc Fusion 2
50
4
The ability to produce substantial amounts of protein prior to clonal
BioProcessing Journal
•
September/October 2005
Protein Analysis Protein levels were determined using either ELISA (enzyme-linked immunosorbent assay) or protein A HPLCbased assays specific for each individual protein.
selection is an advantage of this cell line development method. Twenty-four unique cell pools, producing different proteins, were each generated after a single transduction cycle. Cell pools were grown in triplicate T-flasks in 30 ml of media. Culturing was performed in serum- and protein-free PFCHO LS medium for 14 days with no feeds. Final protein titers were estimated by ELISA and are shown in Table 1. Production levels ranged between 35 and 280 mg/L for the various recombinant proteins, antibodies, and Fc fusions. These production levels allow 100 mg to gram quantities to be made from 1- to 10-L production vessels early in the cell line development process.
A
B
Clonal Cell Line Production After completing limited dilution cloning on the pooled cell lines, the top twenty clones were selected based on protein production in 96-well plates. Fourteen-day protein production and specific productivity results from triplicate T150-flasks were then used to narrow the number of clones to the top three to five candidates. Cell lines were seeded at 200,000 cells/ml, and specific productivities of the clones were measured on Day 3 of the static culture. The average specific productivities of the cell lines ranged from 16 to 55 picograms/cell/day (PCD) (Table 2) for the different protein-producing cell lines. These clones were subsequently moved into process development for production analysis under fed-batch culture conditions. Alternatively, for projects requiring faster development times, three-day culture in six-well plates was used to select the top clones to move into process development, so accurate specific productivities were not calculated for those cell lines at this stage in the cell line development process.
C
D
E
Bioreactor Production A single HC and a single LC transduction yield antibody-producing cell lines that consistently reach 0.7 to 1.2 g/L in a generic fed-batch stirred tank bioreactor process using commercially available media and supplements.
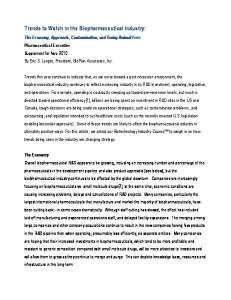
Figure 5. Bioreactor production run analysis for different cell lines. A) 2L bioreactor run of an Antibody M cell line (maximum cell density = 3.0 million cells/ml). B) 10L run of an Antibody C cell line (maximum cell density = 4.4 million cells/ml). C) 10L run of an Antibody K cell line (cell line was isolated from the LC/HC Transduction 3 pool; Maximum cell density = 1.4 million cells/ml). D) 100L run of an Antibody B cell line (maximum cell density = 2.4 million cells/ml). E) 200L run of the same Antibody B cell line (maximum cell density = 2.1 million cells/ml).
www.bioprocessingjournal.com
•
September/October 2005
5
Final production cell lines developed for four different antibodies were run under these conditions in various sizes of stirred tank bioreactors. Titer and cell counts were determined throughout the culture. Specific productivities were calculated by plotting antibody titer versus integral viable cell concentration (IVCC) with the slope of the line representing the productivity in PCD (Fig. 5).
Productivities for the runs ranged from 19 to 48 PCD for the individual lines. Maximum cell densities for the cultures ranged from 1.4 to 4.4 million cells/ml for the different runs. Clonal Cell Line Stability Genetic and expression stability are important metrics used to evaluate any
Figure 6. Total transgene estimates before and after 60 generations in culture for 7 different antibody-producing cell lines.
A
new cell line development method. The expanding use of real-time PCR for evaluating cell lines has made this analysis much more quantitative and easier to perform. In this study, final production cell lines expressing seven different antibodies were analyzed for their stability. A research cell bank for each cell line was designated as generation 0 for the purpose of the study. Cells were continuously cultured by serial passage from generation 0 to approximately generation 60. At the end of the experiment, samples of cells from generation 0 and generation 60 were used for DNA and RNA isolation. Real-time PCR analysis of the DNA showed no significant difference between the number of transgenes at generation 0 and generation 60 for any of the lines (Fig. 6). Both HC and LC mRNA levels were also estimated at the two time points for each of the cell lines. Again, there was no significant difference in either HC or LC chain mRNA levels over the extended culture (Fig. 7). For cell lines produced with amplification-type methods, a specific reduction in the amount of LC mRNA over extended culture has been observed as well as dramatic decreases in the number of transgene copies present and subsequent mRNA levels when no selection pressure was applied. In addition, major stability differences between clones have been observed.8–10 Cell Line Re-Transduction
B
Figure 7. Antibody light- and heavy-chain transgene mRNA expression before and after 60 generations in culture for 7 different cell lines. A) Light chain mRNA expression. B) Heavy chain mRNA expression.
6
BioProcessing Journal
•
September/October 2005
For some proteins, a single transduction cycle appears to achieve a cell line with maximal genetic potential and adding additional gene copies does not improve cell line production. However, with other cell lines, adding more gene copies via repeated transductions does improve the cell line productivity. A multiple transduction experiment was run using the Antibody K retrovector. Four successive cycles of an LC transduction followed by an HC transduction were completed on a pool of cells. After each cycle, a portion of the cell pool was used for limited dilution cloning and clonal selection as described previously. A sample of the
REFERENCES Table 3. Gene index of the pooled Antibody K cell line after each transduction cycle.
Pooled Cell Line
Gene Index
LC/HC Transduction 1
4.93
LC/HC Transduction 2
7.20
LC/HC Transduction 3
7.93
LC/HC Transduction 4
8.53
Table 4. 14-Day fed-batch T-flask production of the top Antibody K clone isolated from each transduction cycle pool.
Clonal Cell Line
Protein (mg/L)
LC/HC Transduction 1
914
LC/HC Transduction 2
1028
LC/HC Transduction 3
1376
LC/HC Transduction 4
1640
cells was also taken for analysis of the transgene number. Average gene copy indexes for the cell pool after each cycle are shown in Table 3. The highest producing clone isolated from each of the four transduction cycles was analyzed for antibody production in generic fedbatch conditions. Cells were cultured under static conditions in triplicate T150 flasks for 14 days. Final titers of the cultures were compared (Table 4). In the case of Antibody K, repeated transductions not only increased the number of transgene inserts, it improved the production levels of the cell clones. Conclusions The GPEx method of cell line engineering is an extremely flexible, fast, and consistent process that has distinct advantages over other cell line development methods. The examples shown in Table 1 demonstrate that large quantities of recombinant protein can be produced from pooled cell lines as a step on the path to clonal cell line development. This eliminates the need for sep-
arate, large-scale transient transfection experiments for producing initial protein for testing and greatly streamlines the cell line engineering timeline. The lack of an antibiotic selection step and high transduction efficiency allows a master cell bank candidate cell line to be produced 12 weeks after the start of a project. For antibodies, these cell lines consistently produce 0.7–1.2 g/L in bioreactors using generic fed-batch reactor conditions, and productivities in excess of 2 g/L have been achieved with additional process development. The consistent genetic stability of these cell lines is unique when compared to other cell line development methods that result in multiple copy gene inserts. Finally, the ease with which genes can be added and titrated into cells permits the genetic potential of each individual cell line to be fully maximized.
1. Schlegel R, Tralka TS, Willingham MC et al. Inhibition of VSV binding and infectivity by phosphatidylserine: Is phosphatidylserine a VSV-binding site? Cell 1983;32:639–646. 2. Burns JC, Friedmann T, Driever W et al. Vesicular stomatitis virus G glycoprotein-pseudotyped retroviral vectors: Concentration to a very high titer and efficient gene transfer into mammalian and nonmammalian cells. Proc Natl Acad Sci USA 1993;90:8033–8037. 3. Yee JK, Friedmann T, Burns JC. Generation of hightiter pseudotyped retroviral vectors with very broad host range. Meth Cell Biol 1994;43:99–112. 4. Andrake MD, Skalka AM. Retroviral integrase, putting the pieces together. J Biol Chem 1996;271(33):19633– 19636. 5. Wu X, Li Y, Crise B, Burgess SM. Transcription start regions in the human genome are favored targets for MLV integration. Science 2003;300:1749–1751. 6. Mitchell RS, Beitzel BF, Schroder ARW et al. Retroviral DNA integration: ASLV, HIV and MLV show distinct target site preferences. PLOS Biology 2004;2(8):1127–1137. 7. Ausubel FM, Brent R, Kingston RE et al. Transient transfection methods for preparation of high-titer retroviral supernatants. In: Current Protocols in Molecular Biology, Vol. 2. New York; John Wiley & Sons, Inc.: 1996. p 9.11.1–9.11.18. 8. Strutzenberger K, Borth N, Kunert R et al. Changes during subclone development and ageing of human antibody-producing recombinant CHO cells. J Biotech 1999;69:215–226. 9. Kim NS, Kim SJ, Lee GM. Clonal variability within dihydrofolate reductase-mediated gene amplified Chinese hamster ovary cells: stability in the absence of selection pressure. Biotech Bioeng 1998;60(6):679– 688. 10. Barnes LM, Bentley CM, Dickson AJ. Molecular definition of predictive indicators of stable protein expression in recombinant NS0 myeloma cells. Biotech Bioeng 2004;85(2):115–121.
ACKNOWLEDGMENTS The author wishes to thank Jennifer Franklin, Dr. Dona York, Dr. Ian Collins, and Dr. Paul Weiss for their help with manuscript preparation.
www.bioprocessingjournal.com
•
September/October 2005
7