Biometric measurements of the eyes in teenagers and young adults with Down syndrome Olav H. Haugen1, Gunnar Høvding1 and Geir Egil Eide2,3 Department of Ophthalmology1 and Centre for Clinical Research, Haukeland University Hospital2, and Section for Medical Statistics, University of Bergen3, Bergen, Norway
ABSTRACT. Purpose: To examine ocular biometric variables in subjects with Down syndrome. Methods: In a population-based study we have compared ocular biometric variables in a group of 47 individuals with Down syndrome (20.0∫3.9 years) with 51 control subjects (21.0∫4.6 years). Results: A thinner cornea (0.48∫0.04 mm vs. 0.55∫0.03 mm, p∞0.001) and higher keratometry values (46.39∫1.95 D vs. 43.41∫1.40 D, p∞0.001) were found in the Down syndrome group than in the control group. Oblique astigmatism was commonly found in the Down syndrome individuals, showing a strong right-left specificity (right eyes’ axes in the 135æ-meridian, left eyes’ axes in the 45æ-meridian). The lens was thinner (3.27∫0.29 mm vs. 3.49∫0.20 mm) and the calculated lens power was weaker (17.70∫2.36 D vs. 19.48∫1.24 D) in the Down syndrome group than in the control group (p∞0.001 in both cases). Conclusions: Thinning of the corneal stroma may account for the steeper cornea and the high frequency of astigmatism in Down syndrome due to lower corneal rigidity. It may also be of etiological importance to the increased incidence of keratoconus in Down syndrome. Key words: Corneal thinning – Down syndrome – keratoconus – keratometry – ocular biometry – refractive error – Scheimpflug photography. Acta Ophthalmol. Scand. 2001: 79: 616–625 Copyright c Acta Ophthalmol Scand 2001. ISSN 1395-3907
I
t has long been well documented that refractive errors are frequently encountered in individuals with Down syndrome (Oliver 1891; Lowe 1949; Gardiner 1967; Woodhouse et al. 1997). A feature that Woodhouse et al. (1997) have drawn attention to, is a failing emmetropization, giving a persisting wide distribution of refractive values in childhood and adult life compared to a normal population. However, there is little information in the literature about the individual optical components of the eye in Down syndrome. In a study on teenagers with Down syndrome, Doyle and coworkers (1998) showed that axial length correlated with spherical equivalent. However, apart from this study, little is known
616
about the individual biometric variables in the eyes of Down syndrome patients. The aims of the present investigation were to examine the individual optical components of the eye in young adults with Down syndrome, and to investigate possible correlations between these elements, as well as their relative impact on the total refraction of the eye. To our knowledge, this study is the first to provide such data on individuals with Down syndrome.
Material and Methods All patients with Down syndrome born 1974–1986 in Hordaland County, Nor-
way (416,000 inhabitants, 6,000 annual births), were identified from the files of the regional Laboratory for Cytogenetics. This laboratory performs all chromosomal analyses on patients from Hordaland County and the neighbouring counties. From these files we found 65 Down syndrome patients born in this period who survived the neonatal period. There was one case of translocation and one with mosaic; all the other 63 patients had a trisomy 21. Eleven had died. The 54 patients still alive were invited to an eye examination, which 47 (30 males, 17 females) attended (87%). Among these was the one case of translocation mentioned above, while the others were ordinary trisomy 21 cases. The mean age of the study group was 20.0∫3.9 years (range 14–26). All the Down syndrome patients were Caucasian. Two patients had previously undergone uncomplicated cataract extraction and intraocular lens implantation in both eyes. Their data on retinoscopy and anterior chamber depth were excluded from the study, but central corneal thickness measurements were included as well as preoperative keratometry and axial length measurements obtained from their cataract surgery records. In order to compare the results with those of a normal population, an agematched control group was examined. Our intention was originally to perform individual matching on age and gender, randomly drawn from the public register of Bergen City for each subject in the study. This was done, and the matched control subjects were invited by letter to an eye examination. However, this strategy posed unexpected difficulties, as the majority of the invited individuals did
not meet for examination, especially in the older half of the age group. Thus, in spite of numerous invitation letters, we only succeeded in recruiting 20 control subjects this way (mean age 16.5∫3.2 years, range 14–25). In order to get on with the study, we therefore decided to change strategy and recruit control subjects with birth year from 1974 and later from medical students (nΩ17) and student nurses (nΩ14) at our hospital. In the end, the control group thus consisted of 51 individuals (17 males, 34 females), with a mean age of 21.0∫4.6 years (range 14–29). All control subjects were Caucasian. The study conformed to the Declaration of Helsinki for research involving human subjects. Informed consent was obtained from the patients and their parents, and from the controls, and the study was approved by the Regional Committee for Medical Research Ethics and the Norwegian Data Inspectorate. The examination of the patients and the controls included visual acuity with habitual correction, refractive state, accommodation, keratometry, corneal topography, central corneal thickness, anterior chamber depth, anterior surface lens curvature, central lens thickness, lens density, and axial length. In addition, an ordinary slit lamp examination and ophthalmoscopy were carried out. When comparing biometric data between the study group and the control group, only right eye measurements were taken into account. Concerning corneal astigmatism, difference in direction of axis between right and left eye was an important aspect, and data from both eyes were thus considered. Because keratoconus was regarded as a pathological condition of the cornea and not a part of the regular variation, the data on refraction, keratometry (and corneal astigmatism), corneal thickness, and anterior chamber depth are presented both including and excluding the keratoconus subjects. Visual acuity was examined with either Snellen’s chart or Østerberg’s picture chart. Corneal curvature (mean values and corneal astigmatism) was measured with a hand-held Nidek autokeratometer KM-500, and corneal topography was analyzed with a TechnoMed C-Scan V2.0.0. A Nidek Model EAS-1000 anterior eye segment analysis system was used to measure central corneal thickness, anterior chamber depth, central lens thickness, anterior lens surface curvature, and
axial density of the lens. This instrument is a Scheimpflug camera with a computer image analyzer, equipped with special analysis programs. Among these, there are programs designed to assess biometrical data of the anterior segment (’’Axial biometry’’) and lens density data (’’Axial densitometry’’). In the biometry program, a central optical axis line of the anterior eye segment is automatically constructed from the central corneal curvature. Markers are then automatically placed by the computer at the intersecting points between the axis and the anterior and posterior surface of the cornea and the anterior surface of the crystalline lens. The placing of the markers may be adjusted manually if the examiner is not satisfied with the automatic place-
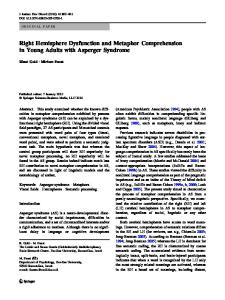
ment. The marker of the intersecting point at the posterior lens surface must always be placed manually, after which the biometrical data (corneal thickness, anterior chamber depth and lens thickness) appear on the screen (Fig. 1). Anterior lens curvature is found by manually placing three points along the anterior surface of the lens. Because of the non-touch approach, the Nidek EAS1000 system appears particularly well suited for biometrical measurements in Down syndrome individuals. The instrument has been validated concerning accuracy and reproducibility (Baez et al. 1992; Sakamoto et al. 1992; Sakamoto & Sasaki 1994). However, due to limitations in image resolution (1 pixel equals about 20 m), our study also included central cor-
Fig. 1. Scheimpflug images from the anterior segment of a young adult with Down syndrome (A) and a normal control subject (B).
617
neal thickness measurements using an ultrasound BVI Biovision Pocket Pachymeter in 38 eyes (24 from Down patients, 14 from controls). The data obtained by the two different methods were compared as suggested by Bland and Altman (1986). Lens density was examined in the ‘‘Axial densitometry’’ program, as the computer automatically chose a point just in front of the anterior lens capsule (defined as densityΩ0) and compared the different locations in the lens to this reference point. Lens density was thus measured in the center of the lens, 1 mm anterior and posterior to the center and in the anterior and posterior cortex. When placing the marker, care was taken to avoid areas of dense cataract, and values above 100 units were omitted from the results. All the Scheimpflug pictures were taken 30 minutes after administration of cyclopentolate 1% eye drops. The refractive state was assessed using retinoscopy in cycloplegia (cyclopentolate 1%). In the Down syndrome patients, both eyes were examined for refractive errors, while in the normal controls, only right eyes were examined. Clinically significant astigmatism was defined as a cylindrical power Ø1.0 D. By convention, all cylinders were given as minus cylinders. The axis of astigmatism was classified as follows: 0–15æ or 165– 180æ (‘‘180æ-meridian’’), 16 – 74æ (‘‘45æmeridian’’), 75–105æ (‘‘90æ-meridian’’), and 106–164æ (‘‘135æ-meridian’’). The accommodative response was evaluated with a simplified modification of dynamic retinoscopy. The patient should wear his/her distant glass correction. Sitting at a fixed distance of about 50 cm in front of the patient, the examiner observed the retinoscopic reflex movement while the patient looked straight ahead (principally at a distant object behind the observer) with both eyes open. A small picture that attracts interest (Lang’s cube) was then introduced 20–30 cm in front of the patient. In order to ensure fixation at the object, the patient was constantly encouraged to fixate the near target, as the examiner was asking questions about details of the picture. If normal accommodation was present, the examiner observed a very distinct shift from ‘‘with’’-movements to ‘‘against’’-movements. Such a response was classified as ‘‘normal’’. If, when presenting the accommodative target, this change did not take place in spite of a cooperative patient, the accommodation response was assessed as ‘‘weak’’.
618
The axial length of the right eye was measured with a BVI Biovision B-Scan-S apparatus, with the probe mounted on a tonometer device. This apparatus automatically performs ten measurements and displays the mean value. From axial length and keratometry we calculated the axial length/corneal radius (AL/CR) ratio. Corneal radius (r) was computed from the keratometry (k) value (rΩ0.3375/k). In those cases in which spherical equivalent (SE), keratometry (K), anterior chamber depth (ACD) and axial length (AL) could be measured, lens power was calculated. Using ordinary corrected vergence calculations, lens power (LP) in diopters may be found by the formula:
LP Ω n
冢
1 ª AL–ACD
1 n ª ACD KπSE
冣
where n is the refractive index of the aqueous and the vitreous (nΩ1.336) and axial length and anterior chamber depth are given in meters. This formula calculates the lens power, provided that the refraction of the whole lens takes place at the anterior lens surface (anterior vertex). For this reason the calculated value will be approximately 3 diopters less than the true value. From the radius of the anterior lens surface curvature, the dioptric power of the anterior lens surface was calulated, assuming naΩ1.336 and nlΩ1.42 as refractive indices of the aqueous and the lens, respectively. The cooperation of the Down syndrome patients was scored on a scale from 1 (very poor) to 4 (excellent). All the examinations and measurement procedures in the patients and controls were performed by one of the authors (OHH). As we had to abandon the one-to-one matching, paired statistical tests were not applied. Student’s t-test was used to compare the continuous variables, as they all seemed to approximate a normal distribution. Categorical variables were compared using the c2-test or Fisher’s exact test. In order to compare the data on individual biometric variables of the eye while controlling the effect of age and gender, multiple linear regression analysis was used. In addition, the impact of the individual optical elements on total refraction (spherical equivalent) was also studied in a forward stepwise multiple linear regression analysis. The measured
variables keratometry, axial length, anterior chamber depth, anterior lens surface curvature, central lens thickness, and central corneal thickness were candidates as explanatory variables in the model together with diagnosis, age, and gender. In addition, the product of diagnosis (normal controlΩ0, Down syndromeΩ1) and those explanatory variables that were statistically significant in the first part of the analysis, were then subsequently entered into the model. This was done in order to study potential differences between the Down group and the control group on how these explanatory variables influenced spherical equivalent (response variable). The correlation between axial length/corneal radius ratio and spherical equivalent was also studied with regression analysis. All the regression analyses on biometric variables and spherical equivalent were performed while excluding the keratoconus patients. A significance level of 0.05 was chosen for all statistical tests. The data were statistically analyzed using the SPSS for Windows 9.0 program (1999). In the presentation of the results, mean values are given together with standard deviation (mean∫SD). As the analyses showed that the biometric measurements obtained in the patients with translocation did not differ significantly from those obtained in the trisomy 21 patients, the results are presented together as one group.
Results Cooperation Twenty-six (55%) of the Down patients cooperated excellently (4 at the score scale) at the examination. Adding those 13 who cooperated well (3 at the scale), this comprised 83% of the whole study group. Four patients showed some degree of cooperation (2), while the last four patients had a very poor ability to cooperate (1). Visual acuity Forty-three patients with Down syndrome cooperated sufficiently for visual acuity testing, 39 monocularly and four binocularly. Thirty-two could be tested with Snellen’s chart, while 11 had to be examined with the Østerberg chart. In four patients, it was impossible to test for visual acuity. Visual acuity in the best eye was Ø0.5 in 28 patients, between 0.25 and 0.4 in 13 patients and between 0.2 and 0.1
Fig. 3. Distribution of spherical equivalent refractive values in young adults with Down syndrome (filled bars, nΩ46) and age-matched, normal controls (open bars, nΩ51).
Fig. 2. Keratometry measurements from Down syndrome individuals (filled circles) and normal controls (open circles). Upper graph (A) shows a scatter plot of data from Nidek autokeratometer vs. Technomed C-Scan topography, while the lower graph (B) shows the agreement between the two methods.
in the last two patients. All the normal controls except two had a visual acuity of 1.0 or better in both eyes. One had visual acuity of 0.67 in both eyes, probably due to a meridional amblyopia (astigmatism of ª3 D in both eyes), while the other had a slight, unilateral amblyopia (0.67) due to anisometropia. Corneal topography Corneal topography measurements could be performed on 39 of the patients with Down syndrome. The results showed that four of these patients had keratoconus. In addition, keratoconus was diagnosed by clearly irregular retinoscopic reflexes in one patient who did not cooperate sufficiently for corneal topography. Four of
Fig. 4. Axis of total astigmatism Ø1.0 D in 60 eyes from patients with Down syndrome.
these five cases were bilateral. The corneal topography also revealed that one of the normal controls had a bilateral, incipient keratoconus, not previously diagnosed. Corneal curvature measurements (central 3 mm diameter) from the corneal topography C-scan correlated closely to the measurements from the Nidek keratometer KM-500, (Figs 2A and B). Refractive errors Spherical equivalent Retinoscopy in cycloplegia could be carried out in forty-six patients with Down syndrome. Figure 3 shows the distribution of the spherical equivalent of the right eye in the Down syndrome patients
and in normal controls. The Down syndrome patients had a wider distribution of refractive errors than the normal controls, especially in the hypermetropic direction, but also towards high myopic values. In Table 1 mean values, standard deviation, and range for spherical equivalent refraction for the Down syndrome group and the controls are given. No difference was found in mean spherical equivalent between the two groups. In the control group, 17 (33%) had glasses or contact lenses due to myopia, while two had a correction for hypermetropia. The myopic controls were evenly distributed among those randomly recruited (7 out of 20), medical students (6 out of 17) and nurse students (4 out of 14).
619
Table 1. Ocular biometric data in Down syndrome patients and normal controls; right eyes. Down syndrome n Spherical equivalent (D) Keratometry (D) Corneal thickness (mm) Corneal astigmatism (D) Anterior chamber depth (mm) Anterior lens surface curvature (mm) Lens thickness (mm) Axial length (mm) Calculated anterior lens surface power (D) Calculated total lens power (D) Axial length/corneal radius (AL/CR) ratio
46 41 41 41 40 38 40 37 38 34 36
Mean ª0.60 46.39 0.48 2.00 3.45 15.12 3.27 22.44 5.64 17.70 3.09
Controls (nΩ51)
SD
Range
4.35 1.95 0.04 1.59 0.34 2.63 0.29 1.42 0.91 2.36 0.18
ª13.50–π5.50 43.00–51.25 0.40–0.57 0.25–7.25 2.87–4.15 10.97–22.02 2.69–4.12 19.42–25.47 3.77–7.57 13.25–26.13 2.83–3.70
Mean ª0.84 43.41 0.55 0.82 3.40 14.65 3.49 23.31 5.71 19.48 3.00
SD
Range
p-value1
2.07 1.40 0.03 0.55 0.23 1.29 0.20 1.01 0.49 1.24 0.13
ª6.00–π3.75 39.75–46.50 0.49–0.64 0.00–2.75 2.83–3.87 12.14–18.18 3.13–4.09 21.68–25.83 4.57–6.84 16.22–21.67 2.75–3.32
⬍0.001 ⬍0.001 ⬍0.001 0.440 0.314 ⬍0.001 0.002 0.681 ⬍0.001 0.014
SDΩstandard deviation. 1 Student’s t-test.
Astigmatism (total astigmatism) Thirty-one Down syndrome patients (67%) and six normal controls (12%) had a clinically significant astigmatism (Ø1.0 D) in the right eye. Excluding the keratoconus patients, the corresponding numbers were 28 in the Down group and five in the normal group. In both cases, the difference between the groups was statistically significant (c2Ω34.45, dfΩ1, p⬍0.001). In the Down syndrome group, a total of 60 eyes (28 right eyes and 32 left eyes) had a total astigmatism Ø1.0 D (mean cylindrical power 2.1∫1.2 D, range 1.0–5.0). In this group there were 30 eyes in the 180æ-group, 6 in the 90æ-group, and 24 (40%) with an oblique astigmatism. Concerning the eyes with oblique astigmatism, all except one of the right eyes had their axis in the 135æ-meridian, and all the left eyes had their axis in the 45æmeridian (Fig. 4). As retinoscopy in cycloplegia was only performed in the right eye in the control group, no comparison could be made between the Down syndrome group and the control group concerning right/left specific axis in oblique astigmatism. Keratometry The mean keratometry value of the Down syndrome patients differed from that of the control group (46.39∫1.95 D vs. 43.41∫1.40 D, p⬍0.001) (Table 1 and Fig. 5A). Excluding the cases with keratoconus, the mean values remained virtually unchanged (46.2∫1.9 D vs. 43.4∫1.4 D). When using multiple regression analysis, this difference in keratometry was not influenced by age or gender. Keratometry measurements obtained from the central 3 mm diameter of the cornea
620
with the TechnoMed corneal topography device were plotted versus the measurements obtained with the Nidek autokeratometer KM-500 (Fig. 2A). Also, the difference between the two measurements
were plotted versus the average values (Fig. 2B), as suggested by Bland and Altman (1986). In the control group the two methods showed a very strong correlation, yielding almost identical values.
Fig. 5. Box plots of keratometry (A), central corneal thickness (B), anterior chamber depth (C), central lens thickness (D), and calculated lens power (E) in young adults with Down syndrome and age-matched normal controls.
Fig. 6. Axis of corneal astigmatismΩ1.0 D in the right and the left eyes in Down syndrome patients (filled bars) and normal controls (open bars).
The measurements in the Down syndrome group differed significantly more, especially for increasing mean values. This was probably due to poorer cooperation during the examination procedure. However, the difference between the measurements obtained by the two methods deviated fairly equally in positive and negative direction from the mean, and thus one method did not give systematically higher or lower values than the other. In the Down syndrome group, the mean∫standard deviation corneal astigmatism was 2.00∫1.59 D (range 0.25– 7.25), in the control group it was 0.82∫0.55 D (range 0.0–2.75). When excluding the keratoconus patients, mean corneal astigmatism was 1.74∫1.17 and 0.83∫0.56 in the two groups, respectively
Fig. 8. Axial length vs. spherical equivalent refraction in young adults with Down syndrome (filled circles) and age-matched normal controls (open circles).
(p⬍0.001 in both cases). As already described regarding total astigmatism, corneal astigmatism Ø1.0 D in the Down syndrome group also showed a high frequency of oblique axis (29 out of 57 eyes, 51%), with a strong predominance of the 135æ-axis in the right eyes and the 45æaxis in the left eyes (Fig. 6). In the control group, the frequency of oblique astigmatism was significantly lower (6 out of 33 eyes, 18%), showing no right/left specificity.
Central corneal thickness Central corneal thickness was measured on Scheimpflug images in the Down syndrome group (nΩ41) and the control group (nΩ51). A reduced central corneal thickness was found in the Down patients
(0.48∫0.04 mm; range 0.40–0.57) compared to the control group (0.55∫0.03 mm; range 0.49–0.64) (p⬍0.001) (Table 1 and Fig. 5B). Even when excluding the keratoconus patients, the mean values in the Down syndrome group and the control group remained unchanged (mean values 0.48 vs. 0.55 mm). Using multiple linear regression, the results were not influenced by age or gender. Corneal thickness measurements from Scheimpflug images were plotted versus ultrasonic pachymetry data (Fig. 7A). In addition, the average values were plotted versus the differences between the results obtained by the two methods (Fig. 7B), as recommended by Bland and Altman (1986). As may be seen from the figure, the two methods correlated well across the range of measurements.
Fig. 7. Central corneal thickness measurements; comparison between data obtained by Scheimpflug images and ultrasound pachymetry. Right graph (A) shows a scatter plot of the data from the two different methods, while the left graph (B) shows the agreement between the methods.
621
Anterior chamber depth The mean anterior chamber depth in the Down syndrome individuals was 3.45∫0.34 mm (range 2.87–4.15), which was very similar to that of the normal individuals (3.40∫0.23 mm, range 2.83– 3.87) (pΩ0.440) (Table 1). Excluding the keratoconus patients, anterior chamber depth was 3.43∫0.34 mm in the Down group and unchanged in the control group (pΩ0.614). However, there was a wider distribution in the Down syndrome group (Fig. 5C). Applying multiple regression analysis, the results were unaffected by age and gender. Axial length Thirty-seven of the Down syndrome patients cooperated well enough for axial length measurements. Their mean axial length was 22.44∫1.42 mm (range 19.42– 25.47), compared to 23.31∫1.01 mm (range 21.68–25.83) in the normal individuals (pΩ0.002) (Table 1). There was no influence by age or gender using multiple regression analysis. Axial length/corneal radius (AL/CR) ratio There was a small, but significant difference in the AL/CR ratio between the Down syndrome group and the normal controls (3.09∫0.18 vs. 3.00∫0.13, respectively; pΩ0.014) (Table 1). This difference was independent of age and gender, using multiple regression analysis. Lens thickness Mean central lens thickness in the Down syndrome group was 3.27∫0.29 mm (range 2.69–4.12), compared to 3.49∫0.20 mm (range 3.13–4.09) in the normal controls (p⬍0.001) (Table 1 and Fig. 5D). In addition to the difference in lens thickness between the study group and the control group, the lens thickness increased significantly with increasing age (multiple regression analysis, pΩ0.001). There was no influence by gender. Anterior lens surface curvature and calculated lens power Mean anterior lens surface curvature was 15.12∫2.63 mm in the Down syndrome group and 14.65∫1.29 mm in the control group. The mean calculated refractive power of the anterior lens surface was 5.64∫0.91D and 5.71∫0.49 D in the Down syndrome group and the normal group, respectively (Table 1). Neither of these differences were statistically significant. Using multiple linear regression
622
Table 2. Multiple linear regression analysis of spherical equivalent: final model from forward stepwise analysis.
Variable Constant Axial length (mm) Keratometry (D) Lens thickness (mm) Diagnosis (0Ωnormal, 1ΩDown) Age (in years) Sex (0Ωmale, 1Ωfemale) Diagnosis ¿ age
analysis, there was no influence by age or gender. In 34 of the Down syndrome patients, all the necessary variables (spherical equivalent, keratometry, anterior chamber depth and axial length) could be measured to calculate the dioptric power of the crystalline lens (in cycloplegia). The mean lens power was significantly lower in the Down group than in the control group (17.70∫2.36 D, range 13.25– 26.13 vs. 19.48∫1.24 D, range 16.22– 21.67) (p⬍0.001) (Table 1 and Fig. 5E). Using multiple regression analysis, this difference was not influenced by age or gender. It must be emphasized that the calculated values apply to the anterior vertex of the lens. Correlations between the total refraction of the eye and the individual optical elements Table 2 shows the results of the multiple regression analysis of total refraction of the eye (spherical equivalent as response
Regression coefficient
Standard Error
p-value
94.770 ª2.263 ª0.864 ª2.033 3.772 0.101 ª0.559 ª0.124
6.812 0.121 0.090 0.541 1.183 0.033 0.241 0.056
⬍0.001 ⬍0.001 ⬍0.001 0.002 0.003 0.023 0.031
variable) and diagnosis, age, gender, and the individual biometric variables of the eye: corneal thickness, keratometry, anterior chamber depth, anterior lens surface curvature, lens thickness, and axial length. Both axial length (p⬍0.001), keratometry (p⬍0.001), and central lens thickness (p⬍0.001) influenced spherical equivalent, while anterior lens surface curvature, anterior chamber depth, and corneal thickness did not. In addition, diagnosis, age and gender also significantly influenced spherical equivalent refraction. We found a significant interaction between diagnosis and age, suggesting an effect of age on spherical equivalent in the control group, but not in the Down syndrome group. No interactions between diagnosis and biometric variables were found. In Figure 8 we have plotted axial length against spherical equivalent, finding a high correlation both in the Down syndrome group and in the control group (RΩª0.799 and ª0.755, respectively).
Fig. 9. Axial length/corneal radius (AL/CR) ratio vs. spherical equivalent refraction in young adults with Down syndrome (filled circles) and age-matched normal controls (open circles).
Table 3. Axial density of the lens (arbitrary units) in young adults with Down syndrome and age-matched controls (right eyes, Scheimpflug images). Due to cases with small, dense areas of cataract in their lenses (excluded from the density data), the number of Down syndrome patients (n) differs between the different positions of measurements. Down syndrome Position of measurement in the lens Nucleus Center 1 mm anterior to the center 1 mm posterior to the center Cortex Anterior cortex Posterior cortex
Controls (nΩ51)
n
Mean
SD
Range
Mean
SD
Range
p-value1
40 39 39
36 44 56
5 8 6
21–44 29–61 44–71
23 26 44
9 10 12
6–46 7–50 21–72
⬍0.001 ⬍0.001 ⬍0.001
37 37
56 58
15 10
33–86 41–76
43 52
14 13
17–92 27–92
0.001 0.003
SDΩstandard deviation. 1 Student’s t-test.
However, an even higher correlation was found between the AL/CR ratio and the spherical equivalent (Fig. 9), both in the Down syndrome group and the normal group (RΩª0.832 and ª0.892, respectively, p⬍0.0001 in both groups). In a multiple linear regression model with spherical equivalent as response variable and axial length, AL/CR ratio and the products of diagnosis¿axial length and diagnosis¿AL/CR ratio as explanatory variables, we confirmed a high correlation between spherical equivalent and axial length and between spherical equivalent and AL/CR ratio, but no interactions between these variables and the diagnostic groups. Thus, there was no significant difference in the regression coefficient between the two groups. Axial density of the lens Axial density of the lens was significantly higher in the Down syndrome patients than in the normal controls, the difference being greater in the nucleus than in the cortex (Table 3). Accommodation Accommodation could be evaluated in 36 of the Down syndrome patients. A weak accommodative response was found in 14 patients (39%). There was no difference in mean lens thickness or calculated lens power between the group of Down patients who had a normal accommodation and those who had a weak accommodation. All the control subjects had a normal accommodative response. Table 1 summarizes all the measured and calculated biometric data from the Down syndrome group and the normal controls. Slit lamp examination revealed that 13 of the Down patients had incipient, snow-flake-like cataract to a varying
extent, mainly located in the periphery and often in a zonular pattern. In all these cases, the opacities were not regarded to be of visual significance. One patient had a dense, unilateral cataract, and another had a localized, anterior pole cataract in both eyes. As previously mentioned, two patients had undergone cataract surgery and had an intraocular lens in both eyes. Ophthalmoscopy of the central fundus did not reveal pathology neither in the patients nor in the controls. Similar to the average trisomy 21 patient, the one patient with translocation also had corneal thinning (0.45 mm), a steep cornea (45.25 D), a thin lens (3.02 mm), and a calculated weak lens power (16.68 D). Thus, the ocular biometric measurements in this patient did not differ significantly from those obtained in the trisomy 21 patients.
Discussion This study showed significant differences between young adults with Down syndrome and age-matched controls regarding many of the biometric variables of the eye. We are fully aware that the use of medical students and nurse students as normal controls may represent a selection bias compared to a random selection from the general population. However, the social and economic differences in the Norwegian society are small compared to many other Western countries, and students in our medical and nursing schools are recruited from most social classes. From a socio-economic point of view we therefore believe that the selection bias in using medical and nurse student probably is of minor importance. Concerning optometric variables, however, it is well
documented that the prevalence of myopia among medical students is higher than in a normal population. In a Norwegian study, Midelfart et al. (1992) found a prevalence of myopia of 50.3% among medical students. On the other hand, in our control group, medical students only made up one-third. Furthermore, the prevalence of myopia among these students (33%) was substantially lower than that reported by Midelfart et al. (1992) and relatively similar to the rest of the group (student nurses and randomly selected subjects). Comparing the data from our control group with previously published studies on ocular biometry from normal populations of similar age, our results correspond well to these (Doughty & Zaman 2000; Sorsby et al. 1961; Larsen 1971a, 1971b, 1971c; Kruse-Hansen 1971; Fledelius 1982; Fledelius & Stubgaard 1986). Taken together, we believe that valid comparisons between the study group and the control group may be performed, although we acknowledge that our control group is hampered by a selection bias. This should be kept in mind when interpreting our results. In accordance with previously published data, there was a wide distribution of spherical equivalent refractive errors in our group of Down syndrome patients, both in hypermetropic and myopic direction (Berk et al. 1996; Woodhouse et al. 1997). The high frequency of astigmatism, and particularly oblique astigmatism, is of special interest. An increased frequency of oblique astigmatism among young people with Down syndrome has previously been reported by Doyle et al. (1998). However, our study also showed a strong right-left specificity of the axes encountered in the Down patients with
623
oblique astigmatism. With only one exception, all the oblique astigmatism in the right eye was in the 135æ-meridian, while all the oblique astigmatism in the left eye was in the 45æ-meridian. These findings confirm our previous observations in children with Down syndrome (Haugen et al. 2001), and support the view that this right-left specificity is a typical finding in Down syndrome. As mechanical pressure exerted on the cornea from the eyelids and the palpebral fissure probably is an important causative factor of astigmatism in general (Grosvenor 1978; Gwiazda et al. 1984), we believe that the high frequency of oblique astigmatism in Down syndrome is at least partly caused by the upward slanting of the palpebral fissure. The markedly increased mean keratometry value in the Down syndrome group compared to the control group (46.39 D vs. 43.41 D) is a major finding in the present study. Even if we exclude the five keratoconus patients, the mean keratometry value in the Down syndrome group was 46.2 D. In the study of teenagers with Down syndrome by Doyle et al. (1998), relatively normal keratometry values were found (43.97∫2.17 D). In their study, keratometry was measured with corneal topography, but there is no information about the size of the corneal area used in these measurements. The discrepancy between their findings and our data may thus be due to methodological differences. However, it may also be caused by a selection bias in their patient material, as only 50 of the total cohort of 118 were examined. Another important finding in the present study is a highly significant reduction in central corneal thickness in Down syndrome patients compared to the control group. We suggest that this general thinning of the cornea may be a factor of major importance to a number of the corneal abnormalities encountered in Down syndrome individuals. It might at least partly explain the above-mentioned increased corneal curvature, as the mechanical rigidity of the cornea probably is lower. Likewise, it may also be a major causative factor for the increased frequency of astigmatism and the right/left specificity of oblique astigmatism, which coincide with the upward slanting of the palpebral fissure. A thinner cornea will probably be more susceptible to pressure exerted by the eyelids, and will therefore be more likely to develop astigmatism in the direction of the palpebral fissure.
624
Central thinning of the cornea must also be regarded as a predisposing factor for the development of keratoconus, which indeed occurs more frequently in Down syndrome than in the normal population (Rados 1948; Skeller & Øster 1951; Cullen & Butler 1963). Recently, Rabinowitz et al. (1999) have found a probable keratoconus gene locus on chromosome 21. It is possible that extra genetic material from this gene locus in trisomy 21 affects the collagen structure of the corneal stroma, leading to a thinner cornea. In a previous study from a central institution for mentally retarded, we showed that keratoconus development was associated with frequent eye rubbing (Haugen 1992). This has also been reported by others (Karseras & Ruben 1976; Koenig & Smith 1993). A thin cornea must be assumed to be particularly vulnerable to eye rubbing, and together these factors might lead to clinically manifest keratoconus in many Down syndrome patients. The lenses were significantly thinner in the Down patients than in the normal controls, and axial density of the lens showed a higher value, especially in the nucleus. Parallel to this, calculated lens power was significantly weaker in the Down syndrome group than in the normal individuals. These data may indicate that the lenses of individuals with Down syndrome have reduced plasticity in teenage and young adulthood compared to normal individuals. However, it is uncertain to what extent this influences accommodation, as we were unable to show a significant correlation between a reduced lens thickness or calculated lens power and the presence of accommodative weakness in the Down syndrome group. The reduced accommodation found in individuals with Down syndrome may thus be a result of changes both in the lens itself and in the nervous impulses to the ciliary muscle. There was no difference in anterior lens surface curvature and hence no difference in the refractive power of the anterior lens surface between the Down syndrome group and the normal group. The significant difference in total calculated lens power is thus probably due to difference in posterior lens curvature. It is of interest to note that axial length and keratometry were the optical components of major importance to the spherical equivalent value when examined in a multiple regression analysis, both in the Down syndrome and the control group.
Concerning the correlation between axial length and spherical equivalent, this finding is in accordance with the study of Doyle and coworkers (1998). However, these authors did not explore the impact of keratometry on spherical equivalent refraction. Furthermore, we have studied the axial length/corneal curvature (AL/ CR) ratio, which previously has been shown to correlate more closely to spherical equivalent than axial length alone (Grosvenor & Scott 1994). Our study confirmed this to be true, both in the Down syndrome group and in the normal group (Figs 8 and 9). This means that in spite of abnormal keratometry values, the corneal curvature and the axial length in Down syndrome do not relate to each other in a random fashion, but more or less similarly to that in normal subjects. However, as Figure 9 shows, for equal spherical equivalent values, Down syndrome subjects have somewhat higher AL/CR ratio than normal individuals. This is apparently compensated for by a weaker lens. In conclusion, our study demonstrated major and highly significant differences between Down syndrome patients and normal individuals in a number of the optical elements of the eye, especially central corneal thickness and keratometry. However, we still do not know how these differences in the individual optical parameters interact with each other, and especially why the emmetropization process frequently fails to occur in individuals with Down syndrome. Longitudinal data on the individual optical components of the eye would be of major interest in order to further explore these problems.
Acknowledgements We are indebted to the Laboratory for Cytogenetics, Center for Medical Genetics and Molecular Medicine, Haukeland University Hospital, Bergen, for providing the patient files. Part of this study was presented as a poster at the ARVO 2001 meeting (Haugen & Høvding 2001).
References Baez KA, Orengo S, Gandham S & Spaeth GL (1992): Intraobserver and interobserver reproducibility of the Nidek EAS-1000 anterior eye segment analysis system. Ophthalmic Surg 23: 426–428. Berk AT, Saatci AO, Erc¸al MD, Tunc¸ M & Erg-
in M (1996): Ocular findings in 55 patients with Down’s syndrome. Ophthalmic Genet 17: 15–19. Bland JM & Altman DG (1986): Statistical methods for assessing agreement between two methods of clinical measurement. Lancet i: 307–317. Cullen JF & Butler HG (1963): Mongolism (Down’s syndrome) and keratoconus. Br J Ophthalmol 47: 321–330. Doughty MJ & Zaman ML (2000): Human corneal thickness and its impact on intraocular pressure measures: a review. Surv Ophthalmol 44: 367–408. Doyle SJ, Bullock J, Gray C, Spencer S & Cunningham C (1998): Emmetropisation, axial length, and corneal topography in teenagers with Down’s syndrome. Br J Ophthalmol. 82: 793–796. Fledelius HC (1982): Ophthalmic changes from age of 10 to 18 years. A longitudinal study of sequels to low birth weight. III. Ultrasound oculometry and keratometry of anterior eye segment. Acta Ophthalmol (Copenh) 60: 393–402. Fledelius HC & Stubgaard M (1986): Changes in refraction and corneal curvature during growth and adult life. Acta Ophthalmol (Copenh) 64: 487–491. Gardiner PA (1967): Visual defects in cases of Down’s syndrome and other mentally handicapped children. Br J Ophthalmol 51: 469– 474. Grosvenor T (1978): Etiology of astigmatism. Am J Optom Physiol Optics 55: 214–218. Grosvenor T & Scott R (1994): Role of axial length/corneal radius ratio in determining the refractive state of the eye. Optom Vis Sci 71: 573–579. Gwiazda J, Scheiman M, Mohindra I & Held R (1984): Astigmastism in children: Changes in axis and amount from birth to six years. Invest Opthalmol Vis Sci 25: 88–92. Haugen OH (1992): Keratoconus in the mentally retarded. Acta Ophthalmol (Copenh) 70: 111–114. Haugen OH & Høvding G (2001): Corneal
thinning in young adults with Down syndrome [ARVO Abstract No. 4809]. Invest Ophthalmol Vis Sci 42/4 (Suppl): S895. Haugen OH, Høvding G & Lundström I (2001): Refractive development in children with Down’s syndrome: a population based, longitudinal study. Br J Ophthalmol 85: 714–719. Karseras AG & Ruben M (1976): Aetiology of keratoconus. Br J Ophthalmol. 60: 522–525. Koenig SB & Smith RW (1993): Keratoconus and corneal hydrops associated with compulsive eye rubbing. Refract Corneal Surg 9: 383–384. Kruse-Hansen F (1971): A clinical study of the normal human corneal thickness. Acta Ophthalmol (Copenh) 49: 82–89. Larsen JS (1971a): The sagittal growth of the eye. I. Ultrasonic measurement of the depth of the anterior chamber from birth to puberty. Acta Ophthalmol (Copenh) 49: 239– 262. Larsen JS (1971b): The sagittal growth of the eye. II. Ultrasonic measurement of the axial diameter of the lens and the anterior segment from birth to puberty. Acta Ophthalmol (Copenh) 49: 427–440. Larsen JS (1971c): The sagittal growth of the eye. IV. Ultrasonic measurement of the axial length of the eye from birth to puberty. Acta Ophthalmol (Copenh) 49: 873–886. Lowe RF (1949): The eye in mongolism. Br J Ophthalmol 33: 131–174. Midelfart A, Aamo B, Sjøhaug K & Dysthe BE (1992): Myopia among medical students in Norway. Acta Ophthalmol (Copenh) 70: 317–322. Oliver CA (1891): A clinical study of the ocular symptoms found in the so-called Mongolian type of idiocy. Trans Am Ophthalmol Soc 6: 140–148. Rabinowitz YS, Zu L, Yang J, Rotter J & Pulst S (1999): Keratoconus: non-parametric linkage analysis suggests a gene locus near the centromere of chromosome 21 [ARVO Abstract No. 2975]. Invest Ophthalmol Vis Sci 40 (Suppl): S564.
Rados A (1948): Conical cornea and mongolism. Arch Ophthalmol 40: 454–478. Sakamoto Y, Sasaki K, Nakamura Y & Watanabe N (1992): Reproducibility of data obtained by a newly developed anterior eye segment analysis system, EAS-1000. Ophthalmic Res 24 (Suppl 1): 10–20. Sakamoto Y & Sasaki K (1994): Accuracy of biometrical data obtained from the NIDEK EAS-1000. Ophthalmic Res 26 (Suppl 1): 26–32. Skeller E & Øster J (1951): Eye symptoms in mongolism. Acta Ophthalmol (Copenh) 29: 149–161. Sorsby A, Benjamin B & Sheridan M (1961): Refraction and its components during the growth of the eye from the age of three. Medical Research Council Special Report Series no. 301. HMSO. SPSS for Windows, Rel. 9.0. (1999). Chicago. SPSS Inc. Wesson MD & Maino DM (1995): Oculovisual findings in children with Down syndrome, cerebral palsy, and mental retardation without specific etiology. In: Maino DM (ed.) Diagnosis and management of special populations. St. Louis. Mosby: 17–54. Woodhouse JM, Pakeman VH, Cregg M, Saunders KJ, Parker M, Fraser WI, Sastry P & Lobo S (1997): Refractive errors in young children with Down syndrome. Optom Vis Sci 74: 844–851. Received on April 2nd, 2001. Accepted on August 24th, 2001.
Correspondence: Olav H. Haugen Department of Ophthalmology Haukeland University Hospital N-5021 Bergen Norway Phone: π47 55 97 41 00 Fax: π47 55 97 41 43 e-mail: olav.haugen/haukeland.no
625