Energies 2013, 6, 3937-3950; doi:10.3390/en6083937 OPEN ACCESS
energies ISSN 1996-1073 www.mdpi.com/journal/energies Article
Bioethanol Production by Carbohydrate-Enriched Biomass of Arthrospira (Spirulina) platensis Giorgos Markou 1,*, Irini Angelidaki 2, Elias Nerantzis 3 and Dimitris Georgakakis 1 1
2
3
Department of Natural Resources Management and Agricultural Engineering, Agricultural University of Athens, Iera Odos 75, Athens 11855, Greece; E-Mail:
[email protected]. Department of Environmental Engineering, Building 113, Technical University of Denmark, Lyngby 2800, Denmark; E-Mail:
[email protected] Biotechnology and Industrial Fermentations Lab, Faculty of Food Science and Nutrition, Technological Educational Institution of Athens, Ag. Spyridon Street, Egaleo 12210, Athens, Greece; E-Mail:
[email protected]
* Author to whom correspondence should be addressed; E-Mail:
[email protected]; Tel.: +30-210-529-4005; Fax: +30-210-529-4015. Received: 19 June 2013; in revised form: 7 July 2013 / Accepted: 23 July 2013 / Published: 6 August 2013
Abstract: In the present study the potential of bioethanol production using carbohydrate-enriched biomass of the cyanobacterium Arthrospira platensis was studied. For the saccharification of the carbohydrate-enriched biomass, four acids (H2SO4, HNO3, HCl and H3PO4) were investigated. Each acid were used at four concentrations, 2.5 N, 1 N, 0.5 N and 0.25 N, and for each acid concentration the saccharification was conducted under four temperatures (40 °C, 60 °C, 80 °C and 100 °C). Higher acid concentrations gave in general higher reducing sugars (RS) yields (%, gRS/gTotal sugars) with higher rates, while the increase in temperature lead to higher rates at lower acid concentration. The hydrolysates then were used as substrate for ethanolic fermentation by a salt stress-adapted Saccharomyces cerevisiae strain. The bioethanol yield (%, gEtOH/gBiomass) was significantly affected by the acid concentration used for the saccharification of the carbohydrates. The highest bioethanol yields of 16.32% ± 0.90% (gEtOH/gBiomass) and 16.27% ± 0.97% (gEtOH/gBiomass) were obtained in hydrolysates produced with HNO3 0.5 N and H2SO4 0.5 N, respectively. Keywords: Arthrospira (Spirulina); bioethanol; fermentation; microalgae; pretreatment; acid hydrolysis; thermal hydrolysis
Energies 2013, 6
3938
1. Introduction Today there is intensive research on the use of microalgae to produce biofuels. The main focus is given on species and improvements of cultivation conditions to produce microalgae rich in lipids for biodiesel generation. However, there is also an interest on the potential use of microalgae to produce biofuels through other biomass energy conversion technologies such as anaerobic digestion [1,2], thermochemical technologies [3,4] and anaerobic fermentation [5]. Especially the latter is a biological technology in which the only substrate for fermentation is carbohydrates. With the exception of some microalgal species, which have high initial carbohydrates content, the majority of microalgae have relative low carbohydrates content. Consequently, microalgae have not much attracted the interest as substrate for bioethanol production [5–15]. However, microalgal biomass composition can be manipulated by applying various stress cultivation conditions. Under stress conditions, such as nutrient starvation or high light intensity, some microalgal species accumulate carbohydrates in their biomass, which can amount to a significantly high level (a content of up to 65%) [16,17]. In this sense, when Choi et al. [9] and Nguyen et al. [10] cultivated the green alga Chlamydomonas reinhardtii under high illumination of 450 μE/m2 s and with the addition of acetic acid for pH regulation, they produced a carbohydrate rich biomass, with a carbohydrate content of about 60% of dry biomass. Likewise, Miranda et al. [14] and Ho et al. [18] cultivated Scenedesmus obliquus and Chlorella vulgaris, respectively, under nitrogen starvation conditions, which resulted also to accumulation of carbohydrates. In all these studies, the carbohydrate-enriched biomass was used for bioethanol production. Arthrospira platensis is a filamentous cyanobacterium, with relative high growth rates. The typical carbohydrate content of A. platensis is 10%–20%, but under phosphorus limitation it accumulates carbohydrates that can reach 60%–65% of dry biomass. In addition, the carbohydrate-enriched biomass of A. platensis after nutrient limitation displays a fast bio-flocculation capability, which is a very useful characteristic for easily biomass harvesting [19]. The limitation for microalgal carbohydrates applied to bioethanol production is that ethanologenic yeasts can ferment only simple sugars, such as glucose, fructose etc. Consequently, microalgal carbohydrates (sugar polymers) have first to be hydrolysed (saccharified) to simple sugars, so that they can be fermented by the ethanologenic yeasts [20]. Several hydrolysis methods have been developed and used for biomass carbohydrate saccharification. The most common method for hydrolysis of carbohydrates from e.g., cellulosic biomass, for bioethanol production is the use of enzymes. However, acid hydrolysis is also frequently studied [21–23]. Microalgae have different cell wall structures from lignocellulosic land plants. Especially the lack of lignin in microalgae results in lower demand for harsh pre-treatments for releasing the biodegradable organic matter, as the case for lignocellulosic biomass. Typical A. platensis contains carbohydrates mainly in the form of structure components of cell walls (peptoglycans) and in the form of intracellular storage components (glycogen granules) [24]. A. platensis lacks lignin, hemicellulose and even cellulose [25]. Moreover, it seems that under nutrition limitation the accumulated carbohydrates are mainly in the form of intracellular storage compounds [26]. Consequently, without a lignocellulosic cell wall, the phosphorus-starved A. platensis would be easily compatible with the hydrolysis process.
Energies 2013, 6
3939
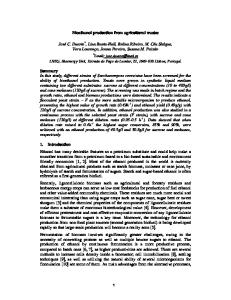
This work aimed to investigate the potential of using carbohydrate-enriched biomass of A. platensis as substrate for the production of bioethanol through ethanolic fermentation. To the best knowledge of the authors, no published work exists in which the hydrolysis of cyanobacterial carbohydrate-enriched biomass has been investigated. Based on this fact, the study subsequently aimed to investigate the acid hydrolysis of carbohydrate-enriched biomass of A. platensis using four acids as hydrolyzing agents. The three major operational parameters which affect the acid hydrolysis process are temperature, acid concentration and reaction time [10]. Thus in the present study each acid had four concentrations and for each acid concentration the hydrolysis was conducted under four different temperatures. Since the substrates with the saccharified carbohydrates were not desalted, for the fermentation of the hydrolysates a salt stress-adapted Saccharomyces cerevisiae yeast strain was used. 2. Results and Discussion 2.1. Carbohydrates Hydrolysis A. platensis is a cyanobacterium which is considered as a potential candidate for biomass production for biofuel generation. In the present study, carbohydrate-enriched A. platensis was produced in semi-continuous cultivation mode by applying phosphorus limitation, following a method which was developed and described in a previous study [19]. The biomass concentration of the produced A. platensis was steady for over two months and was about 2.0–2.2 g/L. In Figure 1, the composition of the phosphorus-limited A. platensis is shown. Figure 1. Biomass composition of Arthrospira platensis cultivated under phosphorus limitation in semi-continuous mode. Bars are ± SD. 70
Component content (% w/w)
60
Carbohy drates Proteins Lipids
50 40 30 20 10 0
In order to investigate the potential of the carbohydrate-enriched biomass of A. platensis to be used as feedstock for bioethanol production, the microalgal carbohydrates first had to be hydrolysed (saccharified). For the hydrolysis of the carbohydrate-enriched biomass, four acids (H2SO4, HNO3, HCl and H3PO4) were used. Each acid had four concentrations (2.5 N, 1 N, 0.5 N and 0.25 N) and for each concentration the hydrolysis was conducted under four temperatures (40 °C, 60 °C, 80 °C and 100 °C). The hydrolysis at 40 °C showed that even in concentration of 2.5 N after 48 h the RS yield did not get above 4% (data not shown). For all acids investigated at 60 °C the concentration of 2.5 N gave the
Energies 2013, 6
3940
highest RS yield (Figure 2). Among the acids, HCl had the highest RS yield; however the differences with the other acids were not statistically significant, except for H3PO4, which had a significant very low RS yield. At a concentration of 1 N, the highest RS yields of 94% and 98% was observed with HNO3 and HCl, respectively, after 48 h, while the RS yields with H2SO4 were significant lower. At 0.5 N the highest RS yield (59%) was observed with HNO3 for 48 h, but its differences with H2SO4 and HCl were not statistically significant. Figure 2. Reducing sugars yields (g glucoseeq/g total sugars) kinetics from the hydrolysis of A. platensis at 60 °C using (a) H2SO4; (b) HNO3; (c) HCl; and (d) H3PO4 as the catalyst. (●: 2.5 N; □: 1 N; ▲: 0.5 N and ■: 0.25 N). n = 9, bars are ± SD. 1.0
H2SO4
Reducing sugars yield
Reducing sugars yield
1.0 0.8 0.6 0.4 0.2 0.0
0
10
20
30
40
0.6 0.4 0.2 0.0
50
HNO3
0.8
0
10
Time (h)
40
50
(b) 1.0
1.0
HCl
Reducing sugars yield
Reducing sugars yield
30
Time (h)
(a)
0.8 0.6 0.4 0.2 0.0
20
0
10
20
30
Time (h)
(c)
40
50
H3PO4
0.8 0.6 0.4 0.2 0.0
0
10
20
30
40
50
Time (h)
(d)
In comparison to the hydrolysis at 60 °C the RS yields at 80 °C were in general higher with higher rates (Figure 3). The highest RS yield of 98% was obtained at 90 min with 2.5 N HNO3, while H2SO4 and HCl had almost the same RS yield given their best results after 3 h of reaction. H3PO4 had also the lowest RS yield as at 60 °C, reaching its highest value (42%) after 48 h. At 1 N acids, except of H3PO4, RS yields reached almost the same values as the acids of 2.5 N. The acids HCl and HNO3 reached their highest RS yields after 3 h, while treatment with H2SO4 needed 24 h to reach its highest RS yield. At 0.5 N concentration, the acids HNO3 and H2SO4 gave slightly lower RS yields than 2.5 N and 1 N but needed more reaction time.
Energies 2013, 6
3941
Figure 3. Reducing sugars yields (g glucoseeq/g total sugars) kinetics from the hydrolysis of A. platensis at 80 °C using (a) H2SO4; (b) HNO3; (c) HCl; and (d) H3PO4 as the catalyst. (●: 2.5 N; □: 1 N; ▲: 0.5 N and ■: 0.25 N). n = 9, bars are ± SD. 1.0
H2SO4
Reducing sugars yield
Reducing sugars yield
1.0 0.8 0.6 0.4
0.8
0.2
0.0 0
0.4 45
90 135 180
HNO3
0.8 0.6 0.8
0.4
0.4 0.0 0
0.2
45
0.0
0
10
20
30
40
0.0
50
0
10
Time (h)
20
30
40
50
40
50
(b) 1.0
1.0
HCl
Reducing sugars yield
Reducing sugars yield
135 180
Time (h)
(a) 0.8 0.6 0.8
0.4
0.4 0.0 0
0.2
45
90
135 180
Time (min)
0.0
90
Time (min)
Time (min)
0
10
20
30
Time (h)
(c)
40
50
H3PO4
0.8 0.6 0.4 0.2 0.0
0
10
20
30
Time (h)
(d)
The RS yields at 100 °C (Figure 4) had higher rates than at 80 °C, though the highest RS yields were, in general slightly lower but without statistical significance. Also at 100 °C the increase of acid concentration had a positive effect on the hydrolysis rates but did not affected or had a slightly negatively effect on the RS yields. Although the hydrolysis with 2.5 N had higher rates, at 1 N and 0.5 N the RS yields were the same and even higher (as in 1 N HNO3). The strength of the acid affected in general the overall hydrolysis ability. The lowest RS yields were obtained with H3PO4, which is a triprotic weak acid, while HNO3 resulted in higher hydrolysis rates than HCl and H2SO4. The same acid effect on hydrolysis ability was also reported for sugar cane bagasse treated with HNO3, which resulted to higher hydrolysis rates in comparison to H2SO4 and HCl [27]. Since A. platensis lacks lignin and hemicellulose, it was hypothesized that the hydrolysis of its intracellular carbohydrates could be achieved under mild conditions. Therefore to investigate this hypothesis low temperatures (under 100 °C) were chosen for the acid-thermal treatment of A. platensis. The results indicate that the overall hydrolysis ability is a function of the combined action of acid concentration, temperature and reaction time. Higher acid concentrations resulted in general in higher hydrolysis rates. Although higher temperatures resulted in general in higher hydrolysis rates, the highest RS yields were obtained at 80 °C but considerably more reaction time was needed to achieve these yields. High temperature in combination with high acid concentration after prolonged reaction time resulted to RS yield reduction, probably due to sugar decomposition under these conditions. Such
Energies 2013, 6
3942
a sugar decomposition was also reported by Miranda et al. [6]; in experiments on the acid hydrolysis of the microalga Scenedesmus obliquus, when the acid concentration was increased above 2 N the RS yields decreased significant. Figure 4. Reducing sugars yields (g glucoseeq/g total sugars) kinetics from the hydrolysis of A. platensis at 100 °C using (a) H2SO4; (b) HNO3; (c) HCl; and (d) H3PO4 as the catalyst. (●: 2.5 N; □: 1 N; ▲: 0.5 N and ■: 0.25 N). n = 9, bars are ± SD. 1.0
H2SO4
Reducing sugars yield
Reducing sugars yield
1.0 0.8 0.6 0.4 0.2 0.0
0.6 0.4 0.2 0.0
0
45
90
135
HNO3
0.8
180
0
45
(a) Reducing sugars yield
Reducing sugars yield
HCl
0.6 0.4 0.2
45
90
135
180
135
180
H3PO4
0.8 0.6 0.4 0.2 0.0
0
180
(b)
1.0
0.8
0.0
135
Time (min)
Time (min)
1.0
90
0
45
90
Time (min)
Time (min)
(c)
(d)
A second series of tests was conducted, in which two series of acid mixtures were used. On the one hand, the use of acid mixtures could decrease the need to add nutrients (such as nitrogen, phosphorus and sulfur) to fulfill the nutrient requirements for yeasts growth, but the main hypothesis behind this experiment was that the acids in the mixture may have an interaction and a synergistic effect and may result in higher hydrolysis rates and RS yields. However this hypothesis was not confirmed (Figure 5). In general it was observed that in the mixtures in which HNO3 participated with higher ratio the RS yields were higher and had higher rates in comparison to the mixtures, in which H2SO4 participated with higher ratio. However, there were no statistical significant differences between the mixtures. In contrast, the combination of the level of the total acid concentration of the mixtures and the acid ratio, in some cases had a significant effect on the RS yields; mixtures with concentration 1 N and higher HNO3 ratio had higher RS yields in comparison to the mixtures with concentration of 0.5 N and higher H2SO4 ratio.
Energies 2013, 6
3943
Figure 5. Reducing sugars yields (g glucoseeq/g total sugars) kinetics from the hydrolysis with acid mixtures (Δ: 1.5:5.5:1; ○: 2.5:4.5:1; □: 3.5:3.5:1; ▲: 4.5:2.5:1 and ●: 5.5:1.5:1) under 100 °C with total concentration of (a) 0.5 N and (b) 1 N. (Ratio means H2SO4:HNO3:HCl). n = 9, bars are ± SD. 1.0 0.5N
0.8
Reducing sugars yield
Reducing sugars yield
1.0
0.6 0.4 0.2 0.0
0
45
90
135
180
1N
0.8 0.6 0.4 0.2 0.0
0
45
90
Time (min)
Time (min)
(a)
(b)
135
180
Based on the above results, for the ethanolic fermentation experiments the hydrolysates derived from the hydrolysis at 100 °C using HNO3, H2SO4 and HCl at concentrations of 2.5 N, 1 N and 0.5 N were used as substrate. 2.2. Bioethanol Yields After the examination of the hydrolysis capability of the carbohydrates of A. platensis, the potential of the hydrolysates to be used as substrate for fermentative bioethanol production was studied. Hydrolysates derived from hydrolysis using acid at 0.25 N were not studied because of the very low RS yields. The highest bioethanol yield (% g EtOH/gdw biomass) was observed at acid concentration of 0.5 N. At this concentration, fermentation of hydrolysates with HCl as catalyst had the lowest bioethanol yield (13.41% g EtOH/gdw biomass), while hydrolysates with H2SO4 and HNO3 as catalysts had bioethanol yield of 16.27 and 16.32% g EtOH/gdw biomass, respectively (Table 1). In the hydrolysates with 1 N acids, the only acid as catalyst, in which fermentation could be performed was H2SO4, while hydrolysates with HNO3 and HCl gave very low bioethanol production. At the concentration of 2.5 N in all acids used the bioethanol yield was very low (less than 0.5% g EtOH/gdw biomass). In the fermentation of hydrolysates using acid mixtures the bioethanol yields were very low at 1 N hydrolysates, while in 0.5 N hydrolysates the bioethanol yields were considerable lower in comparison to the respectively sole acids, ranging from 9.6 up to 11.6% g EtOH/gdw biomass (Table 1). Although the ethanologenic yeast used in this study was salt stress-adapted to thrive in an environment with high salt concentration, the hydrolysate’s salt concentration in some cases was probably considerably higher than the capability of the yeast to thrive on it. The very low bioethanol yield at 2.5 N shows that the salt concentrations formed after pH adjustment to 4.5 were very high and resulted to inhibition of the growth and metabolism of the yeast. In case of 1 N, only hydrolysates with H2SO4 as catalyst permitted ethanol production in adequate amounts. This is probably because H2SO4 as a diprotic acid resulted in less salt formation after the addition of NaOH for pH adjustment (Table 2) which indicated that at this salt concentration bioethanol could be produced.
Energies 2013, 6
3944
Table 1. Bio-ethanol production from the hydrolysates from A. platensis. The duration of fermentation was 24 h. n = 9, ± SD. Acid H2SO4 HNO3 HCl
Mixture (H2SO4:HNO3:HCl)
3.5:3.5:1 2.5:4.5:1 4.5:2.5:1 3.5:3.5:1 2.5:4.5:1 4.5:2.5:1
Acid concentration 2.5 N 1N 0.5 N 2.5 N 1N 0.5 N 2.5 N 1N 0.5 N 1N 1N 1N 0.5 N 0.5 N 0.5 N
Ethanol yield (% g EtOH/gdw biomass) < 0.5 9.27 ± 0.42 16.27 ± 0.97 < 0.5 < 0.5 16.32 ± 0.90 < 0.5 0.78 ± 0.01 13.41 ± 0.86 < 0.5 < 0.5 < 0.5 11.3 ± 1.2 9.6 ± 0.2 11.6 ± 0.3
Ethanol yield from theoretical values 1 (%) 30.4 ± 1.6 53.3 ± 3.4 53.5 ± 3.1 2.6 ± 0.21 44.1 ± 2.3 37.2 ± 1.2 31.5 ± 0.9 38.0 ± 1.2
1
Ethanol yield is the average from three batch fermentations and is based on the real content of RS in the hydrolysates (n = 9). The calculations of theoretical values are based on the assumption that all of the RS are fermentable and that the yield of bioethanol per g of RS (glucose) is 0.51 g EtOH.
Table 2. Electrical conductivity and salt concentration of the salts formed on hydrolysates after the hydrolysis with several acids and its pH adjustment to 4.5 with NaOH. Acid H2SO4
HNO3
HCl 3.5:3.5:1 2.5:4.5:1 4.5:2.5:1 3.5:3.5:1 2.5:4.5:1 4.5:2.5:1
Mixture (H2SO4:HNO3:HCl)
1
Acid concentration 2.5 N 1N 0.5 N 2.5 N 1N 0.5 N 2.5 N 1N 0.5 N 1N 1N 1N 0.5 N 0.5 N 0.5 N
Electrical conductivity (mS/cm) 95 50 31 152 79 41 170 86 46 87 82 75 56 59 49
Salt concentration 1 (g/L) 177 71 35 212 85 42 146 58 29 76 77 74 38 39 37
Salt formed Na2SO4
NaNO3
NaCl -
Based on the reaction balance of the acid and NaOH for neutralization.
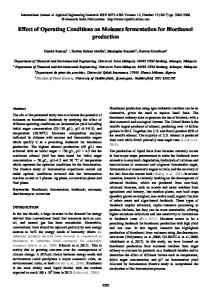
A negative relationship between electrical conductivity of the hydrolysates and the bioethanol yield was observed (Figure 6), i.e., the increase in electrical conductivity of the hydrolysates resulted in a decrease in bioethanol yield. At the specific temperature level (100 °C) that the hydrolyses were conducted, the relationship between these parameters is linear, however decreasing the acid
Energies 2013, 6
3945
concentration doesn’t mean that the bioethanol yield will increase further. That is because lower acid concentrations will result to lower saccharification and RS yields (as in case of acids 0.25 N studied), resulting to an overall lower bioethanol yield. It is expected that temperatures above 100 ºC might allow using lower acid concentrations and consequently resulting to an overall higher bioethanol yields. Therefore more research is needed on the hydrolysis of the carbohydrate-enriched biomass of A. platensis at higher temperature levels. Besides the salt stress on the yeast cells, several other inhibitors could be formed during the hydrolysis process, such as organic acids and furan derivatives (phenolic compounds are not expected due to the lack of lignin) [28]. However, at the biomass concentration examined in this study, it is expected that such as inhibitors would not be formed at concentrations that could affect negatively the fermentation process [6]. However, when higher biomass loads are used for hydrolysis, the possibility of formation of several inhibitors at levels which negatively affect the yeast growth, has to be taken into consideration [6]. Figure 6. Relation between bioethanol yield (%, g EtOH/gDW biomass) and electrical conductivity of the hydrolysates (R2 = 0.936).
Bioethanol yield
20
15
10
5
0 20
30
40
50
60
70
80
90
Electrical conductivity (mS/cm)
The bioethanol yield results (up to 53%) underline that there is room for improvements. It seems that desalination of the hydrolysates could be an important option. Desalination could be achieved by using ion-exchange resins [11] or catalyst separation, exclusion and recovery [10,29,30]. However desalination is an expensive procedure and will contribute to the overall costs. Therefore research to find more salt tolerant yeasts or methods of adaptation of yeasts to high salt environments is needed. In Table 3, several selected studies are listed, in which microalgal biomass was used as feedstock for bioethanol production. To our best knowledge, this is the first time in which a cyanobacterium like A. platensis was cultivated under phosphorus limitation conditions to be used as feedstock for bioethanol production. This study shows that the use of the cyanobacterium A. platensis after its cultivation under phosphorus limitation [19] is a potential candidate for bioethanol production, showing satisfactory bioethanol yields. However, in order to determine the sustainability of such a process, detailed economic, energy and environmental assessment should be made.
Energies 2013, 6
3946
Table 3. Comparison of ethanol yield of several selected biomass (AC: acid concentration, T: temperature, RT: reaction time, Y: yield from theoretical values, EY: bioethanol yield (%, gEtOH/gBiomass), SC: Saccharomyces cerevisiae, SSc: Saccharomyces sake, KM: Kluyveromyces marxianus, ZM: Zymomonas mobilis, (*): theoretical values, given by the authors). Species
AC
T (°C)
RT (min)
Y (%)
EY
Yeast species
Ref.
Scenedesmus obliquus Scenedesmus obliquus Chlamydomonas reinhardtii Synechococcus leopoliensis Chlorella vulgaris Arthrospira platensis Arthrospira platensis
2 N H2SO4 2 N H2SO4 3% HCl (v/v) 3 N HCl 1% H2SO4 (v/v) 0.5 N H2SO4 0.5 N HNO3
120 120 110 80 121 100 100
30 30 30 20 20 180 180
100 82 87.6 53.5 57
2.24 2.34 29.2 (*) 16.27 16.32
SC KM SC SSc ZM SC SC
[14] [14] [10] [11] [18] This study This study
3. Experimental Section 3.1. Culture Conditions of Arthrospira platensis Arthrospira platensis SAG 21.99 was obtained from SAG (Sammlung von Algenkulturen der Universität Göttingen, Göttingen, Germany) and was cultured in six 3 L glass photobioreactors with 2.5 L working volume using as cultivation medium a modified Zarrouk medium. The modified Zarrouk medium had the following composition (per L): 16.8 g NaHCO3, 2.5 g NaNO3, 1.0 g K2SO4, 1.0 g NaCl, 0.04 g CaCl2, 0.08 g Na2EDTA, 0.2 g MgSO4•7 H2O, 0.01 g FeSO4•7 H2O and 1.0 mL of trace elements (per L): 2.86 g H3BO3, 0.02 g (NH4)6 Mo7O24, 1.8 g MnCl2•4 H2O, 0.08 g Cu2SO4, 0.22 g ZnSO4•7 H2O. Enrichment of the carbohydrates was performed under phosphorus limitation cultivation applying phosphorus at amounts that correspond of 1.85 mg P/g biomass, as described in Markou et al. [19]. The dilution rate of the semi-continuous operation of the bio-reactors was set at 0.1 per day and the fresh medium was added every two days. The cultures were illuminated under continuous irradiation of 150 μE/m2 s on both sides of the bioreactors. The light source was four cool white fluorescence tubes. Temperature was set at 30 °C (± 1 °C). The cultures were agitated with filtered air provided by a membrane pump. 3.2. Hydrolysis Conditions 3.2.1. Hydrolysis with Single Acids A. platensis was harvested by filtration after settling and bio-flocculation for 30 min [19]. The filtrated biomass was re-suspended in deionized water in concentration of about 12–13 g/L. Aliquots (25 mL) of concentrated A. platensis were treated with acids. The acids used were H2SO4, HNO3, HCl and H3PO4. For each acid, four concentrations were examined, namely 2.5 N, 1 N, 0.5 N and 0.25 N. The treated biomass was closed on polypropylene tubes with screw caps and placed in a water-bath. For each acids concentration four temperatures were used, namely 40 °C, 60 °C, 80 °C and 100 °C.
Energies 2013, 6
3947
3.2.2. Hydrolysis with Mixture of Αcids In another experiment, mixtures of acids were studied. The mixtures were chosen so that the acids participate at the following ratios: (H2SO4:HNO3:HCl) 1.5:5.5:1, 2.5:4.5:1, 3.5:3.5:1, 4.5:2.5:1 and 5.5:1.5:1. Two series of experiments were conducted, in which the total acid concentrations of the mixtures were for the one series 1 N and for the other series 0.5 N. These experiments based on the observation of the results of the experiments with single acids, were conducted under 100 °C. 3.3. Fermentation Conditions A. platensis hydrolysates were examined for their fermentation potential and bioethanol production. Based on the hydrolysis kinetics obtained from the hydrolysis series of tests, three acids (H2SO4, HNO3 and HCl) and three concentrations (2.5 N, 1 N and 0.5 N) were chosen for further study. The time of incubation was 45 min, 90 min and 180 min for 2.5 N, 1 N and 0.5 N, respectively. For the fermentation of the hydrolysates using acid mixtures the hydrolysis temperature was 100 °C and the reaction time 90 min and 180 min for 1 N and 0.5 N, respectively. The hydrolysed biomass of A. platensis was subsequently adjusted to pH 4.5 (± 0.1) with NaOH. To the hydrolysates the following nutrients were added NH4SO4 (2 g/L), K2HPO4 (1 g/L), KH2PO4 (1 g/L), ZnSO4 (0.2 g/L), MgSO4 (0.2 g/L) and yeast extract (2 g/L). The resulted electrical conductivity after the adjustment of the hydrolysates to pH 4.5 for each acid and concentration is listed on Table 1. The most used fermentative yeast for industrial process is Saccharomyces cerevisiae, because of a series of advantages and capabilities, such as good ethanol tolerance (up to 20%, v/v) and its capability to be growing rapidly in anaerobic conditions [31,32]. In addition, S. cerevisiae can thrive in relative high salt concentration after its acclimatization by pre-cultivation under salt-stressed conditions. Therefore, to evaluate the potential of the hydrolysates for bioethanol production, the samples were inoculated with Saccharomyces cerevisiae MV 92081 (Martin Vialatte), which was pre-cultivated under salt stress [33]. The substrates were sterilized at 120 °C for 25 min. The inoculation was performed aseptically and the inoculated hydrolysates were incubated for fermentation at 30 °C (± 1 °C) for 24 h. 3.4. Analytical Methods Total sugars (carbohydrates) were measured by the sulfuric-phenol method [34], while reducing sugars were determined according to the 3.5-dinitrosalicylic acid (DNS) method [35]. In both methods D-glucose was used to make the standard curves. Bioethanol was measured by enzymatic method according to Prencipe et al. [36], in which ethanol was used as the standard. All tests were conducted in triplicates. pH and electrical conductivity were measured with a Hach HQ40 portable meter. For all experiments fresh harvested biomass of A. platensis was used. For the determination of the reducing sugars, the tubes were cooled on running tap water and a sample was pipetted out. The hydrolysates were neutralized with 6 N NaOH and centrifuged for 4–5 min at 7000–8000 rpm. The supernatant was diluted properly and was used for the determination of reducing sugars. Reducing sugars yield was calculated according to the following equation:
Energies 2013, 6
3948
=
.
(1)
All experiments were conducted in triplicates and for each replicate three analyses were made. The values given are the average (± standard deviation, n = 9). Statistical analysis was performed using the analysis of variation (ANOVA) with the statistical software Statistica 8.0 from StatSoft (Tulsa, OK, USA). Statistical significance was set at α = 0.05. 4. Conclusions Microalgal biomass is a potential feedstock for biofuel production. In particular carbohydrate-rich microalgae can be used for bioethanol production, but microalgal biomass in order to be used as feedstock for bioethanol production has first to be pre-treated so that the cellular carbohydrates are converted to fermentable sugars. Acid thermal treatment can be applied as a pre-treatment method. Increasing acid concentration and process temperature hydrolysis rates are improved. Nevertheless, the acid concentration and the resulting salt concentration of the hydrolysates affect the bioethanol production. At 0.5 N acid concentration the hydrolysates could be fermented by a salt stress-adapted S. cerevisiae yeast with a bioethanol yield of about 16% g EtOH per g of dry A. platensis biomass. Acknowledgments Dr Panagiotis Tataridis, Dr Stylianos Logothetis and PhD candidate Tasos Kanellis are kindly acknowledged for their help with the fermentation processes. Konstantinos Panetsos is also kindly acknowledged for his help in the hydrolysis experiments. The experiments were conducted during the summer of 2012. I, Angelidaki thanks the Danish Strategic Research project no. 09-067601 and the E4 Water EU project. Conflict of Interest The authors declare no conflict of interest. References 1.
2. 3.
4.
Inglesby, A.E.; Fisher, A.C. Enhanced methane yields from anaerobic digestion of Arthrospira maxima biomass in an advanced flow-through reactor with an integrated recirculation loop microbial fuel cell. Energy Environ. Sci. 2012, 5, 7996–8006. González-Fernández, C.; Sialve, B.; Bernet, N.; Steyer, J.P. Thermal pretreatment to improve methane production of Scenedesmus biomass. Biomass Bioenergy 2012, 40, 105–111. Du, Z.; Mohr, M.; Ma, X.; Cheng, Y.; Lin, X.; Liu, Y.; Zhou, W.; Chen, P.; Ruan, R. Hydrothermal pretreatment of microalgae for production of pyrolytic bio-oil with a low nitrogen content. Bioresour. Technol. 2012, 120, 13–18. Heilmann, S.M.; Davis, H.T.; Jader, L.R.; Lefebvre, P.A.; Sadowsky, M.J.; Schendel, F.J.; von Keitz, M.G.; Valentas, K.J. Hydrothermal carbonization of microalgae. Biomass Bioenergy 2010, 34, 875–882.
Energies 2013, 6 5. 6. 7. 8. 9. 10.
11. 12. 13.
14.
15.
16.
17. 18.
19.
20. 21.
3949
Harun, R.; Danquah, M.K. Influence of acid pre-treatment on microalgal biomass for bioethanol production. Process Biochem. 2011, 46, 304–309. Miranda, J.R.; Passarinho, P.C.; Gouveia, L. Pre-treatment optimization of Scenedesmus obliquus microalga for bioethanol production. Bioresour. Technol. 2012, 104, 342–348. Zhou, N.; Zhang, Y.; Wu, X.; Gong, X.; Wang, Q. Hydrolysis of Chlorella biomass for fermentable sugars in the presence of HCl and MgCl2. Bioresour. Technol. 2011, 102, 158–161. Eshaq, F.S.; Ali, M.N.; Mohd, M.K. Production of bioethanol from next generation feed-stock alga Spirogyra species. Int. J. Eng. Sci. Technol. 2011, 3, 1749–1755. Choi, S.P.; Nguyen, M.T.; Sim, S.J. Enzymatic pretreatment of Chlamydomonas reinhardtii biomass for ethanol production. Bioresour. Technol. 2010, 101, 5330–5336. Nguyen, M.T.; Choi, S.P.; Lee, J.; Lee, J.H.; Sim, S.J. Hydrothermal acid pretreatment of Chlamydomonas reinhardtii biomass for ethanol production. J. Microbiol. Biotechnol. 2009, 19, 161–166. Mustaqim, D.; Ohtaguchi, K. A synthesis of bioreactions for the production of ethanol from CO2. Energy 1997, 22, 353–356. Kim, J.; Um, B.-H.; Kim, T. Bioethanol production from micro-algae, Schizocytrium sp., using hydrothermal treatment and biological conversion. Korean J. Chem. Eng. 2012, 29, 209–214. Sulfahri, S.M.; Sunarto, E.; Irvansyah, M.Y.; Utami, R.S.; Mangkoedihardjo, S. Ethanol production from algae Spirogyra with fermentation by Zymomonas mobilis and Saccharomyces cerevisiae. J. Basic Appl. Sci. Res. 2011, 1, 589–593. Miranda, J.; Passarinho, P.; Gouveia, L. Bioethanol production from Scenedesmus obliquus sugars: The influence of photobioreactors and culture conditions on biomass production. Appl. Microbiol. Biotechnol. 2012, 96, 555–564. Lee, S.; Oh, Y.; Kim, D.; Kwon, D.; Lee, C.; Lee, J. Converting carbohydrates extracted from marine algae into ethanol using various ethanolic Escherichia coli strains. Appl. Biochem. Biotechnol. 2011, 164, 878–888. Markou, G.; Angelidaki, I.; Georgakakis, D. Microalgal carbohydrates: An overview of the factors influencing carbohydrates production, and of main bioconversion technologies for production of biofuels. Appl. Microbiol. Biotechnol. 2012, 96, 631–645. González-Fernández, C.; Ballesteros, M. Linking microalgae and cyanobacteria culture conditions and key-enzymes for carbohydrate accumulation. Biotechnol. Adv. 2012, 30, 1655–1661. Ho, S.-H.; Huang, S.-W.; Chen, C.-Y.; Hasunuma, T.; Kondo, A.; Chang, J.-S. Bioethanol production using carbohydrate-rich microalgae biomass as feedstock. Bioresour. Technol. 2013, 135, 191–198. Markou, G.; Chatzipavlidis, I.; Georgakakis, D. Carbohydrates production and bio-flocculation characteristics in cultures of Arthrospira Spirulina platensis: Improvements through phosphorus limitation process. Bioenergy Res. 2012, 5, 915–925. Talebnia, F.; Karakashev, D.; Angelidaki, I. Production of bioethanol from wheat straw: An overview on pretreatment, hydrolysis and fermentation. Bioresour. Technol. 2010, 101, 4744–4753. Sun, Y.; Cheng, J. Hydrolysis of lignocellulosic materials for ethanol production: A review. Bioresour. Technol. 2002, 83, 1–11.
Energies 2013, 6
3950
22. Tasić, M.B.; Konstantinović, B.V.; Lazić, M.L.; Veljković, V.B. The acid hydrolysis of potato tuber mash in bioethanol production. Biochem. Eng. J. 2009, 43, 208–211. 23. Ballesteros, I.; Ballesteros, M.; Manzanares, P.; Negro, M.J.; Oliva, J.M.; Sáez, F. Dilute sulfuric acid pretreatment of cardoon for ethanol production. Biochem. Eng. J. 2008, 42, 84–91. 24. Van Eykelenburg, C. On the morphology and ultrastructure of the cell wall of Spirulina platensis. Antonie Leeuwenhoek 1977, 43, 89–99. 25. Babadzhanov, A.S.; Abdusamatova, N.; Yusupova, F.M.; Faizullaeva, N.; Mezhlumyan, L.G.; Malikova, M.K. Chemical composition of Spirulina platensis cultivated in Uzbekistan. Chem. Nat. Compd. 2004, 40, 276–279. 26. Tillberg, J.E.; Rowley, J.R. Physiological and structural effects of phosphorus starvation on the unicellular green alga Scenedesmus. Physiol. Plant. 1989, 75, 315–324. 27. Rodrı́guez-Chong, A.; Alberto Ramı́rez, J.; Garrote, G.; Vázquez, M. Hydrolysis of sugar cane bagasse using nitric acid: A kinetic assessment. J. Food Eng. 2004, 61, 143–152. 28. Chandel, A.K.; da Silva, S.S.; Singh, O.V. Detoxification of Lignocellulosic Hydrolysates for Improved Bioethanol Production. In Biofuel Production-Recent Developments and Prospects, Bernardes, M.A.D.S., Ed.; InTech: Rijeka, Croatia, 2011; pp. 225–246. 29. Cheng, K.-K.; Cai, B.-Y.; Zhang, J.-A.; Ling, H.-Z.; Zhou, Y.-J.; Ge, J.-P.; Xu, J.-M. Sugarcane bagasse hemicellulose hydrolysate for ethanol production by acid recovery process. Biochem. Eng. J. 2008, 38, 105–109. 30. Zhou, N.; Zhang, Y.; Gong, X.; Wang, Q.; Ma, Y. Ionic liquids-based hydrolysis of Chlorella biomass for fermentable sugars. Bioresour. Technol. 2012, 118, 512–517. 31. Guimarães, P.M.R.; Teixeira, J.A.; Domingues, L. Fermentation of lactose to bio-ethanol by yeasts as part of integrated solutions for the valorisation of cheese whey. Biotechnol. Adv. 2010, 28, 375–384. 32. Kasavi, C.; Finore, I.; Lama, L.; Nicolaus, B.; Oliver, S.G.; Toksoy Oner, E.; Kirdar, B. Evaluation of industrial Saccharomyces cerevisiae strains for ethanol production from biomass. Biomass Bioenergy 2012, 45, 230–238. 33. Nerantzis, E.T.; Logothetis, S. Method for Yeast Viability and Alcohol Productivity. Greek Patent (Hellenic-Industrial-Property-Organisation) 1005698, 22 October 2007. Available online: http://www.obi.gr/obi/?tabid=127&idappli=X280170 (accessed on 2 August 2013). 34. DuBois, M.; Gilles, K.A.; Hamilton, J.K.; Rebers, P.A.; Smith, F. Colorimetric method for determination of sugars and related substances. Anal. Chem. 1956, 28, 350–356. 35. Miller, G.L. Use of dinitrosalicylic acid reagent for determination of reducing sugar. Anal. Chem. 1959, 31, 426–428. 36. Prencipe, L.; Iaccheri, E.; Manzati, C. Enzymic ethanol assay: A new colorimetric method based on measurement of hydrogen peroxide. Clin. Chem. 1987, 33, 486–489. © 2013 by the authors; licensee MDPI, Basel, Switzerland. This article is an open access article distributed under the terms and conditions of the Creative Commons Attribution license (http://creativecommons.org/licenses/by/3.0/).