CEDR Transnational Road Research Programme Call 2012: Noise: Integrating strategic noise management into the operation and maintenance of national road networks funded by Belgium/Flanders, Germany, Ireland, Norway, Sweden, United Kingdom
QUESTIM Cost/benefit analysis and Life Cycle Costing of noise mitigation measures and methodology for implementation into pavement management systems Deliverable 5.1, June 2014
QUietness and Economics STimulate Infrastructure Management
Partners: M+P consulting engineers (coordinator) (NL) Transport Research Laboratory (UK) Müller-BBM GmbH (D) Aalto University (SF)
CEDR Transnational Research Programme: Call 2012
This page is intentionally left blank
Final Report 2
CEDR Call 2012: Noise
CEDR Call2012: Noise: Integrating strategic noise management into the operation and maintenance of national road networks QUESTIM: QUietness and Economics STimulate Infrastructure Management
Cost/benefit analysis and Life Cycle Costing of noise mitigation measures and methodology for implementation into pavement management systems Due date of deliverable: 30.06.2014 Actual submission date: Draft submission: 31.07.2014 Final submission: 18.12.2014
Start date of project: 01.02.2013
End date of project: 31.07.2014
Author(s) this deliverable: Tom Buckland and Matthew Muirhead, TRL, United Kingdom Quality Review: On behalf of the Author's Institute Author:
Name
Matt Muirhead
Signature
Technical Reviewer:
Name
Mike Ainge
Signature
Version: Final Report, December 2014
Final Report
CEDR Call 2012: Noise
This page is intentionally left blank
Final Report 2
CEDR Call 2012: Noise
Table of contents Executive summary ............................................................................................................... iii 1 Introduction and background .......................................................................................... 5 1.1 Objectives of WP4................................................................................................... 5 1.2 Structure of the report ............................................................................................. 6 2 Systems, data and processes......................................................................................... 7 2.1 Pavement Management Systems............................................................................ 7 2.1.1 Existing systems .............................................................................................. 7 2.1.2 Level of operation............................................................................................. 8 2.1.3 Identified gaps.................................................................................................. 8 2.2 Whole-life costing.................................................................................................... 8 2.3 Externalities ............................................................................................................ 9 2.4 Whole-life value..................................................................................................... 10 3 Noise............................................................................................................................ 13 3.1 Introduction ........................................................................................................... 13 3.2 Mitigation............................................................................................................... 14 3.3 Modelling noise impacts ........................................................................................ 15 3.4 Costing noise impacts ........................................................................................... 16 4 Integrating noise into a PMS ........................................................................................ 19 4.1 Base model ........................................................................................................... 19 4.2 Consultation .......................................................................................................... 21 4.3 Treatment options ................................................................................................. 22 4.3.1 How can noise fit into treatment identification?............................................... 22 4.3.2 How can noise fit into treatment options? ....................................................... 23 4.4 Developing a noise reporting mechanism.............................................................. 24 4.4.1 Available data – Noise maps .......................................................................... 25 4.4.2 Available data - Noise costs ........................................................................... 31 4.4.3 Derived data - Noise change values............................................................... 32 4.4.4 Derived data - Trigger rules............................................................................ 39 4.4.5 Calculating benefits........................................................................................ 40 4.5 Summary............................................................................................................... 43 5 Case study ................................................................................................................... 45 5.1 Data ...................................................................................................................... 45 5.2 Base model ........................................................................................................... 45 5.2.1 Model capabilities........................................................................................... 48 5.3 Case study setup .................................................................................................. 49 5.3.1 N4 analysis setup........................................................................................... 55 5.4 Case study results................................................................................................. 55 5.4.1 Base model analysis ...................................................................................... 55 5.4.2 Adding noise costs to the scheme costs......................................................... 59 5.4.3 Allowing the selection of a specific noise treatment option ............................. 61 5.4.4 Forcing a choice between the Do Minimum and a low-noise Do Something... 63 5.5 Summary............................................................................................................... 65 6 References................................................................................................................... 67 Appendix A: Reviewed systems .......................................................................................... 71 Appendix B: Pavement Management Systems and noise: Information request ................... 73 Appendix C: WebTAG Noise cost data................................................................................ 77 Appendix D: Noise methodology example ........................................................................... 79
Final Report i
CEDR Call 2012: Noise
This page is intentionally left blank
Final Report ii
CEDR Call 2012: Noise
Executive summary With increasingly restricted budgets, road authorities are being required to manage their existing networks with greater efficiently in order to keep the roads in a serviceable condition and meet the expectations of their stakeholders. An increase in the disparity of the demands on highway assets and the availability of resources is becoming a world-wide issue. Good quality asset management and appropriately designed systems can help to manage this disparity and enable highway authorities to make more robust decisions. It is widely accepted that significant resources need to be spent managing the pavement networks throughout their lives because they are a key asset for any highway authority. Cost-benefit modelling and whole-life costing are established methods that are used within asset management to assist the road authorities and support the decisions they make. These methods use road network data to analyse the impacts of different investment scenarios in order to build a programme of work that best meets the policies and objectives of an organisation. There is a growing importance being placed on the role of environmental considerations within these systems and this work package presents a methodology for integrating noise into such a Pavement Management System (PMS) and the data required, before demonstrating the inclusion of noise through a case study. In addition, examples on developing an appropriate dataset are described, although it is expected that datasets should be localised where possible (e.g. referencing the specific pavement surfaces used on a local network). One clear area for improvement with this data is in being able to determine a ‘per km’ noise value for individual sections of a road which is not possible with the current data. The noise data used to build up the noise datasets for this methodology (e.g. noise change values) were documented so that when new noise data become available they can be substituted into the process to create more up-to-date noise datasets. The types of questions that can be investigated using this methodology are: •
What are the implications on a road maintenance programme between the different choices of noise surface available?
•
If low-noise surfaces are selected at times of maintenance what are the implications on developing a maintenance programme?
•
What are the longer-term effects (e.g. the timing and number of future interventions) when choosing low-noise surfaces for maintenance?
The noise methodology developed can help a road authority develop a greater understanding of the impacts from these types of questions, especially when compared to a
Final Report iii
CEDR Call 2012: Noise
more traditional approach that doesn’t include externalities alongside the direct works costs when developing a maintenance programme.
Final Report iv
CEDR Call 2012: Noise
1 Introduction and background Pavement networks have developed significantly over the last century (e.g. in terms of design, size) and coupled with the advances in road transport, their growth and improvement has led to a dramatic increase in the movement of people and goods. The importance of these networks within the wider economy is significant. Investment not only benefits the economy but it also promotes better access and integration for society, leading more generally to improvements in standards of living (ERF, 2006). Conversely, without suitable investment and management the networks can deteriorate to levels which can result in adverse impacts. With increasingly restricted budgets, road authorities are being required to manage their existing networks with greater efficiently in order to keep the roads in a serviceable condition and meet the expectations of their stakeholders. An increase in the disparity of the demands on highway assets (increasing) and the availability of resources (decreasing) is becoming a world-wide issue. This has the potential to lead to a greater deterioration of the asset (Flintsh and Kuttesch, 2002). Good quality asset management and appropriately designed systems can help to manage this disparity and enable highway authorities to make more robust decisions. It is widely accepted that significant resources need to be spent managing the pavement networks throughout their lives because they are a key asset for any highway authority. Cost-benefit modelling and whole-life costing are established methods that are used within asset management to assist the road authorities and support the decisions they make. These methods use road network data to analyse the impacts of different investment scenarios in order to build a programme of work that best meets the policies and objectives of an organisation. There is a growing importance that is being placed on the role of environmental considerations within these systems and this work package looks at how noise can be incorporated into a Pavement Management System (PMS) and the principles of whole-life costing. It considers the data required and demonstrates the inclusion of noise through a case study. The full objectives of the work package are outlined in Section 1.1 and the structure of the report is explained in Section 1.2.
1.1 Objectives of WP4 This work packeage aims to provide: •
A review of existing cost-benefit mechanisms with an emphasis on noise mitigation
•
An understanding of the structure of existing cost-benefit and life-cycle cost models used to inform policy on strategic road networks
•
The development of a state-of-the-art cost-benefit analysis methodology to assess
Final Report 5
CEDR Call 2012: Noise
mitigation measures at a scheme level •
Ways in which noise mitigation measures can be integrated into strategic models and pavement management systems to help inform long-term planning
It is important to note that the focus is on the development of an appropriate approach for considering noise impacts within the structure of a PMS to help answer questions on the ramifications of mitigation options. It is not the purpose of the work package to provide detailed technical recommendations on the integration of noise data to a PMS since these will vary wildly depending upon the level of noise data available, the level of noise data and validation considered necessary for the decision support process and the format of the PMS being used for the cost-benefit analysis.
1.2 Structure of the report The report is structured as follows: •
Chapter 2 introduces the concepts of a PMS and whole-life costing. It presents the key definitions and aims of these systems and methodologies, including how they deal with externalities such as environmental factors like noise.
•
Chapter 3 provides a brief overview of the main methods of modelling, costing and mitigating noise giving context to its inclusion in a PMS and highlighting how this would add to existing methods of approaching traffic noise on National road networks.
•
Chapter 4 covers the main topic of how noise could be integrated into a PMS so that, for example, different treatment options can be evaluated, and the corresponding data requirements.
•
Chapter 5 pulls together the ideas from Chapter 4 into a case study on the integration of noise and evaluation of treatment options within the context of network maintenance.
Final Report 6
CEDR Call 2012: Noise
2 Systems, data and processes 2.1 Pavement Management Systems A Pavement Management System (PMS) is an asset management system specifically for road pavements and is one of the key tools for road asset management used by many highway authorities. A well-managed and well-maintained asset management system can help make best use of the available resources to meet the needs of both the managing organisation and the users. The same is also true of a PMS used by a highway authority. A PMS is commonly used to store data about a road network (e.g. inventory, condition, traffic) and apply rules to that data to identify sections that need maintenance and prioritise the maintenance sections against any given time or budget constraints. However, the variation in both the characteristics of a pavement network and the surveyed data means that there is not one overall assessment approach or set of algorithms that can be universally applied to a pavement network. Among other things, data is required to enable engineers to: •
Identify when and where maintenance is needed;
•
Make decisions on the type of maintenance intervention that will provide the best return on investment;
•
Plan the maintenance at times that cause the least inconvenience to road users, allowing the networks to be kept operational more of the time; and
•
Better understand the impacts (positive and negative) of the road pavement networks.
2.1.1 Existing systems The asset management systems available all address the common aim of providing decisionmaking support. Some systems are concerned with only one asset type (e.g. HDM-41 for road pavements) while others can be used across multiple asset types (e.g. dTIMs2, whose use has included road pavements, bridges, water and safety systems). The main focus of systems and literature reviewed was from the UK, Europe, United States, Australia and New Zealand. A list of the systems reviewed is in Appendix A: Reviewed systems. Generally two categories of systems exist on the market: •
1 2
General application systems; or
http://www.hdmglobal.com/default.asp http://www.deighton.com/dtims9.html
Final Report 7
CEDR Call 2012: Noise
•
Bespoke application systems.
General application systems, or 'off-the-shelf' solutions, can be misleading in their name because they often require significant effort in being calibrated against local data and local conditions. The bespoke systems tend to be built for specific needs and data, and again are therefore calibrated for local conditions. However, due to their bespoke nature, if often means that the customised rules and algorithms are not suitable for use on other networks. The degree to which the models fit into one of these categories is however ambiguous and significant effort is required for either approach. The quality and quantity of the data is the factor that normally exerts the greatest influence on the level of calibration obtainable.
2.1.2 Level of operation The most common level of operation of existing systems is at a network level (e.g. a road network is usually represented by a number of uniquely labelled sections which together form a network). There are some systems that operate at both the network and project level but what is unclear from the published information is if the same methodology (e.g. deterioration rules, treatment rules, scheme prioritisation) is used at both levels in those systems.
2.1.3 Identified gaps The review of models also highlighted gaps in the current systems on the market: •
There is limited inclusion of environmental issues within the modelling. HDM-4 has the option of including emissions, energy and noise but these inputs are far from common and most systems do not make reference to environmental criteria. In HDM4 the vehicle emission pollutants are estimated as functions of the characteristics of the road, traffic levels, vehicle type and fuel consumption. Although these values are calculated, they are not included in the economic evaluation (World Bank, 2008);
•
The majority of current modelling frameworks require the user to already have selected locations where maintenance is to be considered. That is, the system is used to select the best treatment for sites chosen by the user, rather than selecting its own sections for maintenance; and
•
Often the condition of the maintenance sites is represented in a simplified way, e.g. using single values for each of the defect parameters for the entire site. Using all the raw surveyed data would likely result in slow analysis times, but a more comprehensive representation of changing condition along a section would provide a closer representation of reality.
2.2 Whole-life costing The concept of whole-life costing is a well-developed concept for use in project appraisals for a range of disciplines. It is defined as an assessment of the costs over the life of an asset or product (Flanagan and Norman, 1983; Kirk and Dell'Isola, 1995). A significant proportion of the total costs of an asset are incurred during the life of the asset and the magnitude and profile of the future costs are influenced by the initial investment decisions. Making well
Final Report 8
CEDR Call 2012: Noise
informed decisions at the time of construction can lead to markedly different cost profiles during the remaining life of the service of the asset (Dale, 1993; Sinhal et al., 2001; Hooper et al., 2009). Therefore robust appraisals need to consider both the initial and future costs. In BS ISO 15686-1 (2000) whole-life costing is defined as "a technique which enables comparative cost assessments to be made over a specified period of time, taking into account all relevant economic factors both in terms of initial capital costs and future operational costs." Through the assessments that the standard recommends, it aims to ensure that a constructed asset will at least be operational and affordable for its design life by not selecting options that have low initial costs but unmanageable future costs. By promoting techniques to optimise the analysis of costs, service life planning has an increasingly crucial role to play by producing information that allows informed choices to be made at the outset of assessments. The principles of whole-life costing are well established; at the time of investment, if consideration of different options is restricted by only including the initial costs then it is unlikely that the option will return an efficient spend over the long-term life and this has been discussed in a number of studies (e.g. Flanagan and Norman, 1983; Bowskill and Abell, 1994; Hooper, Armitage, Gallagher and Osorio, 2009). The need to appraise alternative options on the basis of whole-life cost is now accepted as 'good practice'. Whole-life costing works well as a principle because money in general provides an objective mechanism for comparing costs of dissimilar items (Robinson, Danielson and Snaith, 1998). However, it can be time consuming to obtain accurate cost data for use in detailed analyses, partly because organisations are protective of cost data. The costs used are generally direct costs (e.g. materials, labour) which are more readily available than indirect costs (e.g. health impacts), explaining the traditional exclusion of social benefits or the environment in these models. For example, the only indirect cost considered in the majority of current pavement whole-life cost models is the cost of delays that road users experience (either due to maintenance or accidents). However, pavements affect the wider society (e.g. delays, gaseous emissions) and so any maintenance decisions needs to recognise that externalities may also be affected.
2.3 Externalities An externality is a cost or benefit that is encountered by a person or party who is not the originator of the economic action (Bishop, 2004). It is normally considered with respect to effects on the wider society, who are affected the outcome of a change of decisions in which they may not have direct involvement. A positive externality provides benefits to society, for example keeping bees can lead to added benefits due to the role they play in pollination in the wider area. Conversely, a negative externality imposes costs on society, for example pollutants released into the atmosphere can impact upon societal health and well-being.
Final Report 9
CEDR Call 2012: Noise
The rapid growth of economies over recent decades, as well as an increased awareness of the wider impact of actions, has meant that pressure to reduce impacts on the environment has increased. There is greater appreciation of the need for decisions taken today to give consideration to minimising impacts on the environment and transport has been identified as a key area in which the effects of externalities need to be considered (e.g. Hormandinger and Lucas, 1996; Bickel, Friedrich, Link, Stewart and Nash, 2006). Road transport is a key area within the transport sector. For more than a decade, a stated objective of the European Commission (European Commission, 2000; European Commission, n.d.) has been to include the costs of externalities within any assessment of the costs of transport. This is to ensure that the full economic costs of actions and consequences for the whole society are considered in any appraisal of transport investments. Delays to road users is one example where there had been a common acceptance of their inclusion within the appraisal process. The main transport cost components commonly discussed for inclusion as externalities are: •
Congestion - a measure of the delays experienced by road users;
•
Traffic accidents - the impact of road accidents;
•
Air pollution - the effects on local air quality;
•
Noise pollution - the annoyance and health effects of road and traffic noise;
•
Climate change - the effects of greenhouse gas emissions on global air quality and wider climate indicators;
•
Nature and landscape - the damage to natural habitats and visual intrusion on the landscape; and
•
Soil and water quality- the impact of runoff from roads into water bodies and the surrounding land.
2.4 Whole-life value Value for money is defined by the Office of Government Commerce (OGC, 2007) as "…the optimum combination of whole-life cost and quality to meet the user's requirements." Whole-life value (WLV) assessments include factors that drive value and consider more than just the 'direct' costs. It is an extension of whole-life cost (WLC), where WLC aims to identify the minimum cost over a defined life. WLV can include additional benefits over WLC (Bourke, et al., 2005): •
Stakeholder involvement;
Final Report 10
CEDR Call 2012: Noise
•
Whole life planning, whilst also giving rise to innovation; and
•
Sustainable development.
In comparing whole-life cost approaches for different pavement analysis tools there is a common agreement of the costs that are included in the economic appraisals. However, road agency objectives change, and the current position centres on giving consideration to what best meets the needs of all those involved not just what is the lowest cost. To meet those changing objectives whole-life costing will need to be replaced by a broader, but no less rigorous assessment of whole-life value. One of the challenges to overcome for the inclusion of 'externalities' within an investment appraisal process is the need to express 'value' as a comparable measure (e.g. monetary term) so that comparable assessments of investment options can be made (Hofstetter and Muller-Wenk, 2005). Monetisation, in this context, is complicated as the impacts of the externalities can be different for different stakeholders. Defining value in monetary terms will need to take account of aspects such as: •
Stakeholders' understanding and concern about the impacts;
•
Knowing which stakeholders are affected and how;
•
The cost to society due to the impacts; and
•
Society's willingness to pay to mitigate the impacts.
Noise is one of the key transport externalities currently discussed for inclusion within option appraisals but there is still a lack of recognised approaches at either a scheme or a network level, especially where a quantitative (or costed) methodology is desired.
Final Report 11
CEDR Call 2012: Noise
This page is intentionally left blank
Final Report 12
CEDR Call 2012: Noise
3 Noise 3.1 Introduction Environmental noise is a significant problem and a major concern for public health and annoyance in Europe. According to the recent WHO-JRC report on the burden of disease from environmental noise (WHO, 2011), traffic-related noise may account for over one million healthy life years lost per year in the EU and other Western European countries. Urbanisation and a steep increase in traffic are the main drivers of escalating environmental noise exposure in Europe. The social costs of traffic, rail and road noise across the European Union were recently estimated at €40 billion per year, equivalent to 0.35% of the EU's GDP. According to the European Commission's 2011 White Paper on Transport, the traffic noise-related external costs will increase to roughly €20 billion by 2050, unless further action is taken. From the perspective of NRAs, it is noise from road traffic that is the source of concern. Noise levels at noise sensitive receivers will be heavily influenced by factors such as traffic volume, composition, speed and proximity. Many governments/road authorities have their own national guidelines or legislation for controlling road traffic noise. These may include approaches such as •
Type-approval legislation governing the permissible noise from new vehicles to be sold in the country
•
The mandatory evaluation of the potential noise impacts for new schemes, leading to enforcement of environmental noise limits/thresholds
•
Taxation policy
•
Noise mitigation policies for new or improved road schemes.
Additionally the introduction of the Environmental Noise Directive (EC, 2002) has sought to address noise pollution by requiring Member States to determine exposure to environmental noise through strategic noise mapping and action plans to reduce noise pollution. This information also serves to inform the general public about the levels of noise they are exposed to and about actions undertaken to reduce noise pollution to a level not harmful to public health and the environment. The noise maps and action plans are produced on a five year cycle and it is anticipated that future cycles may well use the CNOSSOS-EU noise model (Kephalopoulos et. al., 2012). Sections 3.2 to 3.4 give a brief overview of mitigation measures, modelling noise impacts and costing noise impacts respectively in order to provide some background on the factors which are being considered for implementation in a PMS (see Chapter 4Error! Reference source not found.).
Final Report 13
CEDR Call 2012: Noise
3.2 Mitigation The most common mitigation measures used by the majority of NRAs are road surfaces and noise barriers. The former addresses noise mitigation at the source, while the latter acts on the noise propagating from the road to noise sensitive receivers. A wide range of studies have been undertaken to investigate and understand the influence of road surfaces on road traffic noise or to develop new and innovative surface solutions. These research initiatives cover topics such as the acoustic classification of surfaces (Padmos et al, 2005), the performance of two-layer porous asphalt surfaces and thin layer surfaces (the Dutch IPG (Innovatie Programme Geluid) programme; Morgan, 2008), developing the experimental concept of poro-elastic road surfaces into a feasible noise mitigation measure (PERSUADE; persuade.fehrl.org), the performance of road surfaces over time (Chandler et al, 2003; Muirhead et al, 2010; van Blokland et al, 2014a) and the monetisation of such impacts (Veisten and Akhtar, 2011). A comprehensive review of all of these programmes is not required here, suffice to say that sufficient data exist which can readily be incorporated into a PMS as part of the assessment of this potential mitigation measure. In terms of whole-life cost analysis it is important to consider not just the noise level at construction or when a pavement surface is new, but also the degradation of noise level through the life of the pavement. Within QUESTIM, WP2 assesses the acoustic durability of low-noise surfaces and develops an acoustic degradation formula, based on a thorough review of existing data, which would be appropriate for inclusion within a PMS (van Blokland et al, 2014a). Noise barriers are a widely used form of noise mitigation on European roads and within QUESTIM, WP4 has assessed the acoustic durability of noise barriers and assessment techniques (Morgan, 2014). As part of the development of European Standards, standardised tests have been developed for characterising their acoustic performance. These test methods focus on intrinsic and not extrinsic characteristics of performance, i.e. the performance of the individual materials or components rather than on how the product is used. It has been concluded in WP4 (Morgan, 2014) that the addition of lifetime acoustic performance data for noise barriers within a PMS is not feasible or beneficial due to the lack of existing data and the difficulties of relating intrinsic characteristics to far-field noise levels in a manner that could be simply implemented without any noise mapping/modelling. However, the use of a PMS as a broader data repository for noise barrier records, so that asset information is held within a common location is recommended and (within WP4) proposals are set out for the type of data that could potentially be incorporated. Of the 19 NRAs who responded to the QUESTIM noise barrier survey, 13 use noise barriers as their primary mitigation measure, 5 use low-noise surfaces and one uses façade insulation. In addition to these primary noise mitigation measures, which may fit directly into a PMS, there are other measures which have the potential to have either a direct or indirect benefit to road traffic noise but whose integration into a PMS is not explicit.
Final Report 14
CEDR Call 2012: Noise
These measures include type-approval noise limits for vehicles (revised levels for which have just been agreed by the European Commission, see http://ec.europa.eu/enterprise/sectors/automotive/environment/noise/index_en.htm), Intelligent transport Systems (ITS) used to control the speed and flow of vehicles on busy roads and restrictions on Heavy Good Vehicles at certain times of day such as the London Lorry Control Scheme (www.londonlorrycontrol.com). Some of these measures are investigated in more detail within the CEDR funded DISTANCE project.
3.3 Modelling noise impacts In addition to the strategic noise mapping performed under the END, as mentioned in Section 3.1, it is often necessary to model and assess traffic noise impacts associated with proposed changes to road networks. This might be, for example, to assess entitlement to noise insulation or compensation, to determine the required level of mitigation for the scheme or to understand the change in noise climate brought about by the change to the road network. These assessments follow national guidance on permitted environmental noise levels and tend to use national calculation methods. Such methods are often quite complex, requiring detailed spatial, topographical and traffic data in order to perform the calculations; see for example (Morgan and Nelson, 2000) for a review of methods used at that time. Although such calculations can be quite comprehensive they are largely reactive rather than proactive in their assessment in that they are used to estimate the noise climate arising from a pre-defined change to the road network. Sometimes they will be used to consider different mitigation measures or even small adjustments to the road layout but even then the results are rarely integrated with either other factors such as journey time improvements, maintenance and safety requirements (scheme level) or the potential benefits of alternate changes to other parts of the road network (strategic level). For example, in a practical application, Kent Highway Services (2008) produced a method for prioritising their investment on using quieter surfacing options. They acknowledged they had no influence on tyre choice or engine noise and therefore their focus on vehicle noise was by including the road surface noise as a measure in maintenance prioritisation. For different maintenance scenarios the total number of people bothered was determined across the scenarios, and the cost of the maintenance was divided by reduction in the number of people affected by noise for each scenario. The proposed maintenance lengths were prioritised in the order of greatest noise benefit and lowest cost through to least noise benefit and highest costs. Therefore, although the externality was included within the prioritisation, it was still as a separate measure alongside the works costs (i.e. in a non-monetised approach for noise). It is the aim of integrating noise into a PMS to address many of these shortcomings but in doing so it would likely be computationally, logistically and time prohibitive to expect the enhanced PMS model to perform these detailed noise calculations. Therefore, when this issue is looked at in detail in Section 4.4, baseline noise data are taken from existing noise maps. This neatly circumvents the need for complex noise propagation calculations and allows the focus of the noise data to rest on determining the nature of potential mitigation options together with the number of people who are likely to benefit from such mitigation.
Final Report 15
CEDR Call 2012: Noise
Inevitably there are some short comings in this approach as the relative importance of various roads as components to the overall noise level may be lost and lower trafficked roads may not be modelled at all but it is important to outline the structure of the integration and consider the main differentiating factors first before addressing these concerns. This is discussed further in Section 4.4.1.
3.4 Costing noise impacts Noise is one of the environmental impacts that road agencies may assess in a quantitative way. For modelling the cost impacts of noise within pavement life cycle analyses a number of approaches have been documented. The Noise Sub-Objective (DfT, 2012a) (which forms part of the WebTag guidance from the Department for Transport, UK) advises that if there are data available on either the number of properties or people affected by noise changes then a valuation study should be attempted. Whilst there is some evidence for the detrimental effect transport noise can have on health through mechanisms such as annoyance, heart disease, stress, sleep disturbance and cognitive development, see (Clark and Stansfeld, 2007), many of the findings are inconclusive and further work is needed before the magnitude of such potential effects can be determined. Therefore the most common approach at present for valuing transport noise is through the use of hedonic pricing studies, although other approaches are available for developing noise costing datasets. Hedonic pricing studies estimate the monetary value of property characteristics by looking at the differences people pay for properties that exhibit different characteristics, noise being one of the characteristics, see for example (FEHRL, 2006a). There may be a number of reasons for a difference in price between properties and so all factors that might influence the property price need to be examined (e.g. proximity to transport links, good schools, size etc). There have been many pricing studies with the aim of using market prices to deduce the expected reduction in property value for an increase of 1 dB(A) (Table 3-1).
Table 3-1: Property price reductions due to noise Research
Reduction (%)
Lake, Bateman, Day and Lovett (2000)
0.20
Noise & Vibration Worldwide (2004): Average
0.20
Noise & Vibration Worldwide (2004): US specific
0.08-2.22
Noise & Vibration Worldwide (2004): Canada specific
0.42-1.05
Noise & Vibration Worldwide (2004): Norway specific
0.21-0.54
Noise & Vibration Worldwide (2004): Japan specific
0.70
Noise & Vibration Worldwide (2004): Switzerland specific
0.90
Noise & Vibration Worldwide (2004): Australia specific
Final Report 16
1
CEDR Call 2012: Noise
Research
Reduction (%)
Noise & Vibration Worldwide (2004): Finland specific Hofstetter and Muller-Wenk (2005)
0.36 0.6-1.2
Nelson (2007)
0.54
Litman (2009)
0.5
Brandt and Maennig (2011)
0.23
Nijland and Wee (2008) state that people are not normally aware of the impacts of noise beyond general annoyance (and possibly sleep disturbance). Therefore it is only essentially these factors that determine the monetary value when based on market preferences, meaning the true cost of noise could be even higher. Whatever the differences are within the estimates of the cost of noise, the sheer scale of the issue and the need to address it is clear. In Switzerland the external cost of noise has been estimated at over CHF 1 billion per year, with 90% of that attributed to reduced property prices and 10% to the cost of health impacts (Muller-Wenk and Hofstetter, 2003). Differences in the threshold level for measuring noise and interpreting its effects will also impact any derived costs. Nijland and Wee (2008) stated that the usual threshold at which noise impacts were considered is 50 dB or above, although this is far from consistent. For example, the UK use a threshold of 45 dB, and France and the Netherlands use 55 dB; this difference in thresholds might also be important if data or rules are transferred for use elsewhere because the effect on hedonic pricing of increased noise levels is not consistent. An increase from a higher noise level has the potential to cause a sharper decrease in property price (Kruitwagen, Udo and Janssen, n.d.). When undertaking analyses in a PMS using noise data, sensitivity tests should be completed to test the sensitivity of any results to changes in the noise costs used (e.g. to test the robustness of the analysis to specific costs used from any pricing studies).
Final Report 17
CEDR Call 2012: Noise
This page is intentionally left blank
Final Report 18
CEDR Call 2012: Noise
4 Integrating noise into a PMS Whilst there are stand-alone tools available that can be used for a preliminary assessment of some environmental elements at the project level, there is a lack of consistent methodologies and robust tools both at the project and at the network level. For example, there are tools for the assessment of the environmental impacts of construction and maintenance of various assets but they have generally been designed to be complementary to a costing process and not as methodologies to be incorporated into wider cost assessments. Pricing noise internally within a network level pavement maintenance model will advance our understanding of how the impacts of these externalities can influence the overall cost and the development of strategies for road maintenance programmes. However, from a practical point of view few models routinely include monetised estimates of environmental effects. Overall, although methods exist to help monetise externalities, no one method is documented as the most appropriate to use. In any method, if data from other studies are used consideration should be given to how the prices have been derived and whether they are influenced by any groups (e.g. pressure groups), resulting in deflation or inflation of the prices (Boiteux, n.d.). In this report, central government costs were used as opposed to traneferring costs from other local studies. This chapter describes the process undertaken to integrate noise into a PMS, first starting with a description of the ‘base’ PMS (i.e. the developed model without noise incorporated).
4.1 Base model The base model was designed as a computer-based data-representation of a road network and the data fields and interactions were important in the development. There were two databases that the base model was designed to use, reflecting the different data types, data sources and the frequency at which they would be updated in the future: 1. Network database: The network database is a representation of all the data required to model a road network, representing where the network is and what its associated condition is. This data is primarily gathered from surveys of the road network, most often machine based surveys. For the purpose of this model, network data can itself fall into one of three categories: •
Inventory: These data are used to determine where the roads are, what types of road they are (e.g. motorway, single-carriageway) and characteristics of a road that are generally fixed and do not change until a major upgrade occurs (e.g. number of lanes, road widths, road lengths);
•
Condition: These data are a representation of the condition of the network following surveys of the road network (i.e. measured condition data from machine or visual surveys). Ideally the model should use the most recent survey data for all lengths of the network and therefore these data are updated more frequently than other data sources, depending on the survey frequency completed (e.g. a monthly basis would not be unreasonable for machine surveys). Examples of the
Final Report 19
CEDR Call 2012: Noise
condition data that would be held in this database could range from rutting, longitudinal profile or non-road profile condition data such as noise; and •
Traffic: These data are for the traffic flows on the network. It is usually collected by automatic traffic counters embedded in the road surface or from overhead gantries, but it can also be obtained by manual count exercises. Traffic data are usually assigned to fixed points on a network and those traffic counts are applied across the whole network by assigning the count locations to other locations of similar characteristics.
2. Reference database: The reference database contains values that act as defaults for lookup values used in model calculations. The reference data are primarily used to select default run parameter data selected through the model interface. The referenced data are not usually updated more frequently than on an annual basis, and some data fields (e.g. discount rates) may be updated only when associated high-level guidance documents are updated. The data types held in the reference data are default values for: •
Deterioration rates for the condition parameters;
•
Maintenance thresholds;
•
Treatment parameters (e.g. road types where specific treatments are allowed, thickness, new surface type);
•
Treatment triggers (i.e. the condition parameters that can trigger specific treatments if thresholds are exceeded);
•
Unit costs (e.g. for the works);
•
Working patterns (i.e. whether closures for maintenance are 24 hour, off-peak only or night-only);
•
User delay costs (depending on closure type, working pattern and traffic flow);
•
Closure types;
•
Homogenisation correlation values, used to compare a calculated homogenisation statistics against to determine if sections are suitable grouped for homogenisation;
•
Display names (e.g. full county names and not abbreviated names as stored in some database tables);
•
Carriageway types;
•
Default data (i.e. data used to fill gaps where survey data are missing or used to reset condition parameters following a treatment);
Final Report 20
CEDR Call 2012: Noise
•
Network class (i.e. whether a road is a primary or secondary road); and
•
Surface types.
Additional reference data was incorporated into the reference database later for the noise methodology: •
Unit costs for noise emissions; and
•
Noise change values (i.e. the change in noise when replacing one surface type with a new one of either the same or a different type).
The principal aim of the base model is that it allows comparison of maintenance appraisals across a selected network considering both the initial works and additional delay cost of each option and the future whole-life costs. The model was developed on that basis and uses the data accordingly to allow maintenance strategies to be created and compared. As new reference data become available (e.g. noise costs, noise deterioration) the reference database should be updated so that any analyses make use of the latest available data. The network database and reference database link into a workspace are used as the input into the data setup. This process allows the specific data for the particular model run to be grouped together into more efficient run-time tables (i.e. only including data records for the current network being analysed to make data sorting, analysis etc. quicker). The model subsequently works through all processes in turn in order to complete an analysis. The outputs from the model provide input to network management programmes that a road authority has to develop based on determining where the condition dictates that maintenance is required to deliver agreed objectives.
4.2 Consultation A consultation document was sent out to member partners to gather their wider views on noise and its integration in pavement management systems. A copy of the information request that was circulated can be found in Appendix B: Pavement Management Systems and noise: Information request. The consensus of opinion agreed with the circulated positional note on noise in pavement management systems. That is, for the responses received (from England, Ireland and Norway) pavement management systems are used but the consideration of costs is primarily focussed on direct costs and no system included noise as a parameter used in costing. The responses agreed that the systems employed are generally flexible enough that additional parameters could be incorporated in the future and the response from England stated that it is an aim that noise data is considered in the future in asset management and associated systems.
Final Report 21
CEDR Call 2012: Noise
Noise mapping has been completed by the three agencies who responded to the consultation but only limited use has been made of the resulting data (e.g. identifying road sections for noise reducing pavements on a trial basis). Noise management is considered important for maintenance and improvement but noise levels are not routinely considered as part of the pavement management process. It was stated that better care needs to be made of maintaining the noise reducing elements already in place on existing roads and it was suggested in one response that this could include identifying sections which would benefit from a low-noise surface. A cost-benefit analysis that included these maintenance types and decisions in its appraisal would allow appropriate sections to be flagged in a pavement management system. Therefore, there was a clear gap for a methodology that allowed for noise to be incorporated as a parameter for including in cost-benefit analyses in pavement management systems.
4.3 Treatment options 4.3.1 How can noise fit into treatment identification? Parameters used for modelling fall into either one of, or both of the following categories: •
Driver of maintenance; or
•
Reporting function of maintenance.
A parameter that is a driver of maintenance needs at least one defined attribute (or value) to set thresholds for maintenance, which can be linked to specific treatments to address that particular defect. Rutting or unevenness are examples of maintenance drivers. A parameter that is a reporting function is used to calculate an effect of the selected maintenance option, which can also be used to prioritise the maintenance. Cost is an example of a reporting function used in the prioritisation process. In developing methodologies for the externality of noise the first step was to determine which category the new parameter belonged to because it has implications for how noise is treated in the model. In determining treatments highway authorities have current guidelines for noise assessment and mitigation. Although these guidelines are primarily for new construction the growth in noise mapping demonstrates the growing importance of noise. Noise is only a direct driver in a small proportion of schemes but stakeholders did recognise that noise was growing as an issue. As both the debate around noise mapping and people’s awareness grows, the methodology therefore needed to reflect that a growing number of future maintenance needs are likely to involve noise.
Final Report 22
CEDR Call 2012: Noise
Table 4-1: Maintenance drivers and reporting calculation status for noise Driver
Reporting calculation
Noise
4.3.2 How can noise fit into treatment options? One of the key inputs in deciding how to incorporate noise into the modelling methodologies is in identifying the potential questions and outputs a model would be expected to address. For example, a highway authority might currently be interested in the impact of a maintenance programme that minimises delays to road users or one that selects the lowest cost option. A natural extension of this for noise is to give the model the ability to ask what the outcome would be if only the lowest noise options were chosen when developing a maintenance programme. Regardless of the actual externalities modelled, the Do Minimum option has to reflect maintaining a base level of safety as required on the network. Noise does not have a role to play in determining minimum safety levels and therefore the maintenance requirements and impacts of the Do Minimum option remained unchanged. Because noise is deemed to be a potential driver of maintenance, that meant creating an additional Do Something option that could be used when triggered solely by a noise defect (i.e. a low-noise option). If no condition defects would have led to a maintenance intervention but the noise is above an allotted threshold, the noise Do Something treatment would therefore get selected. Each required Do Something treatment is still triggered by set engineering standards that a highway authority adheres to but for each identified maintenance scheme there are additional options for that treatment that reflected: •
A standard approach (i.e. not a low-noise surface, although a new surface replacing an old one is still expected to generate initial noise savings); and
•
A low-noise approach (i.e. a low-noise surface that delivers enhanced noise savings, but has a shorter expected life and therefore more frequent interventions).
In order for the additional Do Something option to show differences between the resulting treatment profiles (and associated impacts on the network) attributes were associated that could be used to model the expected differences in whole-life performance and outputs: •
Unit cost – with each treatment having a different cost associated it allowed the whole-life cost of each treatment profile to be assessed, and allowed the unit works cost of the treatment to be balanced with the other factors listed (i.e. trying to bring additional factors into the modelling and decision making process);
Final Report 23
CEDR Call 2012: Noise
•
Expected life – each treatment having a different expected life allowed questions to be modelled and investigated such as is it better to have a higher-cost treatment with long intervals between interventions, or a lower-cost more frequency maintenance regime; and
•
Noise reduction levels – the different treatments would result in a new specific surface type when used and the associated noise reduction would allow for different noise levels to be modelled.
The different values associated with the attributes result in different treatment profiles being generated between the options, allowing the impacts from those different profiles to be assessed. For example, the attributes allow documented shorter expected lives and higher costs to be associated with a low-noise treatment. The base model was enhanced to allow for these additional Do Something options for each treatment so that the complete list of options was as shown in Table 4-2.
Table 4-2: Model treatment options Driver
Noise
Do minimum
-
Do somethingstandard
Standard
Do somethinglow-noise
Low
In order to programmatically include the Do Something options for low-noise alongside the standard Do Something, and to get the most output from modelling these different treatment options, specific methodologies were developed for incorporating noise into the model as key data parameters.
4.4 Developing a noise reporting mechanism The noise methodology developed was based on using actual data available for a road network and used data from the Irish road network. The noise data for use in a PMS needs to reflect the network and analysis being undertaken. For example, if a scheme level analysis is being undetrtaken, detailed localised noise data are most appropriate if they are available. However, if a network level, strategic analysis is being undertaken then coarser level noise data will allow adequate modelling of policy senarios at a network level, especially considering that the detailed localised noise data are unlikely to be available for a whole network. The development of a methodology discussed making best use of available data. As such, European directive driven noise maps are suggested as a potential source of noise data that are likely to provide the best coverage across networks. However, other sources of noise data can be substituted in place of noise map datasets as long as the format provides a measure of the number of properties in different noise bands along the network.
Final Report 24
CEDR Call 2012: Noise
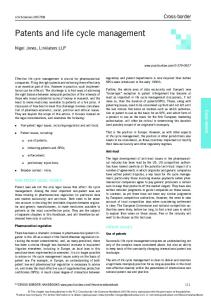
4.4.1 Available data – Noise maps 4.4.1.1 Level of data An early step in developing a methodology for modelling noise impacts of different maintenance treatments was identifying the noise data available to populate a suitable dataset for use in the modelling. The process to create such a dataset is discussed such that it can be applied by other road authorities who have compiled noise maps. The European Noise Directive (END) requires highway authorities of EU member states to map noise corridors on their road networks that meet a set of criteria. The first phase of the directive required noise to be mapped for trunk, motorway and classified roads which having more than 6 million vehicle passages per year (by 31st March 2007). The second phase widened the criteria so that the same road classifications having more than 3 million vehicle passages per year were required to be mapped (by 31st March 2012). The noise map for county Kilkenny, Ireland (Figure 4-1) shows the level of outputs from the latest phase of noise mapping undertaken in Ireland.
Final Report 25
CEDR Call 2012: Noise
Figure 4-1: Phase 2 noise mapping for county Kilkenny, Ireland (source: National Roads Authority, Ireland)
Final Report 26
CEDR Call 2012: Noise
The map shows the national and regional road network for the county and the lengths of the roads mapped are shown by the coloured shading on the maps. All data from the mapping is aggregated at a county level and displays, within set noise bands, the: •
Approximate number of people affected;
•
Approximate area affected; and
•
Approximate number of dwellings affected.
Other available measured noise data may be through direct measurements using Statistical Pass-By (SPB) or Close ProXimity (CPX) methods, see (ISO, 1997) and (ISO, 2000) respectively. If CPX data are available then QUESTIM WP3 (van Blokland et el, 2014b) discusses a method for weighting data which could be used to populate the input dataset. Any CPX data could be used to inform the development of the required noise change datasets. Additionally, if an agency acquire significant coverage for CPX data in the future then the methodology described in WP3 can be used to validate outputs. However, there are trade-offs to be made between the level of detail of the noise data and the coverage, primarily due to the resources required to collect direct measurements across a whole network. A road agency will have to determine the most suitable input data to use. The different noise measurements methods are discussed in QUESTIM WP2.
4.4.1.2 Required data However, the data required for modelling noise as a condition parameter at network level is different from the noise data found in the map. Firstly, the noise maps do not provide noise records for each county in its entirety. This is due to the mapping criteria of the Directive. Secondly, the maps and associated data do not provide specific chainage records of the extents of the noise mapping and this information is required to link the noise records to specific sections of the road network. Thirdly, the number of both people and households affected is not held for specific chainages but aggregated at a county level. Although the maps show how the noise zones change with distance from the road by the changing shape of the colours overlaid on the mapped roads (albeit crudely), the numerical data is not presented at that level. Whilst not essential for the analyses, this level of data would allow different maintenance schemes along the same road to use different levels of noise in the calculation of noise costs, rather than using an aggregate county-level average. These required data would be routinely expected for scheme specific noise appraisals at a project level but less so at network level. When modelling noise impacts to compare project level alternative options, more detailed data on the noise levels experienced along the entire length of the scheme would be required. This could include noise level data at regular chainage intervals, how it varies along the length, as well as information on the number of residents and properties affected. Understandably, that level of information is not available for the whole network because it is both costly and time consuming to collect and analyse it. Considering all of the above, the noise mapping data in Figure 4-1 represented the best source of noise data for the Irish road network. However, as discussed in the previous
Final Report 27
CEDR Call 2012: Noise
section, it is not the only source of noise data available; other directly measured noise data may be available depending on the network being modelled. The developed methodology is flexible enough to be used in conjunction with different sources of noise data, which itself might be influenced by the level of analysis being undertaken (e.g. network levels versus project level). A combination of noise data could also be used but this relies on the user being aware of any differences that may exist between the different data sources and the impacts this may have on an analysis. That therefore extends the potential benefits of the developed methodology for use by other road authorities. If directly measured noise data are available for a whole network it is recommended to use these. However, in place of network wide directly measured noise data and to be consistent with outputs from END across Europe noise mapping data can be used and the worked examples have been developed using this data source. It should be noted that the noise mapping data allows for a correction to be made due to the surface type in deriving the noise values. Whatever surface type correction has been applied to the noise mapping data, it is independent of the surface type used in the primarily PMS data for the main modelling. Therefore, if it has been specified wrongly in the derived noise mapping data, it can be amended if required, but even if the noise data is not amended in that situation the (incorrectly) defined surface type is not carried through into the main PMS database; this parameter is defined directly from a road authority’s own records. The apparent problems in using the noise mapping data as it is available, and the potential mitigation options are described in Table 4-3.
Table 4-3: Problems and mitigation for noise mapping data Problem
Description
Mitigation
Data are not available for the whole network
Because the END only required noise mapping in phase 2 for roads that carried more than 3 million vehicle passages per year this meant that a significant proportion of the network remained unmapped.
For the road lengths that have not been included in phase 2, noise benefits cannot be calculated for maintenance schemes. If other sources of noise data are available (e.g. localised scheme models) these could be used to fill gaps in the available noise data.
Some roads are only partially mapped within a county
The END requirements mean that a road may only be partially mapped in a county and the length of the mapped section to which the noise data applied is not available.
The length of each national road in each county is obtained by interrogating the base Irish data used for this model.
Final Report 28
CEDR Call 2012: Noise
Problem
Description
Mitigation
The mapping includes some regional roads
Regional roads are not the responsibility of the NRA and are not included in the data for the pavement maintenance model. However, the aggregated noise data was presented for all roads in each county, and therefore included some of the regional roads for some counties.
No information was available from the NRA on the length of regional versus national roads that had been mapped in any county.
Data are aggregated to a county level
Data is not available for individual roads in any county. Therefore all roads in a county had to be given the same derived average noise levels from the aggregate county data.
Until more detailed noise data is available on a chainage basis, or for individual roads, the modelled noise metric (e.g. number of affected properties per km) will be uniformly applied to all roads in a county.
4.4.1.3 Creating the mapped noise dataset The output data presented on the noise maps for both Lden3 and Lnight4 noise classifications were: •
Approximate number of people (5 dB bands from 75);
•
Approximate area (10 dB bands from >55, >65 and >75);
•
Approximate number of dwellings (10 dB bands from >55, >65 and >75); and
•
Approximate number of people (10 dB bands from >55, >65 and >75).
The most relevant dataset for this modelling was the number of dwellings, or households because this aligned with common practices for costing road noise and could therefore build upon that research. However, the noise mapping inputs presented this data measure in only three 10 dB bands as opposed to the 5 dB bands for the population data. Additional data were obtained from NRA, Ireland that contained the number of dwellings in 5 dB bands, derived from more accurate data of façade level noise. This resulted in a base dataset for the number of dwellings being created in the following format:
3
Lden (Day Evening Night Sound Level) is the average sound over a 24 hour period. It is weighted with a penalty of 5 dB added for the evening hours or 19:00-23:00, and a penalty of 10 dB added for the night hours 23:00-07:00 to account for extra annoyance in those period. 4 Lnight is the equivalent continuous noise level over the night hours 23:00-07:00. It is not weighted and is often used during sleep disturbance assessments.
Final Report 29
CEDR Call 2012: Noise
•
Lden 55-59 dB;
•
Lden 60-64 dB;
•
Lden 65-69 dB;
•
Lden 70-74 dB; and
•
Lden >75 dB.
5 dB bands may be larger than some of the noise reducing effects from a change in pavement surfaces but it is (currently) unrealistic to expect a road agency to have more detailed data for significant parts of their network. Using these 5 dB bands aligns with the noise maps produced under the European directive and therefore hopefully makes the methodology more widely applicable. Even though 5 dB bands have been used here, the smaller differences seen by a change from one surface to another is considered by allowing proportions of the dwellings in each band to move bands, rather than all dwellings in a band. Additionally, if more detailed noise data are available in smaller bands then datasets could be built around the finer banded data. Costs need aligning the the noise bands used in the methodology and this can be done by starting with the values for changes in 1 dB and aggregating the cost changes up to the required noise bands.
4.4.1.4 Deriving a noise metric for modelling Using the generated mapped noise dataset, a noise value that normalised the noise data in each county on a ‘per km’ basis was derived. This allows consistent rules to be applied across the network, whilst picking up differences in the county level data. It also allows for more detailed data to be applied to specific roads where it becomes available. The process described here consists of the following steps: 1) For each national road in each county, derive the route length (km) from the base Irish data; 2) By looking at each county noise map, assess: a) The proportion of the length of each national road mapped (%); b) The proportion of the total mapped national roads compared to regional roads (%); 3) Sum the total mapped length of national roads (using 1 and 2a) to provide a county level mapped national road length (km); 4) Use the noise dwelling dataset to determine (in each 5 dB band) the: a) Number of dwellings affected on the national roads (using 2b); b) The number of dwellings per km affected on the national roads (using 3 and 4a);
Final Report 30
CEDR Call 2012: Noise
5) For each county, apply the ‘number of dwellings per km’ to all the mapped national roads, and tabulate those values in a chainage format for use by the model as input noise data. This stage of the process is key, from a noise perspective, and there is plenty of scope for more refined methodologies should the requisite data be available. Time and computational constraints would prevent such methodologies from approaching the complexity of a detailed, geospatially accurate, noise mapping exercise but could potentially begin to address such issues as: •
The distance of properties from the road and noise reductions associated with noise barriers close to the road
•
Accounting for noise reductions where more than one road contributes to the noise at the dwellings but only one of these roads is being considered for maintenance
•
More accurately defining the noise level or geographical extent of dwellings modelled to receive the noise benefit of a new surface on a given road.
The methodologies discussed in QUESTIM WP3 resolve some of these issues in cases where CPX data are available.
4.4.2 Available data - Noise costs Monetising noise allows for the nuisance or benefit impacts from maintenance to be fully costed and included in an economic analysis. WebTAG unit 3.3.2 (DfT, 2012) contains recommended values for the change in noise in 1 dB bands for transport related noise (Appendix C: WebTAG Noise cost data, Table C.1)5. To derive values for household noise change in the required 5 dB bands the 1 dB change values were summed to generate lower and upper values for the respective halves of each 5 dB band. These half-band values were summed assuming that the noise was equally distributed in each 5 dB band (i.e. to get the cost of a change from one 5 dB band to another, the value from the upper half-band of one 5 dB band was summed with the lower half-band value of the next 5 dB band. For example, to calculate the monetary value per households of a change from 50-55 dB to 45-50 dB band, the upper half band value from the 45-50 dB band (£54.7 per household) was summed with the lower half-band value from the 50-55 dB band (£76.9 per household) (see Table C.1 for source values). The following table of noise costs for the 5 dB bands is derived using the above method.
5
These were the current costs available at the time of the research. Any user wishing to use or create a noise costing dataset should consult WebTAG to check for the latest cost data.
Final Report 31
CEDR Call 2012: Noise
Table 4-4: Noise costs Noise Change in the interval, dBLeq6
Value of a change in 5dB Value of a change in 5dB band, €7 per household per dB per band, £ per household per dB per annum annum