Benchmarking: Overcoming Paradigm Blindness
Michael Isakson, Moderator, President & COO, ServiceMaster Company Bradley Barnett, CFE, Vice President, Franchise Network Development, Valpak Michael Carlet, CFO, Driven Brands, Inc. Dan Finley, Senior Director, Business Development, SAP America, Inc.
• Valpak is headquartered in Tampa Bay FL and was founded in 1968 • Valpak currently operates in 110 DMA’s in the United States and in Canada with 185 Franchisees and $450MM Consumer Level Revenue • I have been with Valpak for 11 years and am responsible for franchise support, franchise sales and franchise administration
• Based in Charlotte, NC, Driven Brands is one of the leading franchisors in the automotive aftermarket with: • Nearly $1 billion in system sales • 1,500 retail locations in 7 countries plus over 300 vans providing mobile services
• Recently acquired Maaco which combined with Meineke allows us to manage two of the best known brands in the aftermarket with > 90% brand awareness
SAP AG in 2007 revenues: €10.25 billion Around 82,000 companies run SAP software Providing more than 25 industry solutions 51, 536 SAP employees (Dec, 2008) 12 million users in 120+ countries team with us to… Integrate their business processes Extend their competitive capabilities Get a better return on investment at a lower total cost of ownership Unique partner ecosystem More than 1.5 million community members (SDN and BPX) 15 Industry Value Networks
2008 ServiceMaster - 5,700 Franchise and Branch locations world wide, $5.5B Consumer Level revenue 2008 ServiceMaster Clean - 5,100 Franchise locations worldwide, $1.8B Consumer level revenue 1953 -1st Franchise sold, Founding member of IFA
• Learning Objectives • What is Paradigm Blindness? • Defining Benchmarking? • Best Practice using Benchmarking and how it can make a difference in your franchise business
• Session Perspective • How you as a franchisor can use benchmarking within internal processes improvement, and franchisee growth and maturity
• Paradigm within science: set of exemplary experiments that are likely to be copied or emulated. The prevailing paradigm often represents a more specific way of viewing reality, or limitations on future research. • Paradigm within business: simplified analogy for paradigm is a habit of reasoning or, “in the box” vs. "thinking outside the box". The “in the box” encompasses thinking that rarely leads to new paradigms or business solutions. • Benchmarking is one of the cures of paradigm blindness
SAP America Dan Finley
Benchmarking Drives Value VALUE DISCOVERY
Enables continuous improvement
Identifies what works well and what does not
Identifies industry best practices
Produces evidence based metrics
VALUE REALIZATION
VALUE OPTIMIZATION
Build a Business Case
Before business transformation
Assess value realization
During business transformation
Compare performance
After business transformation
Prove success
SAP Benchmarking – Designed to get Actionable Results
Strategic Service by ASUG and SAP, launched end of 2004 as a forum to exchange metrics and best practices
Program covers 20 processes, with 2,000+ participants from over 1,000 companies who leverage the program to:
Compare performance to leading companies, industry peers, and between regions/divisions
Build a business case for change
Identify ways to improve operations
Survey participation is free of charge
Survey content relevant for business as well as IT audiences
Leverage Industry Partnerships
Key Questions IFA/SAP Benchmarking Is Addressing -
Which practices have the most impact on driving my revenue growth?
How can I become more efficient and improve unit performance?
What is driving franchise sales and how do I compare to my peers?
IFA-SAP Franchisor Benchmarking Survey Your Company Report
IFA Pilot Group Initial Results With Illustrative Company Results
Participants Revenue and Profitability
Participants Categorized by Revenue
Profitability
Revenue Distribution by Participants
EBITDA per Revenue
Your Company
Q1
Avg.
Q4
XX%
54.8%
25%
‐7.2%
Average Revenue Breakdown
Key Observations The initial survey pilot group covered small, medium, and large franchisors. Royalty revenue is a key revenue driver with 78% of total revenues derived from royalties on average for the pilot group participants. © SAP 2007 / Page 14
SAP CONFIDENTIAL – For Company XXX’s Internal Use Only - This page is from the Benchmarking Analysis prepared for Company XXX and subject to the terms, conditions and assumptions contained in the Benchmarking Analysis. Information contained herein is not a guaranty of future results, performance or cost savings.
Benchmark: Franchisor Revenue and Operating Income Growth Rates and Revenue
Your Company
Key Observations Based on the limited number of data points there appears to be a strong correlation between revenue growth and EBITDA growth.
Additional participants will result in identifying best practices for top performers. © SAP 2007 / Page 15
SAP CONFIDENTIAL – For Company XXX’s Internal Use Only - This page is from the Benchmarking Analysis prepared for Company XXX and subject to the terms, conditions and assumptions contained in the Benchmarking Analysis. Information contained herein is not a guaranty of future results, performance or cost savings.
Benchmark: Company Performance and Operations
Type
Company Performance
Operations
Overall
Your Company
Q1
Avg.
Q4
Same Store Sales
XX%
7.6%
1%
‐6.1%
Total System Wide Sales Growth Rate
XX%
17.9%
7.1%
‐0.4%
XX%
0.41%
1.38%
3.8%
XX%
6.93%
26.65%
71.64%
$XX,XXX.XX
$695.70
$4644.78
$9415.03
Metric
Operations, Training, & Support Department Spend per Total System Wide Sales Operations, Training, & Support Department Spend per Royalties Revenue Operations, Training, & Support Department Spend per Number of Franchise Units
Below Average
Between Average and First Quartile
First Quartile
Key Observations Within each category there is a significant variance between the top performers and the bottom performers. Top performers grow their system wide sales more than twice as fast as bottom performers.
© SAP 2008 / Page 16
SAP CONFIDENTIAL – For Company XXX’s Internal Use Only - This page is from the Benchmarking Analysis prepared for Company XXX and subject to the terms, conditions and assumptions contained in the Benchmarking Analysis. Information contained herein is not a guaranty of future results, performance or cost savings.
Benchmark: Franchise Development
Type
Q1
Avg.
Q4
XX%
4%
1.75%
0.58%
Number of Days from Lead to Sale
XX
59
87
149
Total Lead Spend per Number of Franchise Sales
$XX,XXX.XX
$3078
$10,844
$16,267
Metric Number of Franchise Sales per Number of Leads
Franchise Development
Overall
Your Company
Average Lead to Sale Conversion by Source
Your Company
Key Observations Top performers convert franchise leads to sales more than twice as much as bottom performers. Additional territory, direct mail, and PR leads result in a higher number of sales for the pilot group.
© SAP 2008 / Page 17
SAP CONFIDENTIAL – For Company XXX’s Internal Use Only - This page is from the Benchmarking Analysis prepared for Company XXX and subject to the terms, conditions and assumptions contained in the Benchmarking Analysis. Information contained herein is not a guaranty of future results, performance or cost savings.
To Learn More about the IFA-SAP Benchmarking Survey • Contact: • Dan Finley, Senior Director, Business Development, SAP America Inc. 610-203-8987 • Shawn Reynolds, Director, Business Development, SAP America Inc. 513-252-4040 • Or visit us at the SAP Booth in the Exhibit Hall
Valpak Bradley Barnett
Benchmarking Unit Economics The business goal was to target growth through unit economics by imploring 4 key principles: • Commitment – increased focus on primary stakeholders • Personalization – Franchisee centric • Measurement/Reporting – set benchmarks that are attainable and measure them regularly • Reward/Recognition - recognize success for outstanding performance
Valpak’s MVP Growth Program
Benchmarking Unit Economics Case Study: MVP (“Most Valpak Pieces”) Program • A year long emphasis designed to increase revenue and improve unit economics by rewarding points for achievement of benchmarked growth results
Commitment A higher level of commitment was made to put an increased focus on: 1. Advertisers – Customer Service, Offers, ROI 2. Employees – Selection, Training, Investment 3. Field Support – Business, Finance, Training Advertiser Satisfaction
Franchisee
Revenue
Field Support
Franchisor
Building Personalized Benchmarks • • •
Benchmarks were personalized against prior year results and balanced by performance levels Point system was designed to reward benchmarked performance and to reward the franchisee on a regular basis Brackets were established to leverage competition among like sized franchisees Growth Benchmarks
Point System
4 3.00
Pieces Per Envelope
3 3
Growth Vs. Prior Year
Points
80%
5.0
100%
10.0
125%
12.5
2.25
2
1.75
2
1.25 1.00
1 1 0 Top
Upper
Average Franchises
Lower
Under
Measurement/Reporting Metrics
Filter
Benchmarks
• Don’t measure everything identify key performance indicators to set as benchmarks • Measure what’s needed, not what’s easy (broad vs. details) • Benchmarks are not collaboratively exhaustive, be aware of changes in nonbenchmarked metrics
Reports Valpak Direct Marketing Systems, Inc. MVPII Progarm-To-Date Results YTD May 2006 Rank 1 2 2 3 4 5 6 7 8 9 10 11 11 12 13 14 15 15 15 16 17 18 19
Mrkt Size Large Large Large Large Large Large Large Large Large Large Large Large Large Large Large Large Large Large Large Large Large Large Large
Fran Name Western Washington North Metro Las Vegas Central Virginia East/Mesa Valey Tarrant County Greater Kansas City Greater Orlando Cleveland Arizona at Phoenix Maryland Oregon Western Washington East Dallas New Jersey Fort Lauderdale San Jose Nassau County Suffolk County West Cleveland Southeast Wisconsin Southern Connecticut Staten Isl./Gr. Brooklyn Orange County
Jan-06 12.0 9.5 10.0 10.0 3.0 7.5 0.0 2.5 7.0 0.0 2.5 2.0 2.5 2.5 1.0 1.0 0.0 0.0 0.0 1.0 0.0 1.0 0.0
Feb-06 12.0 9.5 10.0 10.0 3.0 7.5 0.0 2.5 7.0 0.0 2.5 2.0 2.5 2.5 1.0 1.0 0.0 0.0 0.0 1.0 0.0 1.0 0.0
Mar-06 12.0 9.5 7.5 10.0 10.0 7.5 7.5 2.5 2.5 0.0 2.5 2.0 0.0 0.0 0.0 1.0 0.0 0.0 0.0 0.0 2.5 0.0 0.0
Apr-06 12.0 9.5 10.0 12.0 8.5 7.5 7.5 8.5 2.5 7.5 2.5 2.0 2.5 2.5 2.5 0.0 2.5 2.5 2.5 2.5 0.0 0.0 0.0
May-06 2.0 9.5 10.0 2.0 9.5 0.0 10.0 7.5 2.5 7.5 2.5 2.0 2.5 1.0 2.5 3.0 2.5 2.5 2.5 0.0 0.0 0.0 0.0
Total 50.0 47.5 47.5 44.0 34.0 30.0 25.0 23.5 21.5 15.0 12.5 10.0 10.0 8.5 7.0 6.0 5.0 5.0 5.0 4.5 2.5 2.0 0.0
• A proprietary reporting system was designed to track and post contest results on a monthly basis • Creating clear dividing lines between leaders and pursuers was crucial to promoting friendly competition amongst franchisees
High
Rewards = $1.3MM Exclusivity
• Reward value was leveraged against the difficulty required to succeed and culminated with a prestigious trip of a lifetime
Moderate
Attainability
Interactivity
Low
Difficulty
Selectivity
Minimal
Justifiable
Value
• Total value of the contest in cash and prizes exceeded $1.3MM
Prestigious
• Although insignificant in value, the engagement rewards were key to gaining initial and on-going buy-in amongst franchisees
Results • Piece count increase was the largest single year increase in company history during MVP year - Overall benchmark achievement was 62% - Franchisee revenue increased by 12% • Improved franchisee relationships - Sent a message of corporate support - Encouraged involvement in Franchise committees • Raised awareness to key business measurements
Driven Brands Michael Carlet
KPIs versus Benchmarking • Without benchmarks KPIs are just numbers…. • Set Benchmarks based on: • Historical Performance • Peers & Competitors • Plans & Expectations
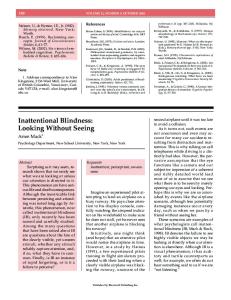
• Don Bradman played in 234 Cricket matches with a runs average of 95.14
Standard deviations
Athlete
Sport
Statistic
Bradman
Cricket
Batting Average
4.4
Pele
Soccer
Goals per game
3.7
Ty Cobb
Baseball
Batting Average
3.6
Jack Nickalaus
Golf
Major Titles
3.5
Michael Jordan
Basketball
Points per game
3.4
The statistics show that "no other athlete dominates an international sport to the extent that Bradman does cricket". In order to post a similarly dominant career statistic as Bradman, a baseball batter would need a career batting average of .392, while a basketball player would need to score an average of 43.0 points per game.[The respective records are .366 and 30.1.
Benchmarks to understand the market
Benchmarks to understand franchisor performance We used the attached analysis when evaluating acquisition opportunities in evaluating what potential cost savings could be obtained
Company A Annual Cost per franchisee $
13.44
Company B Annual Cost per franchisee $
41.62
Company C Annual Cost per franchisee $
29.96
Company D Annual Cost per franchisee $
23.61
Benchmarks to understand franchisee performance
ServiceMaster Michael Isakson
ServiceMaster • Home Office • Across the Brands of ServiceMaster – understanding the consumer • Net Promoter Scoring for customer satisfaction • Retention, and customer turnover • Franchisor to Franchisor • Primary to understand staffing / support levels, service levels, incentive / award costs • Span of Control and Layer • IFA / SAP Project • Compensation Data
ServiceMaster Case Examples
• Franchise Network • Financial • Process • Personal / HR • Growth, Market Penetration • Product / Technology • Six Sigma- spotting variation, common language • Where to benchmark most critical part of the process
High variation in NPS measuring customer satisfaction: providing opportunity for Benchmarking Indexed Net Promoter Score (NPS)
40 pts Higher
20 pts Higher
Average NPS
20 pts Lower 40 pts Lower
Significant variability in NPS across local branches
Revenue
Find the Benchmarking Sweet Spot Franchisee Sub-quadrants
3
Related 2.00
1.50
1
Monitor and Support When Necessary Franchisees: Financially Successful & Not Bought In
Coach Support, and Recognize Franchisees: Financially Successful & Bought In
1.25
1.00
Notify and Watch
4
Rich or Famous
.75
.50
2
Franchisees: Below Contractual CLR Requirements & Bought In (Includes owners < 12 months)
Franchisees: Below Contractual CLR Requirements & Not Bought In
Revenue Related 0.0
5.0
System Buy-In
7.0
10.0
Revenue
Find the Benchmarking Sweet Spot Franchisee Sub-quadrants
3
Related 2.00
1.50
1
Monitor and Support When Necessary Franchisees: Financially Successful & Not Bought In
Coach Support, and Recognize Franchisees: Financially Successful & Bought In
1.25
1.00
Notify and Watch
4
Rich or Famous
2
.75
.50
Franchisees: Below Contractual CLR Requirements & Not Bought In
Revenue Related 0.0
5.0
System Buy-In
7.0
10.0
Find the Benchmarking Sweet Spot Population compared to Consumer Level Revenue
4
3
2
1
Questions & Answers Summary & Conclusion