Proceedings of 30th International Conference Mathematical Methods in Economics
Behavioral equilibrium exchange rate in Greece and Ireland Klára Plecitá1, Luboš Střelec2 Abstract. Open macroeconomics sees real exchange rate as an important tool in maintaining macroeconomic balance. When euro area countries adopted the common currency euro, they have lost the opportunity to adjust their real exchange rates via changes in nominal exchange rates, thus these countries can correct for real exchange rate overvaluation only through internal devaluation or an exit from the euro area. This paper focuses on equilibrium exchange rates for Greece and Ireland since their entrance into the euro area until the end of the year 2011. To examine the real exchange rate misalignment for Greece and Ireland towards the rest of the euro area, the concepts of Behavioral Equilibrium Exchange Rate (BEER) and Permanent Equilibrium Exchange Rate (PEER) are applied. We find that the real exchange rate of both Greece and Ireland was undervalued towards the euro around the time, when these countries entered the euro area. Further we uncover that for the rest of the period analyzed the Irish and Greek real exchange rate was broadly in line with underlying fundamentals. Keywords: equilibrium exchange rate, BEER, PEER, Ireland, Greece. JEL Classification: C32, C51, C58, F31 AMS Classification: 91G70, 91G80
1
Introduction
According to open macroeconomics, real exchange rate is a very important tool in attaining internal and external macroeconomic balance. When euro area countries adopted the common currency euro, they have lost the opportunity to adjust their real exchange rates via changes in nominal exchange rates. Therefore it is of high importance that countries enter the euro area with properly set conversion rates of their national currencies to the euro. If a country joins the euro area with an overvalued currency it may undermine competitiveness of its businesses and lead to lower exports with a negative impact on economic growth. Similarly, joining the euro area with an undervalued currency may boost competitiveness and lead to an overheating of the economy. Therefore, persistent real exchange rate misalignments may lead to macroeconomic imbalances and resources misallocation, and elimination of these imbalances, especially in the context of the euro area, which consists of a set of sovereign countries with not fully synchronized economic and political course of events, may be done via internal devaluation or revaluation process or an exit from the euro area. In recent years not only the world macroeconomic imbalances but also the imbalances within the frame of the euro area are widely discussed. Plecitá and Střelec [7] identified that the largest macroeconomic imbalances in the euro area in the year 2010 displayed Greece and Ireland. Therefore the aim of this paper is to estimate the equilibrium real effective exchange rate for Greece and Ireland towards the rest of the euro area (which is for our purpose defined as the original EA-12) and consequently to compute the degree of their exchange rate misalignment. To assess the degree of exchange rate misalignment, which is defined as a gap between actual (observed) real effective exchange rate and equilibrium exchange rate, it is necessary to estimate the equilibrium exchange rate, for which several concepts are available. The traditional theory of the equilibrium exchange rate is the Purchasing Power Parity (PPP) which explains the movements in equilibrium exchange rates in the long run on the basis of relative prices. Beyond the PPP, two other major equilibrium exchange rate theories and their various modifications were developed: the Fundamental Equilibrium Exchange Rate (FEER) and the Behavioral Equilibrium Exchange Rate (BEER). The equilibrium exchange rate in FEER is defined as the exchange rate that simultaneously ensures internal and external macroeconomic balance [11]. The internal equilibrium is reached when economy is operating at full employment in a low inflation environment and the external equilibrium is characterized by a sustainable current account. However defining the sustainable position of the current account is highly controversial and subjective in nature [10]. In contrast, in the BEER approach the equilibrium exchange rate is consistent with prevailing level of economic fundamentals and rests on the principles of uncovered interest rate parity [1]. A comprehensive discussion of the different approaches for estimating equilibrium exchange rate can 1
MENDELU, Department of Finance, Zemědělská 1, 613 00 Brno, Czech Republic,
[email protected]. MENDELU, Department of Statistics and Operation Analysis, Zemědělská 1, 613 00 Brno, Czech Republic,
[email protected]. 2
- 715 -
Proceedings of 30th International Conference Mathematical Methods in Economics be found for example in MacDonald [5]. As the BEER approach is said to be suitable for relatively short time series [8], as is the case of our euro-area time series, we decided to estimate the equilibrium exchange rate for Greece and Ireland during their membership in the euro area using the BEER methodology.
2
Data and methodology
The behavioral equilibrium real effective exchange rate for Greece and Ireland is estimated towards the rest of the original 12 euro area countries (EA-12) on the quarterly basis from the entrance of these countries into the euro area (Ireland 1999 and Greece 2001) until the end of the year 2011. The empirical estimations of the BEER model in this paper draw heavily on Clark and MacDonald [1]. The BEER approach produces estimates of equilibrium real exchange rate which incorporate both short run and long run economic fundamentals. Based on the literature, the BEER is determined by following set of economic variables:
BEER = f ((r − r *), TNT , TOT , IIP, DEBT )
(1)
where BEER is the behavioral equilibrium real exchange rate estimated on the basis of the real effective exchange rate (REER) of the domestic economy to the rest of the EA-12 countries. REER is computed from tradeweighted nominal effective exchange rate deflated by the ratio of domestic and foreign price indexes (HICP). Data source: European Commission. (r - r*) is the real interest rate differential that represents the uncovered interest rate parity, r is the domestic real interest rate and r* is the foreign real interest rate, i.e. the weighted real interest rate for the rest of the EA-12 countries. An increase in the real interest rate differential is expected to lead to an appreciation of the real exchange rate. The real interest rates were calculated using quarterly nominal interest rates for 10-year government bonds, which were deflated using HICP. Data source: Eurostat. TNT is the relative price of non-traded goods in domestic economy relative to the price of traded goods in domestic economy relative to the equivalent of foreign effective (trade weighted) foreign ration of non-traded to traded goods. The TNT variable is used as a productivity proxy stemming from the Balassa-Samuelson effect and measures the impact of productivity on the real exchange rate. An increase in the TNT should lead to appreciation of the real exchange rate. The TNT was computed as a ratio of consumer price index (HICP) and producer prices in manufacturing (PPI). Data source: OECD Stat. TOT represents terms of trade of domestic economy relative to trade-weighted terms of trade of foreign economies. An increase in TOT should improve trade balance and therefore lead to appreciation of real exchange rate. The terms of trade were computed as the ratio of the export to import indexes. Data source: Eurostat. IIP stands for net international investment position, which is determined by the attitude of the public and private sector towards savings and investment. The impact of IIP on real exchange rate is ambiguous, i.e. increase in IIP can lead either to appreciation or depreciation of real exchange rate depending on other circumstances (for more details see Maeso-Fernandez et al. [6]). IIP is computed as a ratio of the stock of net international investment position to nominal gross domestic product. As data on IIP are prior the year 2004 available only on yearly bases, the data for the time period 1Q1999 – 4Q2003 were interpolated from the yearly data using cubic spline interpolation method. Data source: IFS IMF. DEBT is the ratio of domestic general government debt to general government debt of the rest of the EA-12 countries. DEBT is used as a proxy for time variant risk. An increase in DEBT leads to depreciation of the real exchange rate. Data source: Eurostat. Econometric estimation of BEER is based on linear semi-logarithmic form expressed as log REERt = α 0 + α1 IIPt + α1 ( r − r*) t + α 2 log TOTt + α 3 log TNTt + α 4 log DEBTt + ε t
where log denotes a logarithm and
εt
(2)
is the error term.
Before applying the Johansen (1995) cointegration method, stationarity of the variables analyzed is tested via the Augmented Dickey-Fuller (ADF) unit root test, because at least some (but not necessarily all) of the variables entering the Johansen cointegration method must be nonstationary [1]. And cointegration vectors on the basis of the Trace test statistic are identified. In the next step equation (2) is estimated and statistically insignificant coefficients are removed by applying sequential elimination methods. Consequently, these restricted models for selected countries are used for estimation of the behavioral equilibrium exchange rate. Moreover two types of equilibrium exchange rates are computed: the medium-run BEER and the long-run BEER called PEER (permanent equilibrium real exchange rate). The medium-run BEER values are estimated, when current (actual) values of explanatory variables are used in the cointegration relationship. It is, however, possible, that the current values
- 716 -
Proceedings of 30th International Conference Mathematical Methods in Economics of economic fundamentals may depart from their sustainable levels during period analyzed. Therefore the PEER values are estimated using equilibrium values of explanatory variables, which are obtained from the HodrickPrescott filter [3]. In the last step current and total misalignments of the real effective exchange rates are computed. Current misalignment is given by the current values of explanatory variables and is obtained as the difference between actual REER and estimated equilibrium BEER values. Total misalignment is defined as a gap between actual REER and estimated lung-run PEER values.
3
Equilibrium exchange rates
Unit root tests, which results can be seen in Table 1, applied to the data suggest that all series are nonstationary at 1 % significance level, and most of them are integrated of the order one. Therefore, we applied the Johansen cointegration method. On the basis of the Trace statistics (Table 2), there would appear to be up to four cointegration vectors in the case of Greece and up to 3 cointegration vectors for Ireland. Greece
Ireland
statistic
p-value
statistic
p-value
log REER
-2.574
0.292
-1.668
0.766
IIP
-1.256
0.898
-2.576
0.292
2.351
1.000
-2.059
0.568
log TOT
-2.232
0.471
-3.768
0.018
log TNT
-1.951
0.627
-2.263
0.454
log DEBT
-1.643
0.776
-1.817
0.697
(r-r*)
Table 1 ADF unit root tests for variables in BEER models Greece
Ireland
H0 : r
Trace
p-value
Trace
p-value
0
191.9
0.000
151.5
0.000
1
136.2
0.000
90.5
0.000
2
86.1
0.000
54.5
0.009
3
43.3
0.001
25.4
0.150
4
14.9
0.060
9.7
0.308
5
0.3
0.559
1.7
0.191
Table 2 Trace test statistics of cointegration vectors As is known, the existence of multiple cointegration vectors complicates the interpretation of equilibrium; therefore we restricted the cointegration space only to one cointegration vector for log REER for each country (see Table 3).
Greece Ireland
log REER 1.000 (0.000) 1.000 (0.000)
IIP 0.045 (0.004) 0.018 (0.002)
Normalized cointegration coefficient (r-r*) log TOT log TNT log DEBT -0.005 0.047 0.230 0.011 (0.001) (0.057) (0.093) (0.034) 0.005 0.167 -0.152 0.029 (0.001) (0.085) (0.019) (0.008)
const. -0.005 (0.955) -0.131 (0.087)
Table 3 Cointegration analysis and EC model (standard errors in parenthesis) Some of the coefficients estimated were found to be statistically insignificant; therefore in the next step we used sequential elimination methods to estimate the country-specific restricted models (see Table 4).
- 717 -
Proceedings of 30th International Conference Mathematical Methods in Economics
Greece const. IIP (r-r*)
Ireland
coefficient
p-value
coefficient
p-value
4.576
0.000
4.613
0.000
-0.035
0.000
-0.009
0.000
0.001
0.001
0.001
0.013
-0.275
0.001
0.091
0.000
-0.030
0.000
log TOT log TNT log DEBT
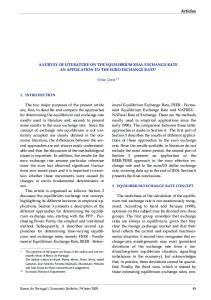
Table 4 Estimates of log REER (restricted model) All of the variables entering the restricted model (BEER) for Greece (Table 4) are statistically significant at 5 % significance level and have the correct sign, apart from the TNT sign, which is negative. The TNT is an imperfect measure of relative non-traded prices and can be affected by various factors unrelated to the BalassaSamuelson framework (for more detailed discussion see for example Engel [2] and Schnatz et al. [9]); therefore Rusek [8] argues that the sign of TNT can be both positive and negative and depends on the data. Hence we did not exclude this variable from our estimated model. All of the variables entering the restricted BEER model for Ireland (Table 4) are statistically significant at 5 % level and have the expected sign. In order to generate the long-run PEER for Greece and Ireland, smoothed values of explanatory variables (from the Hodrick-Prescott filter) were substituted into the estimated BEER equations (Table 4). Figure 1 plots the BEER and PEER estimates for Greece and Ireland alongside with their actual REER values during the period 1Q2001 – 4Q2011, respectively 1Q1999 – 4Q2011. Greece
Ireland
4.76
4.67 REER BEER PEER
REER BEER PEER
4.74
4.66
4.72
4.65
4.7
4.64
4.68
4.63
4.66
4.62
4.64
4.61
4.62
4.6 2002
2004
2006
2008
2010
2012
2000
2002
2004
2006
2008
2010
2012
Figure 1 Plot of the (logarithm of the) actual REER, medium-run BEER and long-run PEER for Greece and Ireland to the rest of the EA-12 As can be seen from Figures 1 and 2, the difference between the actual national real effective exchange rate (REER) of Greece and Ireland and their medium-run (BEER) and long-run equilibrium values (PEER) are neither large nor persistent. Both countries entered the euro area with slightly undervalued REERs, as can be seen from Figure 2 - both on the basis of current and total misalignment, but this undervaluation was corrected, especially in the case of Ireland, very shortly afterwards. The Irish actual REER oscillated very closely around its equilibrium BEER and PEER values. In the case of Greece the periods of misalignment of actual REER from its longterm equilibrium PEER values were more prolonged, but still they were hardly ever larger than one percentage point.
- 718 -
Proceedings of 30th International Conference Mathematical Methods in Economics
Ireland - current misalignment 3
2
2
1
1
%
%
Greece - current misalignment 3
0
0
-1
-1
-2
-2
-3
-3 2002
2004
2006
2008
2010
2012
2000
2002
2006
2008
2010
2012
2010
2012
Ireland - total misalignment
1.5
1.5
1
1
0.5
0.5
%
%
Greece - total misalignment
2004
0
0
-0.5
-0.5
-1
-1
-1.5
-1.5 2002
2004
2006
2008
2010
2012
2000
2002
2004
2006
2008
Figure 2 Current and total misalignments for Greece and Ireland to the EA-12 For Greece’s membership in the euro area large and persistent current account deficits, debt accumulation and rise in labor costs have been typical. And the Irish economy was severely hit by the economic crisis. Therefore the results from our BEER and PEER analysis, which suggest, that the Greek and Irish REERs have been more or less consistent with their underlying fundamentals over period analyzed, could be striking. However it must be noted that we focus only on the Greek equilibrium towards the original euro area, which consisted only of 12 members states, therefore the Greek and Irish equilibrium exchange rate towards the rest of the world may look different. Moreover, as noted by Siregar and Rajan [10], the BEER and PEER equilibriums are from definition not consistent with the typical notion of macroeconomic balance, i.e. simultaneous achievement of internal and external equilibrium, but they are consistent with prevailing levels of macroeconomic fundamentals, respectively with their equilibrium levels. Finally, there is scope for additional research in this area. As noted in the beginning of this paper there are different models for estimating equilibrium exchange rates, which are based on diverse sets of variables and economic assumptions, and this paper is based only on the BEER approach. To enable us to draw more robust conclusions about the equilibrium real exchange rates for Greece and Ireland during their membership in the euro area we need to apply also the other approaches which will be the focus of our further research.
4
Conclusion
The aim of this paper was to estimate equilibrium real effective exchange rate for Greece and Ireland during their membership in the euro area and to compute the degree of their exchange rate misalignment toward the rest of the original euro area (EA-12). To estimate the equilibrium real exchange rate the behavior equilibrium exchange rate (BEER) promoted by Clark and MacDonald [1] has been applied. Moreover to eliminate the effect of temporary shocks on the equilibrium exchange rate the permanent equilibrium exchange rate (PEER) has been computed. In particular, we find that the actual real effective exchange rates (REER) of Greece and Ireland towards the rest of the EA-12 are broadly in line with their equilibrium BEER and PEER levels. Both Greece and
- 719 -
Proceedings of 30th International Conference Mathematical Methods in Economics Ireland entered the euro area with an undervalued REER, but this misalignment has been corrected afterwards, and during the period analyzed there has been found no persistent period of misalignment.
Acknowledgements This paper is a part of outputs of research intention supported by the Ministry of Education, Youth and Sports of the Czech Republic (Project No. MSM 6215648904/01).
References [1] Clark, P. B., and MacDonald, R.: Exchange Rates and Economic Fundamentals – A Methodological Comparison of BEERs and FEERs. IMF Working Paper WP/98/67, International Monetary Fund. 1998. [2] Engel, C.: Accounting for U.S. Real Exchange Rate Changes. Journal of Political Economy 107 (1999), 507–538. [3] Hodrick, R. J., and Prescott, E. C.: Postwar U.S. Business Cycles: An Empirical Investigation. Journal of Money, Credit and Banking 29 (1997), 1–16. [4] Johansen, S.: Identifying restrictions of linear equations with applications to simultaneous equations and cointegration. Journal of Econometrics 69 (1995), 111–132. [5] MacDonald, R.: Concepts to Calculate Equilibrium Exchange Rates: An Overview. Frankfurt am Main: Deutsche Bundesbank, 2000. [6] Maeso-Fernandez, F., Osbat, C., and Schnatz, B.: Determinants of the Euro Real Effective Exchange Rate: A Beer/Peer Approach. Australian Economic Papers 41 (2002), 437–461. [7] Plecitá, K., and Střelec, L.: On equilibrium real exchange rates in euro area: Special focus on behavioral equilibrium exchange rates in Ireland and Greece. Acta Universitatis Agriculturae et Silviculturae Mendelianae Brunensis LX-2 (2012), 261–269. [8] Rusek, A.: Real Effective Exchange Rate for the Euro: Equilibrium and Misalignment. In: The Economic Performance of the European Union: Issues, Trends and Policies (Rusek, A., Lacina, L., and Fidrmuc J., eds.). Palgrave Macmillan, London, 2009, 42–65. [9] Schnatz, B., Vijselaar, F., and Osbat, C.: Productivity and the Euro-Dollar Exchange Rate. Review of World Economics 140 (2004), 1–30. [10] Siregar, R., and Rajan, R.: Models of Equilibrium Real Exchange Rates Revisited: A Selective Review of the Literature. Centre for International Economic Studies, University of Adelaide, 2006. [11] Williamson, J.: Estimating Equilibrium Exchange Rates. Peterson Institute of International Economics, Washington DC, 1994.
- 720 -