DSpace VSB-TUO http://www.dspace.vsb.cz Advances in Electrical and Electronic Engineering (AEEE)
AEEE. 2015, vol. 13
Automatic detection of generalized epileptic seizures 2016-07-08T07:46:31Z http://hdl.handle.net/10084/111803 Downloaded from DSpace VSB-TUO
VOLUME: 13 | NUMBER: 2 | 2015 | JUNE
BIOMEDICAL ENGINEERING
Automatic Detection of Generalized Epileptic Seizures Maria PAPEZOVA 1 , Branko BABUSIAK 2 , Dagmar FAKTOROVA 1 1
Department of Measurement and Applied Electrical Engineering, Faculty of Electrical Engineering, University of Zilina, Univerzitna 1, Zilina, Slovakia 2 Department of Electromagnetic and Biomedical Engineering, Faculty of Electrical Engineering, University of Zilina, Univerzitna 1, Zilina, Slovakia
[email protected],
[email protected],
[email protected] DOI: 10.15598/aeee.v13i2.1254
Abstract. Sensed signals from the human body provide information about the health status. The basic clinical methods used for the diagnosis of neural disorders include electroencephalography (EEG). There are a number of algorithms for automatic localization of epileptic graphoelements. Currently, the most widespread disease of the brain is epilepsy which can be diagnosed by using EEG. We will further deal with three following methods: simple arithmetic detector, detector based on median filtering and the combined application of previous methods.
Keywords Automatic detection, brain mapping, electroencephalogram, epileptic graphoelements.
1.
Introduction
Epilepsy is the most wide-spread disease of the brain diagnosed by EEG. This is reflected in the form of repeatedly uncontrolled, sudden changes of brain activity called seizures. The name comes from the Greek word "epilambien" meaning seizures fall. Manifestations of epilepsy are very heterogeneous. From a clinical point of view, epilepsy is defined as a fault of consciousness, behavior, motoric disorder or sensitive functions, or combination thereof. In one patient, there may be various forms of seizures that differ from one to another such as twitching of muscles or prolonged seizures. Epileptic seizure is physiologically sudden and transient cerebral cortical activity. This disorder is uncontrollable and is accompanied by electric discharge in the gray matter of the brain. Electric discharge du-
ration is in the order of seconds, minutes or, in severe cases, several hours. The patient can be absolutely without health problems in the time between seizures. Generalized epileptic seizures are bilaterally symmetrical and have no beginning of focuses. These seizures are accompanied by disorder of consciousness or motor skills. It is assumed that the epileptic discharges begin in reticular formations and affect the whole brain diffusely. The seizures may have convulsionary, i.e. spasmodic, and non-convulsionary, i.e. non-spasmodic character. There are 5 basic types of generalized seizures: • tonic - clonic (grand mal) - there is an overall increase in convulsion accompanied by cramps especially in the facial area, • absence (petit mal) - failure of consciousness when a person can continue in previous activities, and does not perceive his surroundings, • clonic seizures - spasmodic status of the whole body, • tonic seizure - reflected as increased muscle tension, • myoclonic seizures [1], [2]. From a clinical point of view, epilepsy is defined as a fault of consciousness, behavior, motoric disorder or sensitive functions [3]. Imaging methods help to classify the epilepsy disease, particularly magnetic resonance of the brain which can detect structural abnormalities leading to the formation of an epileptic seizure. EEG has irreplaceable role in the diagnosis of epilepsy.
c 2015 ADVANCES IN ELECTRICAL AND ELECTRONIC ENGINEERING
191
VOLUME: 13 | NUMBER: 2 | 2015 | JUNE
BIOMEDICAL ENGINEERING
2.
EEG Signal Processing
2.3.
Signal Processing and Development of Automatic Detection
Our aim is to design an optimal algorithm for localization of epileptic graphoelements in the MATLAB programming language. The work deals with following There are a number of algorithms for the automatic lothree methods: simple arithmetical detector, detector calization of epileptic graphoelements. They are based based on median filtering and the combined application on different principles. We created three methods: of simple arithmetic detector and median detector. In clinical practice the selection of computing speed of • simple arithmetical detector, each method is important to obtain results as fast as • detector based on median filter, possible. • combination detector [4].
2.1.
Specification and Stabilization of EEG Recording
These basic technical parameters of EEG recording are used in clinical practice: • device sensitivity (100 µV per cm), • frequency band (from 0.5 Hz to 110 Hz), • sampling frequency (from 100 Hz to 256 Hz), [4]. The measured EEG data has a small amplitude and therefore the signal has to be amplified for further processing. The frequency range of signal is modified by analog filters before using A/D converter or after conversion by using digital filters [4].
2.2.
Morphology of Epileptic Seizures
Morphology of epileptic seizure signal is constantly changing with age and can transform from one type to another according to the progress of the disease. Epileptic signal is most commonly found in the temporal area and gradually spreads to different parts of the brain. Epileptic EEG wave is always accompanied by a sharp first wave followed by a slow wave. The epileptic wave is within a certain frequency interval, typically 2– 6 Hz, although this is not always the case. Two types of curves are observed in patients with epilepsy: interictal curve (between seizures, i.e. ordinary record) and ictal curve (recording during a seizure) [5].
1)
Simple Arithmetical Detector (SAD)
SAD consists of 3 basic components: • difference filter which is mathematically the first derivation of signal, • product operator which is an important component of the arithmetic detector. The function of the operator is to smooth out and modify the resulting signal, • border comparison is the last component of the detector. Boundary crossing indicates the presence of searched components. Threshold can be set according to subjective judgment (experimentally), or on the basis of statistically relevant patterns [4]. The principle of SAD is depicted in Fig. 1.
Fig. 1: The principle of SAD [4].
2)
Detector Based on Median Filter (MF)
The second algorithm, which we chose in the final design, can be used to detect epileptic graphoelements based on median filter. The principle of the algorithm is as follows:
The onset of epileptic seizure in the EEG is accompanied by:
• MF eliminates pulses shorter than the length of the filter window,
• sudden change of frequency of the EEG record,
• subtraction of filtered EEG signal, i.e. signal without spikes from the original (with spikes) results in a signal that includes a pulse component (spikes),
• a sudden drop of amplitude, • sudden increase of amplitude [5].
• the resulting signal is smoothed out, adjusted and finally compared with threshold values.
c 2015 ADVANCES IN ELECTRICAL AND ELECTRONIC ENGINEERING
192
VOLUME: 13 | NUMBER: 2 | 2015 | JUNE
BIOMEDICAL ENGINEERING
The disadvantage of MF is its sensitivity to rapid EMG activity and resistance to sharp jump in the signal [4].
3)
Combination Detector (CD)
Combined application of both of the above mentioned algorithms. The epileptic spikes are detected when both algorithms recognize spike activity [4].
3.
Software Solution
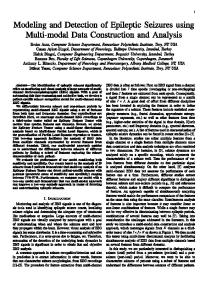
Fig. 2: EEG record (19 channels) with epileptic activity.
All algorithms were designed in the MATLAB programming language. The algorithm used for localization of epileptic graphoelements was divided into several parts. The individual functions are called recursively and share necessary variables known as global variables. In MATLAB we used built-in functions from signal processing toolbox and the result is shown in application with graphical user interface (GUI). For this purpose we used the MATLAB tool named GUIDE for creating GUI application.
3.1.
EEG Data File
The EEG data recorded from patient is stored in EDF file (with ".edf" extension). This type of file has specific data structure. The file contains 32 channels – 19 channels are EEG channels; the others are supplementary channels such as EMG, ECG, EOG, etc. The international electrode placement system "10/20" is used in our experiment. The data sample rate is set to 256 with 12-bit resolution. We were working with real data which included artifacts of biological and technical origin. The first necessary step in processing of EEG data was to remove 50 Hz AC noise from all channels using digital filter. In the Fig. 2 we can see a 10 second EEG recording with 19 channels after removing power line noise. Epileptic activity is present between 3rd and 8th second.
Fig. 3: Sample of EEG channel with epileptic activity.
activity is characteristic for brain tumors or epileptic seizures [6]. Frequency mapping shows a graphical presentation of the brain activity – frequency mapping. We chose 10 second segment in which epileptic brain activity is detected (Fig. 4). We used theoretical knowledge for correct frequency mapping and we defined the frequency ranges of EEG waves. These frequencies were loaded into the corresponding alpha, beta, theta and delta domain matrix. Frequency analysis has great a significance in medicine, e.g. lower frequencies in frontal part of brain indicate onset of epileptic seizures, etc.
Simple Arithmetical Detector For better clarity, we randomly selected 1 channel 3.3. from all EEG channels. The selected channel is further (SAD) processed for demonstration. In Fig. 3 we can see the 15th channel from the recording shown in Fig. 3. The aim of this detector is to find epileptic graphoelements. In the first step, the frequency of epileptic components is shown by applying band pass filter. Applica3.2. Frequency Mapping tion of band pass filter reveals the necessary frequency components of epileptic graphoelements in the range In neurology the analysis in frequency domain helps from 10 Hz to 25 Hz. This frequency range is deterto diagnose the disease, e.g. deceleration of the brain mined by width of epileptic spike (70–200 ms). In the
c 2015 ADVANCES IN ELECTRICAL AND ELECTRONIC ENGINEERING
193
VOLUME: 13 | NUMBER: 2 | 2015 | JUNE
BIOMEDICAL ENGINEERING
Fig. 6: Resulting signal of SAD.
Fig. 4: Graphic presentation of brain activity - frequency mapping in the epileptic area.
following steps, it is important to keep in mind that digital filters cause a signal time shift. The shift can be approximately determined as a half of the filter order. The signal after application of pass band filter is shown in Fig. 5. The epileptic spikes are amplified by first derivation of signal (difference filter). Product operator is an important component of the SAD. The function of the said operator is to smooth out and rectify the resulting signal. The most impor- Fig. 7: EEG channel after application of SAD. tant step in creating the SAD algorithm was to set the threshold. We consider the following scenario – the actual limit, in our case, is a vector with length equal to 3.4. Detector Based on Median that of the applied signal, determining the threshold Filter (MF) where we can locate epileptic discharges. The threshold level is set experimentally. Threshold exceedance The second algorithm we employed was based of MF indicates the presence of epileptic spike in the original detector. An important preliminary step in MF is to EEG signal (Fig. 6). appropriately set the length of window that removes pulses shorter than the length of this window. Length of the MF window is calculated as a proportion of the sampling frequency and the frequency of epileptic spike. For demonstration purposes, we applied MF with order of 10 on the same EEG signal as in previous detector. The resulting signal is shown in Fig. 8. The spikes were partially removed. Components of pulse signal are obtained by subtracting the filtered signal - without spikes, from the original signal - with spikes (Fig. 9).
Fig. 5: EEG signal after pass band filter (10–25 Hz).
The SAD algorithm is applied to the original signal adjusted by filters and detected epileptic spikes are denoted by color markers (Fig. 7).
The resulting signal is smoothed out, rectified and compared with the threshold (Fig. 10). The threshold is determined experimentally for all EEG channels in the entire recording. Threshold exceedance indicates the presence of epileptic spikes. As with SAD, MF algorithm is applied to the original signal modified by filters and detected epileptic area is denoted by blue squares (Fig. 11).
c 2015 ADVANCES IN ELECTRICAL AND ELECTRONIC ENGINEERING
194
VOLUME: 13 | NUMBER: 2 | 2015 | JUNE
BIOMEDICAL ENGINEERING
Fig. 8: MF- removing of sharp spikes.
Fig. 11: EEGs channel after application of MF.
does not represent a spike. This magnitude change is not detected as spike when using a detector based on the median filter. Epileptic spikes are detected when both algorithms recognize spike activity.
Fig. 9: Components of pulse signal.
Fig. 12: EEG channel after application of CD.
3.6.
Fig. 10: Resulting signal of MF.
3.5.
Application of Detectors in GUI
In the graphical user interface (GUI) we created buttons "Single arithmetical detector", "Detector based on median filter", "Combination detector" for each filter separately.
Combination Detector (CD)
We applied the created algorithms to EEG recording with 19 channels. The algorithms were applied graduWe combined all previous procedures to form a CD. A ally, channel by channel. The localization of epileptic problem occurred with displaying the desired epilepgraphoelements is denoted by an asterisk (*) and ring tic elements because the combination of filters causes (o) above the spikes (Fig. 13). information loss about the width of spikes intervals. Instead of displaying areas of epileptic activity diThe recording contains various artifacts mainly of birectly within the graph, the epileptic spikes are denoted ological origin. In Fig. 14 the motion artifact caused by by blue squares overlaid with red diamond character chewing muscles is present in all channels. Our algo(Fig. 12). As we can see in the Fig. 12, the arithmeti- rithm is not yet robust against these types of artifacts. cal detector detects sudden change of magnitude which Therefore false detection of epileptic spikes can occur.
c 2015 ADVANCES IN ELECTRICAL AND ELECTRONIC ENGINEERING
195
VOLUME: 13 | NUMBER: 2 | 2015 | JUNE
BIOMEDICAL ENGINEERING
Acknowledgment This work was supported in part by the Grant VEGA projects No. 1/0846/13.
References
Fig. 13: Localization of epileptic graphoelements in the tool GUIDE using MF.
[1] AMBLER, Z. Zaklady neurologie: ucebnice pro lekarske fakulty. 6th edition. Praha: Galen, 2006. ISBN 80-726-2433-4. [2] NEVSIMALOVA, S., E. RUZICKA and J. TICHY. Neurologie: ucebnice pro lekarske fakulty. 1st edition. Praha: Galen, 2002. ISBN 80-2460502-3. [3] BARTKO, D. Neurologia. Martin: Osveta, 1993. ISBN 80-2170-570-1. [4] MOHYLOVA, J. and V. KREJCA. Zpracovani biologickych signalu. Ostrava: Edicne stredisko VSB-TUO, 2006. ISBN 987-80-248-1491-9.
Fig. 14: Wrong detection of epileptic spikes caused by biological artifacts.
4.
Conclusion
We created three detectors for automatic epilepsy localization in MATLAB. The algorithm is designed for files in EDF format. Each of the detectors produces certain errors caused by artifacts. One type of artifact – the eye blink artifact, can be removed by algorithm described in [7].
[5] SANEI, S. and J. A. CHAMBERS. EEG signal processing. Chichester: Wiley, 2007. ISBN 987-80248-1491-9. [6] WALTER, G. The location of cerebral tumors by electroencephalography. Lancet. 1936. [7] BABUSIAK, B. and J. MOHYLOVA. Eyeblink artifact detection in the EEG. In: World Congress on Medical Physics and Biomedical Engineering. Munich: Springer Berlin Heidelberg, 2010, pp. 1166–1169. ISBN 978-3-642-03881-5. DOI: 10.1007/978-3-642-03882-2_310. [8] VASICKOVA, Z., M. PENHAKER and M. AUGUSTYNEK. Using frequency analysis of vibration for detection of epileptic seizure. In: World Congress on Medical Physics and Biomedical Engineering. Munich: Springer Berlin Heidelberg, 2010, pp. 2155–2157. ISBN 978-3-642-03881-5. DOI: 10.1007/978-3-642-03882-2_572.
Reliability of localization algorithm of each detector was compared with real clinical detection (epileptic spikes were marked by doctor). Based on a simple statistical processing we can qualify which detector is the most accurate. The lowest error rate is achieved by MF and CD with fixed limits of detection. The recording has 71.43 % accurate localization of graphoelements About Authors with MF and CD. SAD has the largest error rate. This may be caused by high sensitivity of the detector to Maria PAPEZOVA was born on 12.9.1986. In 2013 various types of artifacts. The reliability of designed she graduated (M.Sc.) at the Department of Electroalgorithms can be increased by other algorithms based magnetic and Biomedical Engineering of the Faculty on different principle, e.g. as in [8]. of Electrical Engineering at University of Zilina. Epilepsy seizures can be the first sign of brain tu- Since 2014 she is Ph.D. student at the Department mors. Additional diagnosis of brain tumor is possi- of measurement and applied electrical engineering, ble via imaging methods such as computer tomography Faculty of electrical engineering, University of Zilina. and magnetic resonance. Contrast agents are also used for enhanced detection of pathological tissues. Branko BABUSIAK was born on 17.1.1983.
c 2015 ADVANCES IN ELECTRICAL AND ELECTRONIC ENGINEERING
196
VOLUME: 13 | NUMBER: 2 | 2015 | JUNE
BIOMEDICAL ENGINEERING
In 2006 he graduated (M.Sc.) at the Department of Electromagnetic and Biomedical Engineering of the Faculty of Electrical Engineering at University of Zilina. He defended his Ph.D. in the field of technical cybernetics in 2009 at the Department of Measurement and Control of the Faculty of Electrical Engineering and Computer Science at VSB–Technical University of Ostrava; his thesis title was “Detection of eye artefacts in EEG record“. Since 2009 he is working as a tutor with the Department of Electromagnetic
and Biomedical Engineering in Zilina. His scientific research is focusing on digital signal processing of biological signals and biomedical image processing. Dagmar FAKTOROVA received her M.Sc. and Ph.D. from University of Zilina. Her research interests include microwave technique in nondestructive testing, sensor systems and interaction of electromagnetic field with biological systems.
c 2015 ADVANCES IN ELECTRICAL AND ELECTRONIC ENGINEERING
197