M.Vijayavanan et al. / International Journal of Computer Science & Engineering Technology (IJCSET)
Automatic Classification of ECG Signal for Heart Disease Diagnosis using morphological features M.Vijayavanan PG Scholar: Dept of Computer Science & Engineering Annamalai University Annamalai Nagar, Tamilnadu, India
[email protected]
V.Rathikarani Assistant Professor: Dept of Computer Science & Engineering Annamalai University Annamalai Nagar, Tamilnadu, India
[email protected]
Dr. P. Dhanalakshmi Associate Professor: Dept of Computer Science & Engineering Annamalai University Annamalai Nagar, Tamilnadu, India
[email protected] Abstract— An Electrocardiogram (ECG) is a test that records the electrical activity of the heart to locate the abnormalities. Automatic ECG classification is an emerging tool for the cardiologists in medical diagnosis for effective treatments. In this paper, we propose efficient techniques to automatically classify the ECG signals into normal and arrhythmia affected (abnormal) category. For these categories morphological features are extracted to exemplify the ECG signal. Probabilistic neural network (PNN) is the modeling technique engaged to capture the distribution of the feature vectors for classification and the performance is calculated. ECG time series signals in this work are collected from MIT-BIH arrhythmia database. The proposed an accurately classify and discriminate the difference between normal ECG signal and arrhythmia affected signal with 96.5% accuracy. Keywords- Electrocardiogram (ECG), Cardiac Arrhythmia, Discrete Wavelet Transform (DWT), Morphological features, Probabilistic Neural Network(PNN), Massachusetts Institute of Technology - Boston's Beth Israel Hospital (MIT-BIH). INTRODUCTION I. Heart is the most imperative organ of human body. According to World Health Organization (WHO) cardiovascular disease (CVD) is the major disease. which cause more people to die every year. Each year 9.4 million deaths occur each year, in this 45% deaths occur due to coronary heart disease. Traditional techniques of Visual analysis of ECG for doctors are complex and time consuming task. Visual analysis needs experience to identify the problems in ECG [1]. This paves a way for Computerized ECG. In computerized ECG the automatic classification of heart disease into normal and abnormal is done in an automated manner. Electrocardiogram is a test that is performed on the heart to detect the abnormalities in the cardiac cycle by analyzing the electrical activities of the human heart by placing 12 lead electrodes over the human surface. Thus each electrode specify some important morphological characteristics in the ECG signal. Thus for evaluating arrhythmia leads such as II, III, AVR and V5 electrodes. Thus for arrhythmia analysis the abnormalities of the p wave in the above listed electrode are to be analyzed. ECG pattern and heart rate variability may have to be observed over several hours[2]. Since visual analysis of long-term recordings of the heart activity, with more than 100,000 ECG beats in a single recording, automated computer analysis is of major significance [6]. It is a challenge to extract the most common and most important theme from amorphous raw ECG data. In this work Feature extraction in which the morphological features such as P, Q, R, S, T peak points, QRS complex duration, PR interval, QT interval, ST interval, ST segment, RR interval and PR segment are extracted. Probabilistic Neural Network is trained by using the extracted features from both Normal and Arrhythmia categories. PNN is tested using the untrained records and the performance calculation is done.
ISSN : 2229-3345
Vol. 5 No. 04 Apr 2014
449
M.Vijayavanan et al. / International Journal of Computer Science & Engineering Technology (IJCSET)
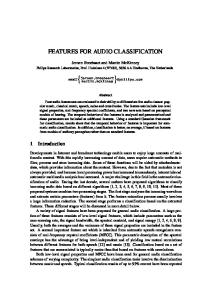
MIT-BIH Database
Preprocessing
Morphological Feature Extraction
Normal Probabilistic Neural Network (PNN) Arrhythmia Figure 1 Block Diagram of ECG Classification
A. Electrocardiogram ECG is a test that monitors the electrical activity of the heart for a certain period as detected by using the electrodes attached to the outer surface of the skin and recorded by a device external to the body. The output of each electrode is called a Lead. The 12- Lead ECG is normally taken for all the patients. It is used to calculate the rate and regularity of the heart beats, as well as the dimension and location of the chambers and the occurrence of any damage to the heart and the effects of drugs or devices used to regulate the heart. A normal sample ECG is shown in Fig.2. An ECG wave consists of P, Q, R, S, T waves. P wave is the Atria depolarization (Atrial Contraction), T wave is the depolarization of ventricles (Ventricular relaxation). QRS complex is the depolarization of ventricles (Ventricular contraction). The QRS complex, ST segment, PR interval, RR interval, PR segment, QT interval is the most important regions in an ECG signal for the diagnosis of different cardiac diseases.
Figure 2 ECG sample
B. Cardiac Arrhythmia Cardiac Arrhythmia is the irregular heartbeat or abnormal rhythm of the heart which may cause permanent damage to the heart. fundamentally there are two types of Arrhythmia called Ventricular and Supraventricular. Ventricular arrhythmia happens in the heart's two lower chambers called Ventricles and Supraventricular arrhythmia happens in the heart's upper chambers call Atrium. Depend upon the heart rate arrhythmia is classified into two types Bradycardia, Tachycardia and Fibrillated. An arrhythmia affected heart beat can be very speedy, very time-consuming and uncoordinated. The normal range of heart beat is 60-100 beats per minute. Bradycardia is slow heart rate in which the heart beats less than 60 beats per minute.
ISSN : 2229-3345
Vol. 5 No. 04 Apr 2014
450
M.Vijayavanan et al. / International Journal of Computer Science & Engineering Technology (IJCSET)
Tachycardia is high-speed heart rate in which the heart beats more than 100 beats per minute. Fibrillation is a fast uncoordinated heart beat. II. LITERATURE REVIEW The paper [3] described an automatic classification system based on combination of diverse features for the purpose of automatic heartbeat recognition. In all stages, the classifiers are based on the k-nearest neighbor algorithm. The classification accuracy of the proposed system is measured by the following sensitivity, selectivity, and specificity. The system was classified 16 heartbeat types. Their system provided a sensitivity of 85.59%, selectivity of 95.46%, and an overall average specificity of 99.56%.The paper [4] investigated the use of CWT (Continues Wavelet Transform) with two powerful data transformation techniques DWT (Discrete Wavelet Transform), and DCT (Discrete Cosine Transforms proposed and compared. The classifiers under examination are MLP (Multi-Layered Perceptron a conventional neural network) and SVM (Support Vector Machine). The training algorithms used in MLP and SVM are Back Propagation (BP), Kernel–Adatron (K–A), respectively.)[5] The paper presented a new automated diagnostic system to classification of electrocardiogram (ECG) arrhythmias. The diagnostic system was executed using type-2 fuzzy c-means clustering (T2FCM) algorithm, wavelet transform (WT) and neural network. Method of combining T2FCM and WT was used to improve performance of neural network. The paper [7] described a hybrid intelligent system for classification of cardiac arrhythmias is proposed. Three methods of classification were used. Finally, a Mamdani type fuzzy inference system was used to combine the results of several individual classifiers outputs to achieved a classification rate of 98%. The paper [8] proposed a system for cardiac arrhythmia detection in ECGs with adaptive feature selection and modified support vector machines (SVMs). Wavelet based coefficients and signal parameters are enumerated as candidates for the classification of each class pair. A k-means clustered SVM classifier and a majority based voting mechanism, was proposed to further improve the recognition rate for extremely similar classes. Their results showed that the proposed ECG analysis approach obtained a recognition rate of 98.92%.[9] This paper estimated, a neural network models with adaptive activation function were implemented to classify ECG arrhythmias. NNAAF models included three types named as NNAAF-1, NNAAF-2 and NNAAf-3. These three NNAAF models were compared with the MLP model all models tested by the ECG signals of 92 patients. The average accuracy rate of all models in the training processing was found as 99.92%.The paper [10] proposed a fractal QRS-complexes pattern recognition for imperative cardiac Arrhythmias Fractal dimension transformation (FDT) was employed to adjoin the QRS-complex of ECG signals, including the fractal features of several cardiac diseases. In this work, probabilistic neural network (PNN) classifier with morphological features are proposed for recognizing the states of cardiac physiologic function. III. FEATURE EXTRACTION Feature extraction plays a vital role in any classification system. In this work the morphological features such as P, Q, R, S, T peak points, QRS complex duration, PR interval, QT interval, ST interval, ST segment, RR interval and PR segment are extracted from the ECG signal. A. Preprocessing The ECG recording extracted from the database may consist of numerous noises such as muscle contraction, electrode displacement, patient movements or other kind of noises. Hence the signal should be preprocessed to remove these kinds of artifacts from the ECG signal. The Discrete Wavelet Transform (DWT) is used in this work. 1. Discrete Wavelet Transform (DWT) The discrete wavelet transform (DWT) is an active tool for Time-Frequency analysis of signals. Recently, Wavelets have been applied to several problems in Electro cardiology, including data compression, analysis of ventricular late potentials, and the detection of ECG characteristic points. The Wavelet transformation is a linear operation that decomposes the signal into a number of scales related to frequency components and analyses each scale with a certain resolution. The WT uses a short time interval for evaluating higher frequencies and a long time interval for lower frequencies. Due to this property, high frequency components of short duration can be observed successfully by Wavelet Transform. One of the advantages of the Wavelet Transform is that it is able to decompose signals at various levels, to remove baseline wandering on the ECG signal for efficient feature extraction. A family of analyzing wavelets in the time frequency domain is obtained by applying a scaling factor and a translation factor to the basic mother wavelet. Wavelet Transform function ψ is given by ∞
𝑤(𝑎, 𝑏) = ∫−∞ 𝑓(𝑡), 𝛹𝑎, 𝑏(𝑡)𝑑𝑡 Ψa, b(t) =
ISSN : 2229-3345
1
√𝑎
𝛹∗
�
𝑡−𝑏 𝑎
�
Vol. 5 No. 04 Apr 2014
(1)
(2)
451
M.Vijayavanan et al. / International Journal of Computer Science & Engineering Technology (IJCSET)
The DWT is sufficient for most practical applications and for the reconstruction of the signal. In this work the noise is filter done in the following way. We decompose the ECG signal into 8 levels by using DWT and reconstruct the approximation (A8) and detail (D8) signals at level 8 as shown below [3].
Figure 3 Eight Level Wavelet Decomposition
B. Morphological Feature Extraction The morphological features extracted are P, Q, R, S, T peak points, QRS complex duration, PR interval, QT interval, ST interval, ST segment, RR interval and PR segment. The R-peak has the maximum amplitude in an ECG signal. Hence the R-peak is identified by using the Daubechies 8th level reconstructed coefficients. The heart rate for each patient is calculated by finding the distance between two peaks (R-R). The other peaks are recognized by traversing the windowing function on either side of R peak. The Q and S peaks are found by traversing on the left and right side of the R peak within the specified window and locating the negative peak values. By traversing the left side of the Q peak the maximum value is located as the P peak. Likewise by traversing the right side of the S peak, the maximum value is located as the T peak within the window.
Figure 4 R-Peak Detection
The onset and offset of all points are calculated. Depending upon these data points the morphological features such as P, Q, R, S, T peak points, QRS complex duration, PR interval, QT interval, ST interval, ST segment, RR interval and PR segment are extracted.
ISSN : 2229-3345
Vol. 5 No. 04 Apr 2014
452
M.Vijayavanan et al. / International Journal of Computer Science & Engineering Technology (IJCSET)
IV. CLASSIFICATION USING PNN A probabilistic neural network (PNN) is a feed forward probability based neural network. Figure 5 shows the overall architecture of the PNN that recognizes two distinct classes, but it can be extended to any number K of classes. The input layer (on the left) contains N nodes: one for each of the N input features forming the feature vector. These are fan-out nodes such that each input feature node branch to all nodes in the hidden (pattern) layer so that each hidden node receives the complete input feature vector for each data. The hidden nodes are connected to one node called group nodes: one group for each of the K classes as shown in the figure 5. Each node in a single group of hidden layer is correspond to number of observations that are taken for training. These nodes are corresponds to a Gaussian function centered on its associated feature vector in the kth class. There are k number of groups available in the hidden layer. All of the Gaussians in a class group feed their functional values to the same output layer node for that class.
Figure 5 Architecture of Probabilistic Neural Network
Working principle of PNN At the output node for class two, all of the Gaussian values for the two classes are summed and the sum is scaled so that the overall probability volume is unity thus the sum forms a probability density function. Let there be P pattern representing feature vectors labelled as Class 1 and similarly there be Q feature vectors labelled as Class 2. PNN Algorithm: The pattern representing feature vectors have been given to form the training set. For each data in the training set, the target represent the class to which it belongs. The following steps are present in training the PNN. Step 1. Read in data representing data’s feature vector and the target representing the no. of classes and the category of each data observations. Step 2. Project these into the k groups where each group contains one class of vectors Step 3. For each k define a Gaussian function centered on each feature vector in set k define the summed Gaussian output function Once the PNN is trained, then the test unknown feature vectors can be fed into it and it is tested as follows Step 1. Read input test vector and feed it to each Gaussian function in each class Step 2. In each group of hidden layer, calculate all nodes Gaussian functional values Step 3. In each group of hidden nodes, feed all its Gaussian values to the single output node for that group Step 4. At each class node in the output layer, sum all the Gaussian values which are provided as the inputs to output layer. Step 5. Find maximum value of all summed Gaussian values at the output node.
ISSN : 2229-3345
Vol. 5 No. 04 Apr 2014
453
M.Vijayavanan et al. / International Journal of Computer Science & Engineering Technology (IJCSET)
performance of PNN in %
V. EXPERIMENTAL RESULTS The ECG dataset of Normal and Arrhythmia categories of different age groups both male and female patients are collected from MIT-BIH (Massachusetts Institute of Technology- Beth Israel Hospital) database in the recording format and it is converted into mat file. The ECG recording of about 1 hour and 2 hours durations are taken for processing. 100 80 60 Normal
40
Arrhythmia
20 0
5
10
15
20
Duration of Training Data in minutes Figure 6 Performance of PNN
Since the sampling rate is 360 Hertz, the duration of training data is 5, 10, 15 and 20 minutes respectively. The morphological features are extracted from the ECG signal of both Normal and Arrhythmia patients. About 150 records of each category are trained by using the Probabilistic Neural Network (PNN) and 50 untrained records are given for testing the PNN. The classification result is shown in Fig 6 The performance of the system is evaluated, and the method achieves about 96.5% classification rate. VI. CONCLUSIONS In this work, a system is designed to automatically categorize the ECG signals based on morphological features. Probabilistic Neural Network (PNN) employed for classifying the normal and arrhythmia categories. The database employed in this work for arrhythmia classification is collected from the numerous patient’s ECGs in the MIT-BIH resources. The system showed an accuracy of 96.5% classification rate. This study proposes a effective and reliable classification method for analyzing the ECG signals. This approach provided an computation less method to doctors for evaluating the ECG signals. The records of ECG in the MIT-BIH arrhythmia database are experimented to demonstrate the efficacy of the proposed method. The observation from the result shows that Probabilistic Neural Network (PNN) with morphological features provide the better performance. The total classification accuracy (TCA) for the experiments was about 96.5%. In future this work can be extended to diagnose various diseases using different classifiers and different feature extraction techniques. REFERENCES [1]
Serkan Kiranyaz, Turker Ince, Jenni Pulkkinen, Moncef Gabbouj, “Personalized long-term ECG classification” A systematic approach in Expert Systems with Applications, 38 (2011) 3220–3226. [2] Mehmet Korürek, Ali Nizam, “Clustering MIT–BIH arrhythmias with Ant Colony Optimization using time domain and PCA compressed wavelet coefficients” in Digital Signal Processing, 20 (2010) 1050–1060. [3] Yakup Kutlu , DamlaKuntalp, “A Multi-Stage Automatic Arrhythmia Recognition And Classification System”, ELSEVIER, Computers in Biology and Medicine 41 (2011) 37–45. [4] Hamid Khorrami , Majid Moavenian, “A Comparative Study Of Dwt, Cwt And Dct Transformations In Ecg Arrhythmias Classification”, Elsevier, Expert Systems With Applications 37 (2010) 5751–5757. [5] Yuksel Ozbay , Rahime Ceylan , Bekir Karlik, “Integration Of Type-2 Fuzzy Clustering And Wavelet Transform In A Neural Network Based Ecg Classifier” ,Elsevier, Expert Systems With Applications 38 (2011) 1004–1010 [6] L. Lu, S. Z. Li, and H. J. Zhang, “Content based audio segmentation using support vector machines”, in IEEE Int’l Conf. Multimedia and Expo, 2001,776–779. [7] Oscar Castillo, Patricia Melin, Eduardo Ramírez, José Soria“Hybrid Intelligent System For Cardiac Arrhythmia Classification With Fuzzy K-Nearest Neighbors And Neural Networks Combined With A Fuzzy System” Elsevier, Expert Systems With Applications 39 (2012) 2947–2955 [8] Chia-Ping Shen A, Wen-Chung Kao , Yueh-Yiing Yang , Ming-Chai Hsu , Yuan-Ting Wuc, Feipei Lai“Detection Of Cardiac Arrhythmia In Electrocardiograms Using Adaptive Feature Extraction And Modified Support Vector Machines” Elsevier, Expert Systems With Applications 39 (2012) 7845–7852 [9] Yuksel Ozbay A,, Gulay Tezelb“A New Method For Classification Of Ecg Arrhythmias Using Neural Network With Adaptive Activation Function”, Elsevier, Digital Signal Processing 20 (2010) 1040–1049 [10] Chia-Hung Lin , Yi-Chun Dub“Fractal Qrs-Complexes Pattern Recognition For Imperative Cardiac Arrhythmias” Elsevier, Digital Signal Processing 20 (2010) 1274–1285
ISSN : 2229-3345
Vol. 5 No. 04 Apr 2014
454
M.Vijayavanan et al. / International Journal of Computer Science & Engineering Technology (IJCSET)
[11] Amit k. mishra , shantanu raghav“local fractal dimension based ecg arrhythmia classification” elsevier, biomedical signal processing and control 5 (2010) 114–123 [12] Abdelhamid Daamouchea, Latifa Hamamib, Naif Alajlanc, Farid Melgania“A Wavelet Optimization Approach For Ecg Signal Classification” Elsevier, Biomedical Signal Processing And Control 7 (2012) 342– 349 [13] P. Dhanalakshmi, S. Palanivel, V. Ramalingam, “Classification of Audio Signals Using SVM and RBFNN” in Elsevier, (2009), 60696075 [14] Kemal Polat, Seral Sahan and SalihGunes, “A new method to medical diagnosis: Artificial immune recognition system AIRS with fuzzy weighted preprocessing and application to ECG arrhythmia” in Expert Systems with Applications, 31(2006) 264-269, August [15] Yakup Kutlun and DamlaKuntalp, “A multi-stage automatic arrhythmia recognition and classification” system in Computers in Biology and Medicine, 41(2011), 37-45, January. [16] Mehmet Korurek and Ali Nizam, “A new arrhythmia clustering technique based on Ant Colony Optimization” in Journal of Biomedical Informatics, 41(2008), 874-881, February. [17] Yüksel Özbay, Rahime Ceylan and Bekir Karlik, “A fuzzy clustering neural network architecture for classification of ECG arrhythmias” in Computers I Biology and Medicine, 36(2005),376-388,April [18] Chia-Hung Lin, Yi-Chun Du and Tainsong Chen, “Adaptive wavelet network for multiple cardiac arrhythmias recognition” in Expert Systems with Applications, 34(2008),2601-2611, May. [19] Majid Moavenian and Hamid Khorrami, “A qualitative comparison of Artificial Neural Networks and Support Vector Machines in ECG arrhythmias classification” in Expert Systems with Applications, 37(2010),3088-3093, April [20] Hamid Khorrami and Majid Moavenian, “A comparative study of DWT, CWT and DCT transformations in ECG arrhythmias classification” in Expert Systems with Applications, 37(2010), 5751-5757, August. [21] Mehmet Korürek and Ali Nizam, “Clustering MIT– BIH arrhythmias with Ant Colony Optimization using time domain and PCA compressed wavelet coefficients” in Digital Signal Processing, 20(2010), 1050-1060, July. [22] Yu, S. N., & Chen, Y. H. (2007). “Electrocardiogram beat classification based on wavelet transformation and probabilistic neural network” Pattern Recognition Letters, 28, 1142– 1150.
ISSN : 2229-3345
Vol. 5 No. 04 Apr 2014
455