383
Augmented Landform – An Educational Augmented Reality Tool for Landscape Architecture Students Olaf SCHROTH1 and Chenyi ZHANG1 1
University of Sheffield, Sheffield/United Kingdom ·
[email protected]
Abstract This paper describes the development and evaluation of an educational Augmented Reality application for mobile phones that supports landscape architecture students who learn how to read and analyse contour maps. The results show that Augmented Reality can enhance appeal and clearness of a paper contour map but if too much information is presented, it could also confuse the map information.
1
Introduction
ERVIN (2001) concludes that research and development of immersive display techniques and haptic interfaces is required to further engage the whole array of human senses into digital landscape models. In this context, Augmented Reality (AR) is a powerful new technology that could push the development of more haptic display techniques forward. AR describes “emerging technology by which a user's view of the real world is augmented with additional information from a computer model” (AZUMA 2001). BISHOP (2000) includes AR as one of four presentation media in his revised research framework for landscape. Authors such as LANGE (2011) or GHADIRIAN & BISHOP (2008) see huge potentials in the combination of AR with GIS as a new approach to realistic landscape visualization. However, most authors refer to the use of geo-located AR on-site with mobile devices augmenting reality. Examples are GILL & LANGE’s (2013) augmentation of a planning proposal for a site in Sheffield as an overlay on top of the camera image of a tablet; and MORGAN, GILL & LANGE’s (2012) augmentation of bird survey data illustrating the location of bird habitats in the urban environment. JOYE et al. (2012) present a “mobile augmented reality” application in Layar reading points of interest from an Esri ArcGIS database and representing as augmented 3D landmarks. In addition to geo-located AR, a second type of AR applications has evolved that works with image recognition instead of geo-location and enhances small objects such as maps through additional virtual information. HARRAP et al. (2012) present an adaptation for a physical board game but there is still a gap in using up-to-date augmented reality for the enhancement of maps and models. It is the first aim of this study to develop a prototype for the augmented visualization of landform on top of a contour map. Second aim is to test the appeal and visual clarity of augmentted terrain maps for landscape architects in an empirical experiment. The criteria “appeal” and “visual clarity” were derived from SHEPPARD (2001).
Wissen Hayek, U., Fricker, P. & Buhmann, E. (Eds.) (2014): Peer Reviewed Proceedings of Digital Landscape Architecture 2014 at ETH Zurich. © Herbert Wichmann Verlag, VDE VERLAG GMBH, Berlin/Offenbach. ISBN 978-3-87907-530-0.
384
O. Schroth and C. Zhang
2
Augmented Reality in Landscape Architecture
2.1
Augmented reality on mobile phones as educational technology to enhance map reading
Already in 2002, BOBRICH and OTTO developed a prototype for the augmentation of maps through a Head-Mounted Display (HMD) since mobile phone technology was not ready for widespread application at the time. They looked into the information that is communicated through analogous maps, how we interact with analogous maps, additional potential of digital information, how handling techniques could be optimized and how to integrate all these themes in an AR-map. They conclude that the augmentation of physical maps allows natural interaction between users and the system. BROLL et al. (2000) add as advantages that multiple users can interact with the map at the same time and that this rather natural form of interaction is particularly well suited for 3D objects. In contrast to the previously mentioned authors, our project is taking advantage of new mobile phone technology (socalled smartphones), i.e. built-in cameras, Global Positioning System (GPS) and accelerometers capable of rough orientation estimation as well as bearing orientation (HARRAP et al. 2012). Since learning to ‘read the landscape’ – a skill that in essence can only be acquired in the field – is an essential part of a landscape architect’s education, such system could be used to enrich landscape analysis for students. In addition, AR could also allow students to go on augmented landscape walks as a learning activity (JOYE et al. 2012). Our goal is to use AR as a learning tool on a mobile phone augmenting terrain maps for landscape architecture students who learn how to read contours. HARRAP et al. (2012) demonstrate that AR on mobile devices is an effective educational technology that can engage and educate young students about technology, spatial relations, and sustainability. On the other hand, LIESTOL (2011) points out that the technology itself is still immature in many aspects. JOYE et al. (2012) conducted a survey among 20 Dutch students to inquire the learning effect of using AR in higher education. However, two thirds of the test group felt that the augmented reality technology was still too premature to have practical use in education. They suggest making the workflow more user-friendly, e.g. through an extension for ArcMap, and working on an open standard for AR.
2.2
Visual representation of contour lines in landscape architecture
ERVIN (2001) described the basic characteristics of digital terrain or landform in his research agenda for landscape visualization. Technically, there are six approaches of representing landform digitally: spot elevations, contour lines (including 3D), 3D grid mesh, ruled surfaces, triangulated surfaces and arbitrarily curved surfaces (NURBs). All approaches have individual strengths and weaknesses and some are more suitable for certain spatial analyses than others. Second, the representation of digital terrain is determined by its surface texture or coloring. Textures can technically consist of simple tiles, procedural tiles (i.e. tiles that are generated on the fly) and geospecific textures such as aerial or satellite imagery. LAMEIRAS et al. (2009) further distinguished different representations of surface coloring for digital terrain models and classified 12 different types. From these representations, contour lines and the colour by elevation scheme assisted Lameiras' students most in reading the landform in two courses at master level.
Augmented Landform – An Educational Augmented Reality Tool
385
Regarding the interface design, KIEFERLE and WÖSSNER (2003) combined AR with Virtual Reality (VR) using AR as tangible interface to an architectural model. The AR interface allows projecting different scenarios or even animations, e.g. people flows, onto the model. In his PhD thesis, GILL (2013) conducted a self-reported media choice experiment in which students could work freely on a landscape design task related to flooding with 2D maps, a photomontage from a viewpoint, a 3D walkthrough and an interactive 3D model. In both experiments, the 2D maps and the interactive 3D model ranked highest in terms of actual usage. In one of the questions, the students were asked which digital technology provided the most extra information compared to maps and again, the interactive 3D model ranked highest. In conclusion, it seems just logical to augment the tactile 2D paper map through an interactive 3D model.
3
Method
3.1
Workflow
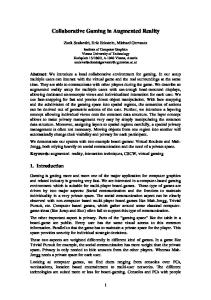
Fig. 1: Edinburgh city centre terrain as contours, coloured contours and aerial photo in 2D (© Ordnance Survey 2013), post-processed by ZHANG (2013). Depicted geodata, contour maps and associated DTMs, were obtained from the Ordnance Survey online service Digimap. Esri ArcGIS was used for the colouring of the DTMs for the prototype and matching the DTM with the aerial photo, The DTM was then exported into the cross-platform game engine Unity3D with the additional Vuforia SDK. Unity3D allows easily adding an interface and exporting the DTM as app across various mobile platforms (Android, iOS). The Vuforia SDK, a product of Qualcomm Austria Research GmbH, adds AR functionality to Unity3D including image recognition. That means, the app will recognize individual maps and automatically assign the related AR terrain model. The workflow of GIS, Unity3D and Vuforia has also been explored with 3D buildings at the Centre for Advanced Spatial Analysis CASA (HUDSON-SMITH 2013). If the workflow was further developed, the process could easily be automated, e.g. by using the FME Workbench.
386
3.2
O. Schroth and C. Zhang
Evaluation
WANG & DUNSTON (2008) conducted a similar experiment in architecture where they asked students to compare mixed reality representations of underground pipes with regard to usability. Although they used a Head-Mounted Display HMD instead of a smartphone display, their basic research question is comparable and demonstrates that an experimental setup is a valid research design for this purpose. Our experiment was set up with four different treatments, all showing the same clip of the historic Edinburgh city center: a) a paper copy of the contour map as baseline, b) the paper map and an aerial photo draped over a virtual terrain model (Triangulated Irregular Network TIN) for augmentation, c) paper map and a color-coded TIN in AR (Fig. 2), d) paper map and contour lines on top of the TIN. It was assumed that any form of augmentation would receive a higher appeal than the paper map on its own. However, goal of the study is to discover which type of augmentation will be perceived as most appealing and which one as clearest.
Fig. 2:
Color-coded elevation map draped over AR terrain.
Paper map and AR prototype were presented on a standard 4.3-inch Android smart phone (480 x 800 pixels resolution) to 23 landscape architecture students. Students could switch the AR representation through a menu on the touch interface. In addition, the supervising student guided them to make sure that they would see all three AR representations for roughly the same time. Afterwards, the students rated perceived appeal and clearness of the baseline and the three AR representations on a scale of 1 (lowest) to 5 (highest). Further space was provided for qualitative suggestions how to improve the application. The responses were summarized in descriptive statistics. Since the Q-Q-Plot points to a normal distribution, differences in appeal and clearness were tested for significance with the paired samples test in SPSS.
Augmented Landform – An Educational Augmented Reality Tool
4
387
Results
The AR aerial draped over a TIN received the highest mean rating overall in terms of “appeal” (Table 1) and all three AR representations were rated significantly higher than the paper map (Table 3). In contrast, the AR aerial draped over a TIN received the lowest mean rating overall in terms of “clearness” (Table 2). The mean was significantly lower than the other two AR representations, i.e. AR terrain with contour lines and AR terrain with colorcoded elevation map (Table 4). All 23 respondents provided qualitative comments providing suggestions for potential applications in landscape architecture and how to improve clearness and usability of the AR application. The suggestions were further clustered and summarized for the analysis and one key point is the request for a visualization of building mass models as AR layer. Table 1: Descriptive statistics / visual appeal
Table 2: Descriptive statistics / clearness
Table 3: Paired Samples Test / visual appeal
388
O. Schroth and C. Zhang
Table 4: Paired Samples Test / clearness
Pair 1: Contour map on paper – map on paper with aerial textured AR Pair 2: Contour map on paper – map on paper with colour map textured AR Pair 3: Contour map on paper – map on paper with contours textured AR Pair 4: Map on paper with aerial textured AR – map on paper with colour map textured AR Pair 5: Map on paper with aerial textured AR – map on paper with contour textured AR Pair 6: Map on paper with colour map textured AR – map on paper with contour textured AR
5
Conclusions and Outlook
In summary, all respondents showed great interest in the augmented map and found it more appealing than the 2D paper map on its own. Though despite the high appeal, the AR could also confuse the understanding of landform. The “clearness” rating was significantly lower for the aerial photo texture than it was for the color-coded AR elevation map or the AR contour map. It may be concluded that the aerial photo map is more suitable for representtative tasks whereas AR color-coded elevation map and AR contour map could be powerful tools for the understanding of landform in learning and teaching and in the dialogue with clients. The rather small sample size of n=23 means that the results are not representative. However, these results indicate a trend and it is suggested to test the preferences for the aerial photo as more appealing and for the color-coded elevation map as more legible AR representations with a larger sample size. The app will now be applied in a 1st-year undergraduate module for landscape architects, in which the novice students learn reading contour maps and representing terrain in different forms, e.g. drawing, clay model, DTM. In the more advanced modules, the app could be applied for the presentation and communications of design proposals with a strong terrain component. Alternatively to image recognition in Vuforia, a so-called QR tag placed on the presentation poster can direct the viewer to the augmented representation on a mobile device. Beyond landscape architecture and architecture (see KIEFERLE & WÖSSNER 2003), applications in education are feasible (LIESTOL 2011). Therefore, the results from this study inform the SSHRC (Social Sciences and Humanities Research Council Canada) funded project “Future Delta 2” at the University of British-Columbia, which aims to develop an educational game with an AR component about climate change mitigation and adaptation. Based on the Edinburgh prototype, the Future Delta 2 team is currently developing an application that will augment a paper-based city map with a 3D city model in level of detail 1 (massing model). In this model, students can examine flood risk zones in relation to the topography and to residential areas. Further research into the application of AR in
Augmented Landform – An Educational Augmented Reality Tool
389
landscape design on site is ongoing at the University of Sheffield. Furthermore, augmented terrain could also facilitate the understanding of visibility studies if overlain by viewshed layers. Last not least, AR terrain applications could be a powerful communication tool for results of dynamic environmental models, e.g. microclimate or air / water flows, species migration, or transport models. It allows the augmentation of a static but very haptic or tactile map with animations. In terms of the display, it might be worth revisiting BOBRICH & OTTO's (2002) experiment with a head-mounted display (HMD) and further developing it with the new HMD under development through Oculus Rift and Sony. These devices receive wide spread attention as a possible technological leap towards virtual reality. Another potentially powerful device, more suited for AR, is Google glasses although it only covers a very small field of view. Said that, it is not sufficient for landscape visualization research to chase the latest technologies but first it is required to start from the needs of the landscape profession or in this case, from the needs in landscape architecture and planning education.
References AZUMA, R. T. (2001), Augmented Reality: Approaches and Technical Challenges. In: Barfield & Caudell (Eds.), Fundamentals of Wearable Computers and Augmented Reality. Lawrence Erlbaum Associates, Mahwah New Jersey/London, 27-63. BISHOP, I. D. (2000), Environmental information and technology: Is it all too much? Landscape and Urban Planning 47 (3-4), 111-114. DOI:10.1016/S0169-2046(99)00078X. BOBRICH, J. & OTTO, S. (2002), Augmented maps. International Archives of Photogrammetry. Remote Sensing and Spatial Information Sciences, 34 (4), 502-505. BROLL, W., MEIER, E. & SCHARDT, T. (2000), The Virtual Round Table – a Collaborative Augmented Multi-User Environment. In: Proc. of the ACM Collaborative Virtual Environments (CVE 2000), San Francisco, Sep. 10-12, 2000, ACM, New York, 39-46. ERVIN, S. M. (2001), Digital landscape modeling and visualization: a research agenda. Landscape and Urban Planning, 54, 49-62. GHADIRIAN, P. & BISHOP, I. (2008), Integration of augmented reality and GIS: A new approach to realistic landscape visualisation. Landscape and Urban Planning, 86 (3-4), 226-232. GILL, L. & LANGE, E. (2013), Visualizing landscapes. In: Howard, P., Thompson, I. & Waterton, E. (Eds.), The Routledge Companion to Landscape Studies. Routledge, London/New York, 417-426. GILL, L. (2013), A 3d landscape information model – Using real-time 3D graphics for sitebased landscape design. PhD thesis, University of Sheffield. http://etheses. whiterose.ac.uk/4879/391/LewisGill.Thesis.pdf (27.12.2013). HARRAP, R., DANIEL, S., POWER, M., PEARCE, J. & HEDLEY, N. (2012), Design and Implementation of Mobile Educational Games: Networks for Innovation. In: Chrisman, N. & Wachowicz, M. (Eds.), The Added Value of Scientific Networking: Perspectives from the GEOIDE Network Members 1998-2012. GEOIDE, Quebec City.
390
O. Schroth and C. Zhang
HUDSON-SMITH, A. (2013), Augmented-Reality City Table Top – Unity, CityEngine and Vuforia. London, UCL. Available from: http://www.digitalurban.org/2013/04/ augmented-reality-city-table-top-unity-cityengine-and-vufoira.html (accessed 12th December 2013). JOYE, R., VERBEKEN, J., HEYDE, S. & LIBBRECHT, H. (2012), Location-aware Mobile Devices and Landscape Reading. In: Buhmann, E., Ervin, S. & Pietsch, M. (Eds.), Peer Reviewed Proceedings of Digital Landscape Architecture 2012 at Anhalt University of Applied Sciences. Wichmann, Berlin/Offenbach, 425-436. KIEFERLE, J. & WÖSSNER, U. (2003), Mixed Realities: Improving the Planning Process by Using Augmented and Virtual Reality. In: Buhmann, E. & Ervin, S. (Eds.), Peer Reviewed Proceedings of Digital Landscape Architecture 2003 at Anhalt University of Applied Sciences. Wichmann Verlag, Heidelberg, 192-201. LAMEIRAS, J. M., JORGENSEN, I. & MARQUES, P. F. (2009), Digital Terrain Modelling in Landscape Architecture. In: Buhmann, Kieferle, Pietsch, Paar & Kretzler (Eds.), Peer Reviewed Proceedings of Digital Landscape Architecture 2009 at Anhalt University of Applied Sciences. Wichmann, Berlin/Offenbach, 444-454. LANGE, E. (2011), 99 volumes later: We can visualise. Now what? Landscape and Urban Planning, 100 (4), 403-406. LIESTOL, G. (2011), Learning through Situated Simulations: Exploring Mobile Augmented Reality. Research Bulletin, 1, 1-14. MORGAN, E., GILL, L., LANGE, E. & DALLIMER, M. (2012), Integrating bird survey data into real time 3d visual and aural simulations. In: Buhmann, E., Ervin, S. & Pietsch, M. (Eds.), Peer Reviewed Proceedings of Digital Landscape Architecture 2012 at Anhalt University of Applied Sciences. Wichmann, Berlin/Offenbach, 278-285. SHEPPARD, S. R. J. (2001), Guidance for crystal ball gazers: developing a code of ethics for landscape visualization. Landscape and Urban Planning, 54 (1-4), 183-199. DOI:10.1016/S0169-2046(01)00135-9. WANG, X. & DUNSTON, P. (2008), User perspectives on mixed reality tabletop visualization for face-to-face collaborative design review. Automation in Construction, 17 (4), 399412. DOI:10.1016/j.autcon.2007.07.002.