World Academy of Science, Engineering and Technology International Journal of Computer, Electrical, Automation, Control and Information Engineering Vol:8, No:2, 2014
ATM Service Analysis Using Predictive Data Mining S. Madhavi, S. Abirami, C. Bharathi, B. Ekambaram, T. Krishna Sankar, A. Nattudurai, N. Vijayarangan
International Science Index, Computer and Information Engineering Vol:8, No:2, 2014 waset.org/Publication/9997660
Abstract—The high utilization rate of Automated Teller Machine (ATM) has inevitably caused the phenomena of waiting for a long time in the queue. This in turn has increased the out of stock situations. The ATM utilization helps to determine the usage level and states the necessity of the ATM based on the utilization of the ATM system. The time in which the ATM used more frequently (peak time) and based on the predicted solution the necessary actions are taken by the bank management. The analysis can be done by using the concept of Data Mining and the major part are analyzed based on the predictive data mining. The results are predicted from the historical data (past data) and track the relevant solution which is required. Weka tool is used for the analysis of data based on predictive data mining.
Keywords—ATM, Bank Management, Data Mining, Historical data, Predictive Data Mining, Weka tool. I. INTRODUCTION
S
INCE the past few years, the banking sector has seen a considerable application of diverse technologies for its daily operations. The significance of such technologies has been the introduction of ATMs. ATMs provide a critical service to bank customers and an increasingly important source of revenue to the banks themselves. ATM Transactions have become an essential component of the banking industry. The downside of this vital role of ATMs is, that downtime in ATM machines can result in major complications for financial institutions and cause customers to be dissatisfied, ultimately leading to lose revenues and decreased profitability [9], [10].
Mrs. S. Madhavi is with the K. S. Rangasamy College of Technology, Tiruchengode. Namakkal-637215 Tamilnadu, India. She is now with Department of Computer Science and Engineering as an Associate Professor (phone: +91-9095060950; e-mail:
[email protected]). Mr. B. Ekambaram Jr. is with the Computer Science and Engineering Department at K. S. Rangasamy College of Technology, Tiuchengode Namakkal-637215 Tamilnadu, India (phone:+91-9042611042; e-mail:
[email protected]). Ms. S. Abirami is with the Computer Science and Engineering Department at K. S. Rangasamy College of Technology, Tiuchengode Namakkal-637215 Tamilnadu, India (phone: +91-9688098282; e-mail:
[email protected]). Mr. T. Krishna Sankar Jr. is with the Computer Science and Engineering Department at K. S. Rangasamy College of Technology, Tiuchengode Namakkal-637215 Tamilnadu, India (phone: +91-8015369687; e-mail:
[email protected]). Mr. C. Bharathi Jr., is with the Computer Science and Engineering Department at K. S. Rangasamy College of Technology, Tiuchengode Namakkal-637215 Tamilnadu, India (phone:+91-9789281802; e-mail:
[email protected]). Mr. A. Nattudurai, Jr. is with the Computer Science and Engineering Department at K. S. Rangasamy College of Technology, Tiuchengode Namakkal-637215 Tamilnadu India (phone:+91-9159260250; e-mail:
[email protected]). Dr. N. Vijayarangan is a senior scientist in TCS Innovation Labs, Chennai (e-mail:
[email protected]).
International Scholarly and Scientific Research & Innovation 8(2) 2014
Traditional means of compensating for these potential complications have often meant deploying extra manpower and equipment in an expensive and unproductive manner. The work be undertaken; takes this one step further by utilizing the data obtained from the analysis of ATM transaction over a period of time, to anticipate complications before they impact the ATM transaction stream by visualizing the usage level of ATM machines and a prediction that helps to manage the ATM system effectively. For this analysis we used the concept of predictive data mining tool called Weka tool. II. DATA MINING Data mining is a detailed process of analyzing large amounts of data and picking out the relevant information. It is the process of extracting or mining knowledge from large amounts of data. Among the various types of data mining, this work deals with predictive data mining. Predictive analytics is an area of data mining that deals with extracting information from database and using it to predict trends and behavior patterns of the system. With a help of open source tools we can predict the system [1]-[3], [7]. Here are some notable open source predictive analytic tools include: • Weka • KNIME • Orange • R • Rapid Miner Predictive mining can be classified into Classification, Regression and Support Vector Machine. A. Classification Model The goal of classification is to construct a model using the historical data that accurately predicts the label (class) of the unlabeled information. Various classification algorithms use different techniques for finding relations between the predictor attribute's value and the target attribute's value in the built data [2], [5]. The various algorithms which are available in the classification are Naive Bayes, Adaptive Bayes Network and Support Vector Machine. B. Naive Bayes Algorithm Naive Bayes uses cross-validation, test model accuracy on the same data that was used to build the model rather than building the model on one portion of the data and testing it on a different portion [2], [8]. This algorithm is fast and effective for the low volume of data. The volume limit will fall within 200 records but it is not suitable to handle large volume of data.
311
scholar.waset.org/1999.4/9997660
World Academy of Science, Engineering and Technology International Journal of Computer, Electrical, Automation, Control and Information Engineering Vol:8, No:2, 2014
International Science Index, Computer and Information Engineering Vol:8, No:2, 2014 waset.org/Publication/9997660
C. Adaptive Bayes Network (ABN) algorithm ABN is single feature build mode which can describe the model in the form of human-understandable rules. The rules produced by ABN are one of its main advantages over Naïve Bayes [5], [6]. ABN produces more accurate result when compared to Naive Bayes. ABN also supports the large volume of data processing and produces the result in the short span of time.
Type Deposit Withdrawal Deposit Withdrawal Withdrawal Withdrawal Deposit Withdrawal Withdrawal Withdrawal Deposit Withdrawal Withdrawal Deposit Deposit Withdrawal Withdrawal Withdrawal Withdrawal Withdrawal Withdrawal Deposit Withdrawal Withdrawal Deposit Withdrawal Transfer Withdrawal Withdrawal Withdrawal
D. Support Vector Machine (SVM) The SVM optimization procedure maximizes predictive accuracy while automatically avoiding over-fitting the training data. It performs well with real world applications such as classifying text, recognizing hand-written characters, classifying images, as well as bioinformatics and bio sequence analysis. It is a standard tool for machine learning [2]. But SVM is a time consuming for a large volume of data and hence use some other algorithms but it will degrade the classification performance. Hence the SVM cannot be used here [11], [12]. E. Introduction to Weka Tool Weka tool works on Classification model. It supports process of large volume of data. Weka tool consists of multiple data mining techniques and various machine learning algorithms [4], [5]. Weka tool does not allow the user to split the data according to the user convenience. It will process the entire data which the data contained by the user. If user wants to process the partial data, then the data must be fragmented manually by the user according to the user requirements. III. PROBLEM DEFINITION ATM is mostly used to reduce the work of banks. But nowadays it has several drawbacks in its service. Some of them are; • Banks could not predict/check the ATM usage level, • Banks could not identify peak time of an ATM in a day/month, • Most used transaction type in an ATM is not spotted. Objective of this work is to provide the graphical visualization for easy identification of ATM usage level and to monitor the ATM peak time. We have analyzed a sample of 30 records of ATM transaction on a particular day. Table I shows the sample set of ATM data which contains various types of transactions in different ATM system. This data also contains the record of various time periods in a particular day. Sample ATM data are processed using the Weka tool and the results are shown below. The type of transaction happens in the ATM machine are clearly classified as follows, using Weka tool.
TABLE I ATM DATA SET Location Hour CampusB 0 CampusB 0 DriveUp 0 DriveUp 0 CampusB 4 DriveUp 5 DriveUp 6 DriveUp 6 DriveUp 6 DriveUp 6 DriveUp 6 DriveUp 6 DriveUp 7 DriveUp 7 DriveUp 7 DriveUp 7 CampusB 7 DriveUp 7 CampusB 7 DriveUp 7 DriveUp 8 DriveUp 8 DriveUp 8 CampusB 8 DriveUp 8 CampusB 8 CampusB 8 DriveUp 8 DriveUp 8 DriveUp 8
Amount 100 10 71 40 50 60 72 40 80 20 65 60 20 373 1002 20 20 150 60 120 110 1000 50 30 785 60 10 200 20 100
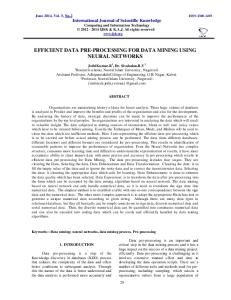
Fig. 1 Transaction type of Sample data 1
X-axis = Type of transactions Y-axis = Occurrence of Transactions The colors above graph indicate; Red -Withdraw (70%) Blue -Deposit (26.6%) Cyan -Transfer (3.33%) From Fig. 1, withdraw happens regularly and occurs in a huge range while compared with other type of transactions and number of transactions occurred in each type is also analyzed in the graph.
International Scholarly and Scientific Research & Innovation 8(2) 2014
312
scholar.waset.org/1999.4/9997660
World Academy of Science, Engineering and Technology International Journal of Computer, Electrical, Automation, Control and Information Engineering Vol:8, No:2, 2014
The locations from which the data are being retrieved are shown as follows;
International Science Index, Computer and Information Engineering Vol:8, No:2, 2014 waset.org/Publication/9997660
Fig. 4 Transacted amount range
Drive Up (26.67%)
X-axis = Transacted amounts Y-axis = Occurrence of Transactions
Campus B (73.33%)
IV. SUPPLEMENTARY ANALYSIS
Fig. 2 Location of Transaction occurs
X-axis = Transaction of various ATMs Y-axis = Occurrence of Transactions From Fig. 2, the locations of ATM, types of transaction occurred in each ATM and number of transactions occurred are shown. The transaction in the ATMs for a particular day (24 hours), are shown as follows.
The project extended to 14,913 records for 30 days and the predicted results are shown. The type of transaction from the ATM data is classified and the ATM usage level is also shown.
Fig. 5 Transaction type of Real data
X-axis = Type of transactions Y-axis = Occurrence of Transactions The colors in the above graph indicate; Red - Withdraw (71.85%) Blue - Deposit (24.5%) Cyan - Transfer (2.82%) Gray - Advance (0.76%)
Fig. 3 Transaction at particular time
X-axis = Time in hours (24-hr format) Y-axis = Occurrence of Transactions From Fig. 3, the maximum transaction occurred in ATM for a particular hour and type of transactions occurred in each hour are mentioned. Transaction amount between the maximum and minimum range are identified and type of transaction which takes highest range are also shown.
International Scholarly and Scientific Research & Innovation 8(2) 2014
The location based transactions are listed.
313
scholar.waset.org/1999.4/9997660
World Academy of Science, Engineering and Technology International Journal of Computer, Electrical, Automation, Control and Information Engineering Vol:8, No:2, 2014
From Fig. 8, transaction for each day and type of transaction for each day is mentioned and each type of transaction in each day occurred in maximum range is also identified. Now the same method will apply for the single day record of the three ATMs. The type of transaction happens in the ATM machine for one day record is as follows
International Science Index, Computer and Information Engineering Vol:8, No:2, 2014 waset.org/Publication/9997660
Drive Up (46.73%)
Campus A (4.41%)
Campus B (48.84%)
Fig. 6 Location of Transaction occurs
X-axis = Transaction of various ATMs Y-axis = Occurrence of Transactions
One day analysis for the various ATM transactions is shown.
Fig. 9 Transaction of one day record
X-axis = Type of transactions Y-axis = Occurrence of Transactions Red - Withdraw (66.23%) Blue - Deposit (29.2%) Cyan - Transfer (4.07%) Gray - Advance (0.48%)
Fig. 7 Transactions at particular time of real data
From Fig. 9, the withdraw action can happen frequently and need to care the flow of amount in ATM. The locations from which the money are being transferred are represented in the graph below.
X-axis = Time in hours (24-hr format) Y-axis = Occurrence of Transactions From Fig. 7, the peak time at the ATM was around 12 noon. The overall transaction in the ATMs for each day is shown as follows.
Drive UP (47.3%)
Campus A (4.89%)
Campus B (47.79%)
Fig. 10 Location of Transaction occurs
X-axis = Transaction of various ATMs Y-axis = Occurrence of Transactions
Fig. 8 Transaction of 30 day records
X-axis = 30 days Transaction of various ATMs Y-axis = Occurrence of Transactions
International Scholarly and Scientific Research & Innovation 8(2) 2014
Fig. 10 shows that transaction at Drive Up and Campus B are nearly around 50%. But at Campus A, it is around 5%. Hence the usage of ATM at Campus A is quite rare.
314
scholar.waset.org/1999.4/9997660
World Academy of Science, Engineering and Technology International Journal of Computer, Electrical, Automation, Control and Information Engineering Vol:8, No:2, 2014
International Science Index, Computer and Information Engineering Vol:8, No:2, 2014 waset.org/Publication/9997660
The transaction in the ATMs for a particular day (24 hours), is shown as follows.
Fig. 11 Transactions at particular time of Real data
X-axis = Time in hours (24-hr format) Y-axis = Occurrence of Transactions Fig. 11 shows that the peak time for the particular day in the ATM is around 11 AM to 12 PM.
[2]
Oracle Data Mining Concepts, 10g Release 1 (10.1), Part Number B10698-01, ‘Predictive Data Mining Models‘, file:///H:/project/ PAPERS/New%20Mining%20Papers/Predictive%20Data%20Mining%2 0Models.htm [3] Dr. Wenjia Wang; ‘Data Mining and Statistics within the Health Services’, 19/02/2010 [4] Zdravko Markov, Ingrid Russell; ‘An Introduction to the WEKA Data Mining System’, Central Connecticut State University [5] By Wayne W. Eckerson; ‘Predictive Analytics Extending the Value of Your Data Warehousing Investment’, TDWI Best Practices Report, First quarter 2007 [6] Mehta Neel B, ‘Predictive Data Mining and Discovering Hidden Values of Data Warehouse’, ARPN Journal of Systems and Software, Volume 1 No. 1, APRIL 2011 [7] S Abdulsalam Sulaiman Olaniyi, Adewole, Kayode S, Jimoh, R. G; ‘Stock Trend Prediction Using Regression Analysis –A Data Mining Approach’, ARPN Journal of Systems and Software, Volume 1 No. 4, July 2011 [8] Godswill Chukwugozie Nsofor; ‘A Comparative Analysis Of Predictive Data-Mining Techniques’, August, 2006 [9] Ghulam Mujtaba Shaikh and Tariq Mahmood; Mining and Adaptivity in Automated Teller Machines, 2012 [10] Vasumathi, Dhanavanthan, 2010, “Application of Simulation Technique in Queuing Model for ATM Facility”, Volume 1, No 3 [11] Hyun-Chul Kim, Shaoning Pang, Hong-Mo Je, Daijin Kim, and SungYang Bang; Support Vector Machine Ensemble with Bagging, 2002 [12] Burges, C; ’A Tutorial on Support Vector Machines for Pattern Recognition. Data Mining and Knowledge Discovery’. 2(2) (1998) 121– 167 397, 400.
V. PREDICTED RESULTS • • •
• •
The ATM usage for every location is calculated. The further decision about providing service to the customer is left with the bank management. The location of the ATM which provides the service to the customer is identified with their usage level. The type of transaction which occurs regularly are recognized and based on the type of transaction, the service will provide more efficiently than the normal present situation. The peak hour of an ATM is identified from the large set of data and hence the service will provide a better way in that particular peak hour. The peak day of an ATM in a month is also revealed and the bank management will maintain the money stock in that particular ATM and hence reduce the situation of out of stock in that ATM. VI. CONCLUSION
Nowadays ATMs do not have more analysis. These analyses will improve the quality of the service of ATMs. Analyses of ATM service through Weka tool visualize the process for a whole day/month. So Peak level and idle level of the ATM are known. From the analysis, one can predict the ATM usage for next stage. The predictive data mining will really helpful for the analysis of the ATM data and process the large set of records by a predictive mining (Weka) tool. REFERENCES [1]
Arvind Sharma, P.C. Gupta; ‘Predicting the Number of Blood Donors through Their Age and Blood Group by using Data Mining Tool’, International Journal of Communication and Computer Technologies, Volume 01 – No.6, Issue: 02, September 2012.
International Scholarly and Scientific Research & Innovation 8(2) 2014
315
scholar.waset.org/1999.4/9997660