This article was downloaded by: [Bibliothèque de l' Université Paris Descartes] On: 12 August 2013, At: 14:59 Publisher: Routledge Informa Ltd Registered in England and Wales Registered Number: 1072954 Registered office: Mortimer House, 37-41 Mortimer Street, London W1T 3JH, UK
Journal of Clinical and Experimental Neuropsychology Publication details, including instructions for authors and subscription information: http://www.tandfonline.com/loi/ncen20
Assessment of socioemotional processes facilitates the distinction between frontotemporal lobar degeneration and Alzheimer’s disease ab
a
ac
c
Pauline Narme , Harold Mouras , Martine Roussel , Agnès Devendeville & Olivier ac
Godefroy a
Laboratoire de Neurosciences Fonctionnelles et Pathologies (EA 4559), Département de Médecine, Université de Picardie Jules Verne, Amiens, France b
Equipe Neuropsychologie du Vieillissement (EA 4468), Institut de Psychologie, Université Paris Descartes, France c
Département de Neurologie, Centre Hospitalier Universitaire, Amiens, France Published online: 12 Aug 2013.
To cite this article: Journal of Clinical and Experimental Neuropsychology (2013): Assessment of socioemotional processes facilitates the distinction between frontotemporal lobar degeneration and Alzheimer’s disease, Journal of Clinical and Experimental Neuropsychology, DOI: 10.1080/13803395.2013.823911 To link to this article: http://dx.doi.org/10.1080/13803395.2013.823911
PLEASE SCROLL DOWN FOR ARTICLE Taylor & Francis makes every effort to ensure the accuracy of all the information (the “Content”) contained in the publications on our platform. However, Taylor & Francis, our agents, and our licensors make no representations or warranties whatsoever as to the accuracy, completeness, or suitability for any purpose of the Content. Any opinions and views expressed in this publication are the opinions and views of the authors, and are not the views of or endorsed by Taylor & Francis. The accuracy of the Content should not be relied upon and should be independently verified with primary sources of information. Taylor and Francis shall not be liable for any losses, actions, claims, proceedings, demands, costs, expenses, damages, and other liabilities whatsoever or howsoever caused arising directly or indirectly in connection with, in relation to or arising out of the use of the Content. This article may be used for research, teaching, and private study purposes. Any substantial or systematic reproduction, redistribution, reselling, loan, sub-licensing, systematic supply, or distribution in any form to anyone is expressly forbidden. Terms & Conditions of access and use can be found at http://www.tandfonline.com/page/terms-and-conditions
Journal of Clinical and Experimental Neuropsychology, 2013 http://dx.doi.org/10.1080/13803395.2013.823911
Assessment of socioemotional processes facilitates the distinction between frontotemporal lobar degeneration and Alzheimer’s disease
Downloaded by [Bibliothèque de l' Université Paris Descartes] at 14:59 12 August 2013
Pauline Narme1,2 , Harold Mouras1 , Martine Roussel1,3 , Agnès Devendeville3 , and Olivier Godefroy1,3 1
Laboratoire de Neurosciences Fonctionnelles et Pathologies (EA 4559), Département de Médecine, Université de Picardie Jules Verne, Amiens, France 2 Equipe Neuropsychologie du Vieillissement (EA 4468), Institut de Psychologie, Université Paris Descartes, France 3 Département de Neurologie, Centre Hospitalier Universitaire, Amiens, France
We explored the value of a battery of socioemotional tasks for differentiating between frontotemporal lobar degeneration (FTLD) and Alzheimer’s disease (AD). Patients with FTLD (n = 13) or AD (n = 13) and healthy controls (n = 26) underwent a neuropsychological assessment and the socioemotional battery (an empathy questionnaire, an emotion recognition task, and theory of mind tasks). Socioemotional processes were markedly impaired in FTLD but relatively unaffected in mild AD. The computed Socioemotional Index discriminated more accurately between FTLD from AD than behavioral and executive assessments did. Furthermore, impairments in socioemotional processes were correlated with indifference to others. Keywords: Dementia; Empathy; Emotion recognition; Theory of mind; Social behavior disorders; Executive function.
Frontotemporal lobar degeneration (FTLD) is a neurodegenerative disease that affects the frontal and/or temporal lobes (Wittenberg et al., 2008). The behavioral variant of FTLD (frontotemporal dementia, FTD) is characterized by early-onset deterioration in personality and social conduct, impaired executive functioning, and loss of empathy. The latter was recently included in the revised criteria for the diagnosis of FTD (Rascovsky et al., 2011). Although the temporal variant of FTLD (semantic dementia, SD) is primarily characterized by the deterioration of semantic memory (GornoTempini et al., 2011), changes in behavior and social functioning have also been reported. Patients with SD are often described as being self-centered
(Bon, Belliard, Eustache, & Desgranges, 2009; Snowden et al., 2001). The behavioral disorders remain poorly understood. It has been reported that some patients suffer from behavioral disorders in the absence of cognitive disorders (and executive disorders in particular; Eslinger & Damasio, 1985; Godefroy et al., 2010); this suggests that executive dysfunction cannot account for the behavioral disorders. Accordingly, behavioral disinhibition is not correlated with Stroop test performance in demented patients (Heflin et al., 2011). In contrast, it has been suggested that the severity of behavioral disorders is related to theory of mind (ToM; Premack & Woodruff, 1978) impairments
This work was funded by the French Ministry of Education and Research and the Picardie Regional Council. The authors are grateful to the psychologists F. Fourré-Renard, A. Routier, V. Tourbier, and S. Wannepain (Neurology Department, Amiens University Medical Center) for contributing to the neuropsychological testing. We thank the manuscript’s reviewers for their very helpful comments and David Fraser (Biotech Communication, Damery, France) for improving the manuscript’s English. Address correspondence to: Pauline Narme, Equipe Neuropsychologie du Vieillissement (EA 4559), Institut de Psychologie, Université Paris Descartes, 71 avenue Edouard Vaillant, F-92100 Boulogne-Billancourt, France (E-mail:
[email protected]).
© 2013 Taylor & Francis
Downloaded by [Bibliothèque de l' Université Paris Descartes] at 14:59 12 August 2013
2
NARME ET AL.
(Gregory et al., 2002). According to this hypothesis, impaired socioemotional processes (including not only ToM but also the ability to decode emotional signals and empathy, i.e., the ability to share and understand another person’s feelings; Decety & Jackson, 2004) may explain some of the abnormal aspects of interpersonal behavior observed in FTLD patients. However, the presence or absence of a direct relationship between socioemotional impairments and behavioral disorders in demented patients has not been investigated in detail. The assessment of socioemotional processes has emerged as a promising tool for the early diagnosis of FTD (Torralva, Roca, Gleichgerrcht, Bekinschtein, & Manes, 2009) because conventional neuropsychological tests are not sufficiently sensitive in the early stages of the disease (Hodges, 2007). To a lesser extent, a few studies have suggested that socioemotional parameters could also be used in the differential diagnosis of FTLD and Alzheimer’s disease (AD), since conventional cognitive assessment may again fail to discriminate between the two diseases (Hutchinson & Mathias, 2007). Previous studies have investigated socioemotional processes in FTLD or in AD but have rarely compared the two. Taken as a whole, the literature results show that (a) facial emotion recognition is severely impaired in FTLD, whereas AD patients’ ability is relatively unaffected in this respect (Lavenu, Pasquier, Lebert, Petit, & Van der Linden, 1999); (b) ToM is already impaired in early FTLD but is relatively unaffected in AD (e.g., Gregory et al., 2002); (c) empathy loss has been observed in FTLD, whereas empathy appears to be unaffected in AD (Rankin, Kramer, & Miller, 2005; for a review, see Kemp, Després, Sellal, & Dufour, 2012). Although socioemotional performance is rarely investigated, this parameter also appears to be impaired in SD (Bon et al., 2009; Duval et al., 2012). Some study results have indicated that AD patients may fail these tasks, although this typically reflects global cognitive disorders rather than true socioemotional impairment (FernandezDuque, Baird, & Black, 2009; Phillips, Scott, Henry, Mowat, & Bell, 2010). Overall, previous research has shown that (a) regardless of the variant considered, FTLD is associated with extensive socioemotional impairments, and (b) socioemotional functioning is less affected in AD (Shany-Ur & Rankin, 2011). To the best of our knowledge, the value of assessing socioemotional processes in the differential diagnosis of FTLD and AD has been investigated in only one study. Funkiewiez, Bertoux, de Souza, Lévy, and Dubois (2011) showed that social cognition and emotional assessment could be used to differentiate between FTD patients on one hand
and patients with AD or amnestic mild cognitive impairment on the other. However, the inclusion of very early AD patients reduced the likelihood of observing impairments in this disease group. Furthermore, Funkiewiez et al. did not directly compare their battery’s discriminative ability with those of the conventional neuropsychological tests used in routine clinical practice. Thus, the present study sought to establish (a) whether socioemotional assessment facilitates the differential diagnosis of FTLD and AD and (b) whether impaired socioemotional processes are related to other neuropsychological parameters (especially behavioral and executive disorders). We adopted a novel, multidimensional approach to the investigation of socioemotional processes by assessing empathy, emotion recognition, and ToM abilities and by comparing the latter abilities to executive functioning and behavioral status in a population of FTLD and AD patients. Based on previous work, we hypothesized that (a) the assessment of socioemotional processes would be of significant value in the differential diagnosis of FTLD and AD, and (b) impaired socioemotional processes could account for certain behavioral disorders (such as apathy, disinterest, and indifference to others and social behavioral disorders).
METHOD Population Patients attending the Memory Clinic at Amiens University Medical Center and with a diagnosis of probable AD (n = 13; McKhann et al., 2011) or FTLD (n = 13, including 2 possible and 7 probable FTD patients, Rascovsky et al., 2011, and 4 SD patients, Gorno-Tempini et al., 2011) were considered for inclusion. We excluded patients with a Mini-Mental State Examination (MMSE; Folstein, Folstein, & McHugh, 1975) score of less than 21 out of 30, past or concurrent neurological or psychiatric disorders (other than depression and anxiety), and severe impairments in visual and/or oral comprehension. The presence of impaired oral comprehension in the FTLD group was checked by using the shortened version of the Token test; patients with a score ≤ 24 out of 36 (corresponding to a moderate deficit (De Renzi & Faglioni, 1978)) were excluded from the study. The patients’ performances were compared with those obtained in 26 healthy controls (HCs), drawn from a large control group (n = 100), matched for age and the number of years in full-time education. The HCs were free of past or concurrent neurological or psychiatric conditions,
Downloaded by [Bibliothèque de l' Université Paris Descartes] at 14:59 12 August 2013
SOCIOEMOTIONAL PROCESSES IN DEMENTIA
ongoing antidepressant treatment, and signs of cognitive decline (as measured with the MMSE and the Dementia Rating Scale, DRS; Mattis, 1976). As performance of the whole control group on all experimental tasks was affected by age and education and not by gender, matching with patients did not take gender into account. All participants gave their written informed consent to participation. The study procedures complied with the Declaration of Helsinki and were only initiated after approval by the local investigational review board. Patients underwent a neuropsychological assessment in order to characterize any cognitive impairments. Global cognitive efficiency was explored by means of the DRS, language was assessed by oral naming (Deloche & Hannequin, 1989), visuospatial abilities were assessed with the visual agnosia battery (Agniel, Joanette, Doyon, & Duchein, 1992), and visuoconstructive abilities were examined in the Rey–Osterrieth Complex Figure Test (Rey, 1959). We assessed verbal episodic memory by administering the French-language version (Van der Linden et al., 2004) of the Gröber and Buschke test (Gröber & Buschke, 1987). Mood was rated on the Goldberg Anxiety Scale (Goldberg, Bridges, Duncan-Jones, & Grayson, 1988) and the Montgomery and Asberg Depression Rating Scale (MADRS; Montgomery
3
& Asberg, 1979). Executive functions were assessed by using the French adaptation (Godefroy et al., 2010) of the Trail Making Test (Reitan, 1958), the Stroop test (Stroop, 1935), the Modified Card Sorting test (Nelson, 1976) and verbal fluency tests (Cardebat, Doyon, Puel, Goulet, & Joanette, 1990). The presence of behavioral disorders in 12 domains was checked with the Behavioral Dysexecutive Syndrome Inventory (Godefroy et al., 2010), a structured informant interview that assessed changes relative to previous behavior. Here, we specifically analyzed overall hypoactivity (apathy, disinterest, indifference, and lack of concern for others) and social behavior disorders. To establish whether patients were suffering from cognitive and/or behavioral dysexecutive syndromes, we used previously validated indexes and cut-off scores (Godefroy et al., 2010). The study population’s demographic data and neuropsychological test performances are summarized in Table 1. The groups differed in terms of demographic characteristics (see Table 1) because of (a) a main effect of gender, χ 2 (2, N = 52) = 10.1, p = .007, with an overrepresentation of females in the HCs, compared with AD (p = .04, Cramer’s V = 0.33) and FTLD (p = .003, Cramer’s V = 0.47), and (b) a main effect of age, F(2, 49) = 6.3, MSE = 482,
TABLE 1 Demographic and neuropsychological performance characteristics Characteristic
FTLD (n = 13)
Age (years) Gender (male/female) Education (years) Disease duration (years) MMSE (/30) DRS (/144) MADRS (/60) Anxiety scale (/9) Verbal episodic memory (% impairment) Free recall 3 Total recall 3 Differed free recall Differed total recall Oral naming (%) Visual agnosia battery (%) Rey–Osterrieth Copy (%) Cognitive dysexecutive syndrome (%) Behavioral dysexecutive syndrome (%) Global hypoactivity (%) Disinterest (%) Social disorders (%)
62.3 ± 6.9b 11/2a 10.2 ± 2.6 3.77 ± 1.7 25.2 ± 1.5a 125.6 ± 11.6a 3.3 ± 4.6 0.8 ± 1.3 5.8 ± 4.8 (62) 11 ± 4.8 (69) 5.6 ± 4.3 (77) 10.5 ± 5 (69) 67 ± 12 (54) 46 30.4 ± 5.3 (39) 77 82 75 75 33
AD (n = 13) 74.5 ± 8.3 9/4a 10.0 ± 2.3 3.77 ± 1.5 23.6 ± 2.7a 124.3 ± 7.7a 6.4 ± 7.5 1.2 ± 1.7 2 ± 2.1 (92) 6.6 ± 3.8 (100) 0.6 ± 1.3 (92) 5.1 ± 3.6 (100) 75.4 ± 4.6 (31) 39 31.8 ± 3.5 (15) 69 50 33 17 17
HC (n = 26)
p
Effect size
68.9 ± 9.6 9/17 10.0 ± 2.1 — 27.8 ± 1.7 138.8 ± 3.6 3 ± 2.9 1.1 ± 1.6
.004§ .007 .9§ 1§ .001† .001† .1§ .8§
0.2 0.44 0.002 0 0.48 0.48 0.08 0.01
— — — — — — — — — — — —
.2 .09 .6 .09 .4 1 .3 1 .2 .04 .003 .6
0.36 0.42 0.2 0.42 0.23 0.07 0.26 0.09 0.35 0.42 0.59 0.19
Notes. Data are expressed as the mean ± standard deviation, except for gender (number) and the extent of the impairment (percentage). Fisher exact test was conducted except when indicated: § one-way ANOVA with post hoc; † one-way ANOVA with age as covariate. ANOVA = analysis of variance; FTLD = frontotemporal lobar degeneration; AD = Alzheimer’s disease; HC = healthy controls; MMSE = Mini-Mental State Examination; DRS = Mattis Dementia Rating Scale; MADRS = Montgomery & Asberg Depression Rating Scale. For effect sizes, partial eta-squared were reported, except for gender and the extent of the impairment (Cramer’s V ). a Significant difference versus HCs. b Significant difference between the FTLD and AD groups.
Downloaded by [Bibliothèque de l' Université Paris Descartes] at 14:59 12 August 2013
4
NARME ET AL.
p = .004, with a lower mean age in FTLD than in AD (p = .003, Cohen’s d = 1.6). Although the two patient groups did not significantly differ from HCs in terms of age (AD: p = .2, Cohen’s d = 0.62; FTLD: p = .09, Cohen’s d = 0.79), effect sizes were, respectively, medium and large according to Cohen’s conventions. The three groups differed in terms of MMSE, F(2, 49) = 22.4, MSE = 84, p = .001, and DRS scores, F(2, 49) = 23, MSE = 1245, p = .001. The AD and FTLD patients had lower MMSE and DRS scores than the HCs (AD: MMSE p = .001, Cohen’s d = 1.93; DRS p = .001, Cohen’s d = 2.6; FTLD: MMSE p = .001, Cohen’s d = 1.6; DRS p = .001, Cohen’s d = 1.7). Although the difference between the two patient groups was not significant (MMSE, p = .1; DRS, p = 1), the effect size for MMSE was medium (Cohen’s d = 0.5; DRS, Cohen’s d = 0.1). Significant intergroup differences were checked using an analysis of covariance (ANCOVA), with age and gender as covariates. However, both these covariates were not significant [age F(1, 47) = 0.13, p = .7, ηp 2 = .003; gender F(1, 47) = 0.02, p = .88, ηp 2 = .001]. The AD and FTLD groups did not differ significantly in terms of neuropsychological performance ratings other than overall hypoactivity, χ 2 (1, N = 24) = 4.2, p = .04, and disinterest, χ 2 (1, N = 24) = 8.2, p = .004, which were more frequent in FTLD than in AD (Table 1).
Socioemotional assessment All experimental tasks were created with E-Prime 2.0 software (Psychology Software Tools, Inc., Pittsburgh, PA, USA) and were presented on a computer with a touch-sensitive screen. The Interpersonal Reactivity Index The Interpersonal Reactivity Index (IRI) questionnaire (Davis, 1983) is constituted of four subscales that assess multidimensional aspects of empathy: the propensity to imagine oneself in fictional situations (fantasy, FS), the tendency to adopt another person’s point of view (perspective taking, PT), feelings of compassion for others (empathic concern, EC), and feelings of discomfort in tense relationships (personal distress, PD). In the original procedure, the IRI was administered to HCs as a self-questionnaire (Davis, 1983). Since loss of self-awareness is common in dementia, data have also been collected from caregivers in studies of patient groups (Rankin et al., 2005). To explore changes in empathy over time since disease onset, caregivers were asked to first describe
the current level of empathy and then estimate the premorbid level. Facial emotion recognition The ability to recognize facial emotions was examined using pictures from the Ekman database (Ekman & Friesen, 1975). Photos of the faces of 10 people expressing one of five emotions (happiness, fear, anger, disgust, and sadness) or a neutral expression were displayed on the screen. The six responses were written on the lower part of the screen. Participants were asked to touch the target emotion. Performance was scored as the number of correct responses for each emotion (out of 10; maximum score: 60). We added two control tasks: a 20face gender decision (man/woman) task to control for facial perceptive processing and a short original semantic questionnaire to check the subject’s ability to understand emotion-related words. For each concept (happiness, fear, anger, disgust, and sadness), three brief situations were given. Participants were asked to choose the situation that could elicit the target emotion. In these tasks, performance was scored as the number of correct responses. Theory of mind Theory of mind abilities were assessed using two tasks that were designed to distinguish between inferences of cognitive mental states (e.g., intentions; “cognitive ToM”) and inferences of emotional states (“affective ToM”) and between socioemotional processes and overall cognitive abilities (in control items). First, the “faux pas” test ascertained the ability to identify a social “faux pas” (Stone, BaronCohen, & Knight, 1998). Ten stories containing a social “faux pas” and 10 control stories were read to the participants, who were then asked whether a character had said something inappropriate. We adopted the scoring system proposed by Stone et al. (1998): 1 point for each correctly identified “faux pas” story (i.e., “hits,” out of 10). When a “faux pas” was identified, five explanatory questions were asked (such as “Who said something s/he should not have said or said something awkward?” or “Why shouldn’t s/he have said it?”). These questions produced the explanation score (out of 50) and also enabled us to check whether the patient had understood that the character making the rude remark had not made it intentionally (yielding the “cognitive ToM,” out of 10) and whether the person hearing the rude remark might feel offended (yielding the “affective ToM,” out of 10). A “faux pas” total score was computed by adding up the
Downloaded by [Bibliothèque de l' Université Paris Descartes] at 14:59 12 August 2013
SOCIOEMOTIONAL PROCESSES IN DEMENTIA
hits and the explanation score. Lastly, the subject’s comprehension of each story was probed with two questions (yielding the “comprehension score,” out of 40). All the “faux pas” scores were expressed in percentage of correct responses. Secondly, a French-language version of the “Yoni” task (Shamay-Tsoory & Aharon-Peretz, 2007) was administered. This task involves the ability to attribute mental states based on verbal, eye gaze, and facial expression cues and consists of 54 trials, each showing a cartoon face (called “Yoni”) surrounded by four objects or faces. The subject was asked to complete a sentence by choosing which picture Yoni was referring to, based on a sentence at the top of the screen and available cues (Yoni’s eye gaze, Yoni’s facial expression . . .). There were three conditions: cognitive ToM (“Yoni is thinking of . . .”), affective ToM (“Yoni likes . . .”), and a control condition based on the analysis of physical attributes (“Yoni is close to . . .”). In half the physical condition, Yoni’s gaze was directed toward the right response (congruent condition). In the other half, Yoni’s gaze was directed straight ahead or toward an incorrect response (incongruent condition). This characteristic was added by Shamay-Tsoory and Aharon-Peretz (2007), in order to ensure that the participants understood the task and did not respond solely and automatically to the direction of gaze (i.e., without taking verbal cues into account). The items also differed in complexity; there were first-order items (as described above) and second-order items that require an understanding of the interaction between Yoni’s mental state and another person’s mental state (e.g., “Yoni is thinking of the car that . . . wants” for cognitive ToM). Accuracy was recorded.
Statistics Group comparisons were performed using a oneway or repeated analysis of variance (ANOVA) with group (FTLD, AD, HC) as a betweengroup factor, and condition as a within-subjects factor. Bonferroni post hoc tests were applied. Effect sizes were systematically examined based on accepted Cohen’s conventions (Cohen, 1992). Considering demographic between-group differences, ANCOVAs were secondarily conducted with age and gender as covariates. We also checked that gender effects were not significant in the control group using linear regression analyses [IRI subscales: FS, F(1, 25) = 0.2, p = .6, R2 = .009; PT, F(1, 25) = 0.2, p = .6, R2 = .01; EC, F(1, 25) = 0.8, p = .4, R2 = .03; PD, F(1, 25) = 0.02, p = .8, R2 = .001; emotion recognition score, F(1, 25) = 3.5,
5
p = .07, R2 = .1; total “faux pas” score, F(1, 25) = 0.3, p = .6, R2 = .01; second-order Yoni cognitive score, F(1, 25) = 1, p = .3, R2 = .04; secondorder Yoni emotional score, F(1, 25) = 3, p = .09, R2 = .1]. Individual analyses were computed using normative data for each task. The characteristics of the HC population used to obtain these normative data (n = 100, unpublished data, Narme, 2011) were as follows: 25 males and 75 females; mean age: 62 ± 1 years; mean number of years in fulltime education: 12.4 ± 0.3; mean MMSE score: 28.2 ± 0.2; mean DRS score: 140.3 ± 0.3; mean MADRS depression score: 3.4 ± 0.4. Cut-off scores were determined in HC using a previously validated methodology (Godefroy et al., 2010). Scores (or transformed score when deviation from normal distribution was evidenced) were submitted to a regression analysis with age, education, and gender as independent variables. Performance on all experimental tasks was affected by age and education but not by gender except for the empathic concern IRI subscale, F(1, 99) = 5, p = .02, R2 = .05 [fantasy: F(1, 99) = 0.04, p = .9, R2 < .001; perspective taking: F(1, 99) = 2.5, p = .1, R2 = .03; personal distress: F(1, 99) = 0.6, p = .5, R2 = .05; emotion recognition: F(1, 99) = 1.8, p = .3, R2 = .01; total “faux pas” score: F(1, 99) = 0.02, p = .9, R2 < .001; Yoni cognitive ToM 2nd order: F(1, 99) = 0.06, p = .8, R2 = .001; Yoni affective ToM 2nd order: F(1, 99) = 0.6, p = .5, R2 = .006]. Significant factors were retained and used to compute residuals (Narme, 2011). The cut-off scores were 5th percentile, and residuals < 5th percentile were considered as impaired. The frequencies of impairment in each group were compared in a Fisher exact test. A Socioemotional Index was computed by adding together the number of impairments observed for total emotion recognition, secondorder Yoni ToM (a combined score for cognitive and affective items), and the total “faux pas” scores. Hence, for a given patient, the Socioemotional Index could be 0 (unimpaired), 1, 2, or 3 (most impaired). The IRI scores were not included in the Socioemotional Index because the validity of the IRI depends on having a reliable caregiver; we therefore sought to remove potential sources of subjective bias. On the basis of our normative data, participants with more than one impaired test (Socioemotional Index >1) were considered to have impaired socioemotional processes. To determine whether this index would facilitate the differential diagnosis between FTLD and AD, a receiver operating characteristic (ROC) curve was plotted, and the area under the curve (AUC) and the 95% confidence interval (CI) were computed. Lastly,
6
NARME ET AL.
correlations between the Socioemotional Index, clinical features, and behavioral impairments were analyzed in a Pearson test. All analyses were performed using SPSS software (SPSS Inc., Chicago, IL, USA). The threshold for statistical significance was set to p < .05.
RESULTS
Downloaded by [Bibliothèque de l' Université Paris Descartes] at 14:59 12 August 2013
The Interpersonal Reactivity Index An ANOVA with repeated measures was performed on the current level of empathy, with group (FTLD, AD, HC) as a between-group factor and subscale (FS, PT, EC, PD) as a within-subjects factor. It showed an effect of group, F(2, 45) = 24.4, MSE = 816, p = .001, ηp 2 = .52, due to lower empathy scores in FTLD (8.9 ± 0.8) than in HCs (15.7 ± 0.6, p = .001, Cohen’s d = 1.3) and lower empathy scores in AD than in HCs (11.5 ± 0.9, p = .001, Cohen’s d = 0.9), whereas the difference between FTLD and AD patients was not significant (p = .1, Cohen’s d = 0.5). The effect of subscale, F(3, 135) = 11.5, MSE = 247, p = .001, ηp 2 = .2, was due to lower scores for FS (10.9 ± 6.7) than for PD (12.2 ± 5.2, p = .03, Cohen’s d = 0.6) and for EC (16.5 ± 6.2, p = .001, Cohen’s d = 1.1), and to higher scores for EC than for PT (13 ± 6.5, p = .001, Cohen’s d = 0.6). The Group × Subscale interaction was significant, F(6, 135) = 9.2, MSE = 198,
p = .001, ηp 2 = .29, due to intergroup differences for FS, F(2, 45) = 11.7, MSE = 367, p = .001, PT, F(2, 45) = 30, MSE = 563, p = .001, and EC, F(2, 45) = 20.7, MSE = 434, p = .001, but not PD, F(2, 45) = 1.7, MSE = 44, p = .2; Table 2). Post hoc analyses showed that (a) FTLD patients had lower empathy than HCs did for all subscales (FS: p = .001, Cohen’s d = 1.7; PT: p = .001, Cohen’s d = 2.4; EC: p = .001, Cohen’s d = 1.9) other than PD (p = .9, Cohen’s d = 0.4); (b) FTLD patients had a worse EC score than AD patients did (p = .01, Cohen’s d = 1.1; FS: p = .1, Cohen’s d = 0.2; PT: p = .4, Cohen’s d = 0.5; PD: p = 1, Cohen’s d = 0.2), and (c) AD patients differed from the HCs in terms of FS (p = .003, Cohen’s d = 1.3), PT (p = .001, Cohen’s d = 1.9), and EC subscales (p = .003, Cohen’s d = 1.3). Significant intergroup differences were checked using an ANCOVA, with age and gender as covariates. Both of these covariates were significant [age: F(1, 43) = 12, MSE = 311, p = .001, ηp 2 = .23; gender: F(1, 43) = 7.7, MSE = 191, p = .008, ηp 2 = .15]. The effect of group remained significant, F(2, 43) = 22.7, MSE = 565, p = .001, ηp 2 = .51). Although the effect of subscale was not significant, F(3, 129) = 0.1, MSE = 3, p = .9, ηp 2 = .003), the Group × Subscale interaction persisted, F(6, 129) = 6, MSE = 139, p = .001, ηp 2 = .23. Intergroup differences were consistent with results obtained with ANOVAs, such as post hoc analyses, except that after controlling age and gender covariates AD patients only differed significantly from the
TABLE 2 Empathy level and performance in emotion recognition and “faux pas” tasks FTLD (n = 13)
AD (n = 13)
HCs (n = 26)
p
Effect size
Current IRI score Fantasy Perspective taking Empathic concern Personal distress
6.1 ± 2.7a 7.3 ± 4.7a 10.6 ± 6.5a, b 13.6 ± 5.2
7.1 ± 3.9a 9.3 ± 4.5a 15.5 ± 3.4a 14.2 ± 4.1
14.5 ± 6.9 17.4 ± 4 19.9 ± 3.5 11 ± 5.5
.001 .001 .001 .1
0.34 0.57 0.48 0.07
Emotion recognition Happiness Fear Anger Disgust Neutral Sadness
9.5 ± 0.9 3.9 ± 2.7a, b 4.8 ± 1.9a 5.2 ± 3.2a, b 5.3 ± 3.9a, b 5.5 ± 2.1a, b
9.5 ± 1.2 6.2 ± 2.4a 5.7 ± 2.9 8.4 ± 2.1 7.7 ± 1.8 7.9 ± 1.1
9.8 ± 0.5 8.8 ± 1.7 7.7 ± 2.6 9 ± 1.1 9 ± 0.8 7.3 ± 2.4
.3 .001 .003 .001 .001 .01
0.05 0.48 0.21 0.38 0.34 0.17
“Faux pas” test Total score Cognitive ToM Affective ToM Comprehension
40.3 ± 21.1a, b 37.5 ± 28.3a 46.7 ± 27.7a, b 87.9 ± 12a
65.5 ± 8.8 54.5 ± 22.5a 75.5 ± 15.7 94.5 ± 4.3
77.1 ± 13.7 75.4 ± 18 80 ± 15.7 96.7 ± 2.6
.001 .001 .001 .001
0.52 0.36 0.35 0.25
Task
Notes. Mean ± standard deviation. FTLD = frontotemporal lobar degeneration; AD = Alzheimer’s disease; HC = healthy controls; IRI = Interpersonal Reactivity Index. ToM = theory of mind. a Significant difference versus HCs. b Significant difference between the FTLD and AD groups. For effect sizes, partial eta-squared are reported.
Downloaded by [Bibliothèque de l' Université Paris Descartes] at 14:59 12 August 2013
SOCIOEMOTIONAL PROCESSES IN DEMENTIA
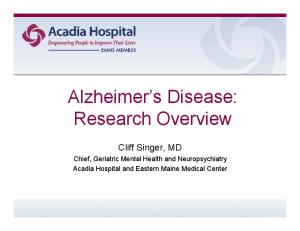
HCs in terms of PT (p = .003, Cohen’s d = 1.4; FS: p = .06, but a large effect size Cohen’s d = 1; EC: p = .9, Cohen’s d = 0.4; PD: p = .2, but with a large effect size Cohen’s d = 0.8). To explore changes in empathy changes over time, we computed a change index by subtracting the caregiver-estimated premorbid score from the current score (i.e., a negative index reflects a decrease in empathy). An ANOVA with repeated measures was performed, with group (FTLD, AD) as a between-group factor and subscale (FS, PT, EC, PD) as a within-subjects factor. The effect of group, F(1, 20) = 4.6, MSE = 121, p = .04, ηp 2 = .19, was due to a greater decrease in empathy in FTLD (–3.3 ± 0.7) than in AD (–1 ± 0.8). The effect of subscale was significant, F(3, 60) = 8.3, MSE = 217, p = .001, ηp 2 = .3, with a larger change in empathy for both PT (–5.2 ± 1.1, p = .01, Cohen’s d = 1.3) and EC (–3.9 ± 1.2, p = .05, Cohen’s d = 1) than for PD (2.1 ± 1.2). The Group × Subscale interaction was also significant, F(3, 60) = 5.8, p = .006, ηp 2 = .49. Further one-way ANOVAs revealed that the decrease in the EC subscale score was greater in FTLD (–7.3 ± 7.1) than in AD (–0.4 ± 2.2) [F(1, 20) = 8.8, MSE = 262, p = .008, ηp 2 = .31; FS: F(1, 20) = 0.09, MSE = 1.4, p = .7, ηp 2 = .005; PT: F(1, 20) = 1.5, MSE = 39.7, p = .2, ηp 2 = .07; PD: F(1, 20) = 0.03, MSE = 1, p = .8, ηp 2 = .002] (Figure 1). Significant intergroup differences were checked using an ANCOVA, with age and gender as covariates. However, both these covariates were not significant [age: F(1, 18) = 0.01, MSE = 0.3, p = .9, ηp 2 = .001; gender: F(1, 18) = 0.9, MSE = 26, p = .3, ηp 2 = .05]. In summary, empathy was lower in FTLD patients for all subscales other than personal distress. Although empathy was also modified in
Figure 1. Empathy changes since disease onset, as assessed by caregivers. FTLD = frontotemporal lobar degeneration; AD = Alzheimer’s disease. ∗ p < .05.
AD patients for those three for perspective taking, the cated that empathy is more in FTLD and suggested that concern may be used to from AD.
7
subscales, especially change index indimarkedly decreased changes in empathic distinguish FTLD
Facial emotion recognition In view of the observed ceiling effect, Kruskal– Wallis tests were used to compare the groups’ respective performance levels (FLTD, AD, HC) in control tasks. No intergroup difference was found [face gender decision: χ 2 (2) = 4.3, p = .1; semantic questionnaire: χ 2 (2) = 3.9, p = .1]. An ANOVA with repeated measures was performed, with emotion (happiness, fear, anger, disgust, neutral, sadness) as within-subjects factor and group (FTLD, AD, HC) as between-group factor. The main effect of group, F(2, 49) = 37.1, MSE = 220, p = .001, ηp 2 = .6, was significant, and post hoc tests revealed lower performance in FTLD (5.9 ± 0.3) than in HCs (8.4 ± 0.2, p = .001; Cohen’s d = 1.5) and AD (7.7 ± 0.3, p = .001; Cohen’s d = 0.7) and lower performance in AD than in HCs (p = .01; Cohen’s d = 0.6). The effect of emotion, F(5, 245) = 19.6, MSE = 75, p = .001, ηp 2 = .29, was due to higher scores for happiness (9.6 ± 0.8) than for other emotions (fear: 6.9 ± 2.9, p = .001, Cohen’s d = 1.7; anger: 6.4 ± 2.8, p = .001, Cohen’s d = 1.9; disgust: 7.9 ± 2.6, p = .001, Cohen’s d = 1.6; neutral: 7.8 ± 2.6, p = .001, Cohen’s d = 1.3; sadness: 6.9 ± 2.2, p = .001, Cohen’s d = 1.8) and higher scores for disgust than for fear (p = .01, Cohen’s d = 0.55) and anger (p = .03, Cohen’s d = 0.56). The Group × Emotion interaction was also significant, F(10, 245) = 3.9, MSE = 14.9, p = .001, ηp 2 = .14. Further one-way ANOVAs revealed a significant effect of group for all emotions [fear: F(2, 49) = 23, MSE = 109, p = .001; anger: F(2, 49) = 6.4, MSE = 40.9, p = .003; disgust: F(2, 49) = 15, MSE = 64, p = .001; neutral: F(2, 49) = 12.4, MSE = 59, p = .001; sadness: F(2, 49) = 4.9, MSE = 21, p = .01] (Table 2) other than happiness, F(2, 49) = 1.2, MSE = 0.8, p = .3. Post hoc tests showed lower scores in FTLD than in (a) HCs for all emotions (fear: p = .001, Cohen’s d = 2.2; anger: p = .005; Cohen’s d = 1.3; disgust: p = .001; Cohen’s d = 1.7; neutral: p = .001; Cohen’s d = 1.6; sadness: p = .04; Cohen’s d = 0.8, and (b) AD for all emotions other than anger (fear: p = .02; Cohen’s d = 0.9; disgust: p = .001; Cohen’s d = 1.2; neutral: p = .02; Cohen’s d = 0.8; sadness: p = .02; Cohen’s d = 1.5; anger: p = 1, Cohen’s d = 0.3). Although the AD patients did not differ significantly from the HCs other than for fear (fear:
Downloaded by [Bibliothèque de l' Université Paris Descartes] at 14:59 12 August 2013
8
NARME ET AL.
p = .004, Cohen’s d = 1.2), effect sizes were medium and large for angry and neutral expressions (anger: p = .08; Cohen’s d = 0.7; neutral: p = .2, Cohen’s d = 0.9; disgust: p = 1; Cohen’s d = 0.4; sadness: p = 1, Cohen’s d = 0.3). Significant intergroup differences were checked using an ANCOVA, with age and gender as covariates. Only gender was significant: gender: F(1, 47) = 7.4, MSE = 39, p = .009, ηp 2 = .14; age: F(1, 47) = 0.4, MSE = 2, p = .5, ηp 2 = .009. The effect of group remained significant, F(2, 47) = 25, MSE = 135, p = .001, ηp 2 = .52. Although the effect of emotion was not significant, F(5, 235) = 1.5, MSE = 6, p = .2, ηp 2 = .03, the Group × Emotion interaction persisted, F(10, 235) = 2.3, MSE = 9, p = .01, ηp 2 = .1. Intergroup differences were consistent with results obtained with ANOVAs, such as post hoc analyses. Overall, emotion recognition was found to be impaired in FTLD for all emotions other than happiness. In contrast, emotion recognition appeared to be relatively unaffected in AD (with the exception of fear).
Theory of mind The “faux pas” test A repeated measures ANOVA was conducted with group (FTLD, AD, HC) as a betweengroup factor and score (total, comprehension) as a within-subjects factor. A group effect was found, F(2, 46) = 25.4, MSE = 4279, p = .001, ηp 2 = .52, due to lower scores in FTLD (64 ± 16) than in HCs (87 ± 8, p = .001, Cohen’s d = 1.8) and AD (80 ± 6.5, p = .001), whereas AD and HC groups did not differ significantly (p = .1, but with a large effect size, Cohen’s d = 0.9). The effect of score was significant, F(1, 46) = 219, MSE = 21,820, p = .001, ηp 2 = .83, due to a lower total score (66 ± 21) than comprehension score (94 ± 7). The Group × Score interaction was significant, F(2, 46) = 16.2, MSE = 1613, p = .001, ηp 2 = .41. Further oneway ANOVAs revealed a group effect, F(2, 46) = 24.7, MSE = 5571, p = .001; Table 2) due to a lower total score in FTLD than in HCs (p = .001, Cohen’s d = 2.1) and AD (p = .001, Cohen’s d = 1.7), whereas the AD and HC groups did not differ significantly (p = .1, but with a large effect size, Cohen’s d = 1). A group effect was found for comprehension score, F(2, 46) = 7.6, MSE = 320, p = .001, due to a lower total score in FTLD than in HCs (p = .001, Cohen’s d = 1.2) and a trend for AD (p = .055, Cohen’s d = 0.8), whereas the AD and HCs groups did not differ significantly (p > .9, Cohen’s d = 0.6). Significant intergroup differences
were checked using an ANCOVA, with age and gender as covariates. However, both these covariates were not significant [age: F(1, 44) = 2, MSE = 390, p = .1, ηp 2 = .05; gender: F(1, 44) = 0.2, MSE = 43, p = .6, ηp 2 = .006]. To establish whether performance for questions that concerned cognitive and affective inferences was altered, further analyses were specifically conducted on cognitive and affective ToM scores. Since a difference in the comprehension score was found suggesting that the impairment in FTLD might be nonspecific (e.g., due to language difficulties), we performed a repeated measures ANOVA with group (FTLD, AD, HC) as a between-group factor and condition (cognitive ToM, affective ToM, comprehension) as a within-subjects factor. It showed a significant group effect, F(2, 46) = 18, MSE = 8772, p = .001, ηp 2 = .4, due to lower performance in FTLD (57 ± 23) than in HCs (84 ± 17, p = .001, Cohen’s d = 1.5) and in AD (84 ± 12, p = .006, Cohen’s d = 0.9), whereas AD did not differ significantly from HCs (p = .1, but with a medium effect size Cohen’s d = 0.6). The significant effect of condition, F(2, 92) = 74, MSE = 15,385, p = .001, ηp 2 = .62, was due to lower cognitive ToM scores (61 ± 27) than affective ToM (71 ± 24, p = .003, Cohen’s d = 0.4) and comprehension scores (94 ± 7, p = .001, Cohen’s d = 2.2) and to higher scores for comprehension than affective ToM scores (p = .001, Cohen’s d = 1.8). The Group × Condition was also significant, F(4, 92) = 6, MSE = 1245, p = .001, ηp 2 = .2. Further oneway ANOVAs performed on the cognitive ToM and the affective ToM scores showed a group effect on cognitive ToM, F(2, 46) = 12.9, MSE = 6228, p = .001, due to lower scores in FTLD than in HCs (p = .001; Cohen’s d = 1.6) and in AD than in HCs (p = .03, Cohen’s d = 1; Table 2), whereas FTLD and AD did not differ significantly (p = .2, but with a medium effect size Cohen’s d = 0.6). A group effect on affective ToM was also found, F(2, 46) = 12.5, MSE = 4714, p = .001, due to lower scores in FTLD than in HCs (p = .001, Cohen’s d = 1.5) and AD (p = .003, Cohen’s d = 1.3) and no significant difference between AD and HC groups (p = 1, Cohen’s d = 0.3). Significant intergroup differences were checked using an ANCOVA, with age and gender as covariates. However, both these covariates were not significant [age: F(1, 44) = 3, MSE = 1264, p = .1, ηp 2 = .06; gender: F(1, 44) = 1, MSE = 502, p = .3, ηp 2 = .02]. To establish whether or not comprehension impairments in SD patients could have pulled the FTLD groups’ scores down, we looked at the individual performance of each patient as a function of the FTD variant. In particular, we calculated z
Downloaded by [Bibliothèque de l' Université Paris Descartes] at 14:59 12 August 2013
SOCIOEMOTIONAL PROCESSES IN DEMENTIA
scores in order to determine whether patients were outside the control group’s range for the comprehension score. The comprehension score was more than two standard deviations below the HC’s mean score for three FTD patients and one SD patient. We decided to reanalyze the results after removal of these four patients, to ensure that the effects for the ToM measures remained (only means and comparisons involving the FTLD group are reported; see Table 2 for the other groups’ means). The repeated measures ANOVA with group (FTLD, AD, HC) as a between-group factor and score (total, comprehension) as a within-subjects factor revealed a group effect, F(2, 42) = 29.7, MSE = 3799, p = .001, ηp 2 = .59, due to a lower score in FTLD (62 ± 15) than in HCs (p = .001, Cohen’s d = 2.2) and AD (p = .001, Cohen’s d = 1.7). The effect of score was significant, F(1, 42) = 228, MSE = 18,789, p = .001, ηp 2 = .84, due to a lower total score (67 ± 19.5) than comprehension score (94.4 ± 7.3). The Group × Score interaction was significant, F(2, 42) = 16, MSE = 1340, p = .001, ηp 2 = .44. Further one-way ANOVAs revealed a group effect, F(2, 42) = 28.5, MSE = 4823, p = .001, ηp 2 = .57, due to a lower total score in FTLD (37.5 ± 15.3) than in HCs (p = .001, Cohen’s d = 2.7) and AD (p = .001, Cohen’s d = 2.3). A group effect was found for comprehension score, F(2, 42) = 7.7, MSE = 316, p = .001, ηp 2 = .27, due to a lower score in FTLD (86.5 ± 14) than in HCs (p = .002, Cohen’s d = 1.2) and AD (p = .03, Cohen’s d = 0.9). The repeated measures ANOVA with group (FTLD, AD, HC) as a between-group factor and condition (cognitive ToM, affective ToM, comprehension) as a withinsubjects factor showed a significant group effect, F(2, 42) = 24, MSE = 8415, p = .001, ηp 2 = .53, due to lower score in FTLD (54 ± 19) than HCs (p = .001, Cohen’s d = 1.9) and AD (p = .001, Cohen’s d = 1.3). The significant effect of condition, F(2, 84) = 72, MSE = 13,567, p = .001, ηp 2 = .63, was due to lower cognitive ToM scores (63 ± 25.8) than affective ToM (72 ± 21.6, p = .01, Cohen’s d = 0.46) and comprehension scores (94.4 ± 7, p = .001, Cohen’s d = 2.3) and to higher scores for comprehension than affective ToM scores (p = .001, Cohen’s d = 1.9). The Group × Condition was also significant, F(4, 84) = 6, MSE = 1195, p = .001, ηp 2 = .23. Further one-way ANOVAs performed on the cognitive ToM and the affective ToM scores confirmed the previous results with a group effect on cognitive ToM, F(2, 42) = 13.8, MSE = 5809, p = .001, ηp 2 = .4, due to lower scores in FTLD (33.8 ± 25) than in HCs (p = .001; Cohen’s d = 1.9; AD: p = .1, but with a large effect size Cohen’s d = 0.9), and a group effect on affective ToM, F(2, 42) = 17.6, MSE = 4680, p = .001, ηp 2 = .46, due
9
to lower scores in FTLD (41 ± 18) than in HCs (p = .001, Cohen’s d = 2.3) and AD (p = .001, Cohen’s d = 2.2). In summary, the ability to detect violations of social norms and infer cognitive and affective mental states was impaired in FTLD, whereas AD patients were relatively unaffected in this respect (other than for cognitive ToM). Although the FTLD performance was relatively poor on the comprehension task, interactions with group were significant, and the impairment in FTLD persisted after exclusion of patients outside the control range for the comprehension score. These findings suggest that the above-mentioned intergroup differences reflected ToM impairments and not exclusively impairments in comprehension. The Yoni task In view of the ceiling effect observed for the firstorder Yoni tasks, a Kruskal–Wallis test was used to compare the groups’ respective performances (FLTD, AD, HC) for each condition (cognitive, affective, physical). No intergroup difference was found [χ 2 (2) = 2.41, p = .3; χ 2 (2) = 0.33, p = .8; χ 2 (2) = 3.5, p = .2, respectively]. An ANOVA with repeated measures on the second-order Yoni tasks was performed with group (FTLD, AD, HC) as a between-group factor and condition (cognitive, affective, physical) as a within-subjects factor. The group effect, F(2, 49) = 5, MSE = 2895, p = .01, ηp 2 = .17, was due to worse performance in FTLD (68 ± 25) than in HCs (81 ± 15.5, p = .02, Cohen’s d = 0.65). Although performance in AD (70.5 ± 16) and in HCs did not differ significantly (p = .08), the effect size was medium (Cohen’s d = 0.7). The effect of condition, F(2, 98) = 8.8, MSE = 1991, p = .001, ηp 2 = .15, was due to lower performance in cognitive ToM (69.6 ± 19.8) than in physical condition (83.3 ± 21.1, p = .001, Cohen’s d = 0.6) and lower performance in affective ToM (73.2 ± 17.6) than in physical condition (p = .005, Cohen’s d = 0.5). The Group × Condition interaction was also significant, F(4, 98) = 2.6, MSE = 588, p = .04, ηp 2 = .1. One-way ANOVAs were then performed on each condition separately, with group (FTLD, AD, HC) as a between-group factor. It showed that the groups differed significantly in terms of affective ToM, F(2, 49) = 5.6, MSE = 1485, p = .006, ηp 2 = .19, and physical items, F(2, 49) = 6.3, MSE = 2307, p = .004, ηp 2 = .2, but not for cognitive ToM, F(2, 49) = 0.7, MSE = 279, p = .5, ηp 2 = .03. Post hoc tests showed that both patient groups were impaired in affective ToM relative to HCs (FTLD: p = .05, Cohen’s d = 0.6; AD: p = .01, Cohen’s d = 1.2; Figure 2) and
Downloaded by [Bibliothèque de l' Université Paris Descartes] at 14:59 12 August 2013
10
NARME ET AL.
Figure 2. Theory of mind performance in the second-order Yoni task. FTLD = frontotemporal lobar degeneration; AD = Alzheimer’s disease; HC = healthy controls; ToM = theory of mind. ∗ p < .05; ∗∗ p < .01.
that FTLD patients performed less well for physical items than HCs did (p = .003, Cohen’s d = 1), whereas AD patients were not impaired (p = .7, Cohen’s d = 0.5). Significant intergroup differences were checked using an ANCOVA, with age and gender as covariates. Only age was significant [gender: F(1, 47) = 0.2, MSE = 108, p = .6, ηp 2 = .004; age: F(1, 47) = 5, MSE = 2856, p = .03, ηp 2 = .1]. The effect of group remained significant, F(2, 47) = 4.7, MSE = 2571, p = .01, ηp 2 = .17. Although the effect of condition was not significant, F(2, 94) = 0.4, MSE = 93, p = .6, ηp 2 = .009, the Group × Condition interaction persisted, F(4, 94) = 2.6, MSE = 535, p = .04, ηp 2 = .1. Intergroup differences were consistent with results obtained with ANOVAs, such as post hoc analyses. Overall, affective ToM appeared to be impaired in both patient groups. Nevertheless, FTLD patients were also impaired in the physical condition, meaning that it is not possible to reliably infer that these problems were related to ToM processes rather than nonsocioemotional processes. As with the faux pas test, we looked at the patients’ individual performances as a function of FTLD; this enabled us to rule out the possibility that poor performance for the control items reflected the inclusion of SD patients and their potential misunderstanding of the verbal content. All three of the patients with impairments in the physical condition met the criteria for FTD; this finding suggests that the SD patients did not pull the FTLD group’s scores down due to impairments in verbal comprehension. One can hypothesize that FTD patients had more difficulties in the physical conditions in which Yoni’s gaze was directed straight ahead or towards a false response (incongruent condition) because these items required inhibition of the automatic response to the direction of eye gaze. Given
that inhibition impairments are commonly reported in FTD, the latter patients may produce impulsivity errors by following Yoni’s eye gaze and failing to take account of verbal cues. Consistently, the FTLD patients’ performance in the physical condition was correlated with the Stroop inhibition index (i.e., errors in the interference subtest minus errors in the naming subtest; r = –.69, p = .009). We therefore performed an ANOVA with repeated measures on the second-order Yoni tasks with group (FTLD, AD, HC) as a between-group factor and condition (cognitive, affective, true physical) as a within-subjects factor. The group effect, F(2, 49) = 4, MSE = 2430, p = .02, ηp 2 = .14, was due to worse performance in FTLD than in HCs (p = .03, Cohen’s d = 0.6), whereas AD did not significantly differ from HCs (p = 2, Cohen’s d = 0.45). The effect of condition, F(2, 98) = 6, MSE = 1990, p = .003, ηp 2 = .11, was due to lower performance in cognitive ToM and affective ToM than in true physical condition (cognitive ToM: p = .009, Cohen’s d = 0.5; affective ToM: p = .05, Cohen’s d = 0.5). The Group × Condition interaction was also significant, F(4, 98) = 2.5, MSE = 783, p = .05, ηp 2 = .1. One-way ANOVA with group (FTLD, AD, HC) as a between-group factor, by considering items of the congruent condition (a “true physical condition”) but not those promoting impulsivity errors (incongruent condition) as a within-subjects factor showed that the group effect persisted, F(2, 49) = 3, MSE = 1731, p = .05, ηp 2 = .1 (see Figure 2), due to a trend of lower performance in FTLD than in HCs (p = .07, with a meaningful effect size Cohen’s d = 0.8). In summary, the ability to infer affective mental states appeared to be impaired in FTLD and in AD patients. However, in contrast to AD patients, FTLD performance was relatively poor on the physical condition. The FTLD performance in this condition may be due to impairment of inhibition (as suggested by the correlation with the Stroop inhibition index). However, although interaction between group and condition was significant, the FTLD performance remained lower—albeit not significantly—than HCs when considering the true physical condition (after the exclusion of control items promoting impulsivity errors).
Individual analyses The frequencies of impairment differed from one group to another (Table 3) for (a) the total current IRI score, χ 2 (2, N = 46) = 20.2, p = .001, which was more frequently impaired in FTLD than in HCs (p = .001, Cramer’s V = 0.71) and more
Downloaded by [Bibliothèque de l' Université Paris Descartes] at 14:59 12 August 2013
SOCIOEMOTIONAL PROCESSES IN DEMENTIA
frequently impaired in AD than in HCs (p = .001, Cramer’s V = 0.55); (b) the emotion recognition score, χ 2 (2, N = 52) = 24.5, p = .001, which was more frequently impaired in FTLD than in the two other groups (HC: p = .001, Cramer’s V = 0.77; AD: p = .02, Cramer’s V = 0.47) and more frequently impaired in AD than in HCs (p = .03, Cramer’s V = 0.38) although the significant effect disappeared when the fear recognition score was excluded (p = .1, Cramer’s V = 0.3); (c) the Yoni ToM second-order score, χ 2 (2, N = 52) = 6.2, p = .04, although none of the post hoc tests were significant (FTLD versus HCs: p = .1, Cramer’s V = 0.33); and (d) the total “faux pas” score, χ 2 (2, N = 49) = 22.9, p = .001, which was more frequently impaired in FTLD than in the two other groups (HC: p = .001, Cramer’s V = 0.69; AD: p = .001, Cramer’s V = 0.7). The Socioemotional Index (the number of tests showing impairment, ranging from 0 to 3) differed significantly from one group to another, χ 2 (2, N = 52) = 31.9, p = .001, due to more frequent impairment in FTLD (9 of the 13 patients, 69%) than in the two other groups (HC: p = .001, Cramer’s V = 0.78; AD: p = .001, Cramer’s V = 0.73). To determine the battery’s sensitivity and specificity for the diagnosis of FTLD, a ROC curve was computed for the FTLD and AD groups’ Socioemotional Index, cognitive dysexecutive syndrome, and behavioral dysexecutive syndrome. We also included disinterest as a behavioral change, which was more frequent in FTLD than in AD (Table 1). The ROC curve results showed that the AUC was .94 (95% CI [.86, 1], p = .001) for the Socioemotional Index, .79 (95% CI [.6, .98], p = .02) for disinterest, .67 (95% CI [.44, .89], p > .2) for the behavioral dysexecutive syndrome, and .55 (95% CI [.31, .77], p > .7) for the cognitive dysexecutive syndrome (Figure 3a). A Socioemotional Index >1 (i.e., impairment in more than one test) had good sensitivity and specificity for the diagnosis of FTLD (69% and 100%, respectively). Thus, measuring the impairment of socioemotional processes can discriminate between FTLD and AD.
11
Changes in empathy (Figure 1) were also found to be of value for discriminating between FTLD and AD. We computed a second ROC curve for the Socioemotional Index and the empathy change index (i.e., by subtracting the caregiver-estimated premorbid score from the current score), which were available for 20 patients (FTLD: n = 10; AD: n = 10). To make the empathic concern curve easier to read, positive values were converted into negative values and vice versa (Figure 3b). The results showed that the AUC was .96 (95% CI [.9, 1], p = .001) for the Socioemotional Index and .85 (95% CI [.7, 1], p = .006) for the empathic concern change index. In this case (with n = 20), the sensitivity and specificity for diagnosis of FTLD were, respectively, 70% and 100% when the Socioemotional Index >1. The sensitivity and specificity values obtained for an empathic concern change