AJCS 5(10):1286-1291 (2011)
ISSN:1835-2707
Assessment of genetic diversity among some Iranian hazelnut genotypes using SSR markers Erfatpour M.1*, Hamidogli Y.2, Kaviani B.3, Fatahi R.4, Falahati M.5, Javadi D.6 and Hashemabadi D.3 1
Department of Horticultural Science, Science and Research Branch, Islamic Azad University, Tehran, Iran Department of Horticultural Science, Faculty of Agriculture, Guilan University, Rasht, Iran 3 Department of Horticultural Science, Rasht Branch, Islamic Azad University, Rasht, Iran 4 Department of Horticultural Science, Faculty of Agriculture, Tehran University, Tehran, Iran 5 Department of Plant Breeding, Shomal Biotechnology Institue, Rasht, Iran 6 Department of Horticultural Science, Astara Hazelnut Research Center, Astara, Iran 2
*Corresponding author:
[email protected] Abstract Studying genetic diversity is a preliminary step for conservation and utilization of germplasm. Talesh hills, located in Guilan province in northern part of Iran, are one of the main areas for natural distribution of hazelnut (Corylus avellana L.). Hazelnut trees in Talesh Mountains are a wild population (land race) and obtained from open-pollinated seedling. In this research, a population including 90 hazelnut samples was studied using 15 microsatellite markers. Totally, 98 polymorphic alleles were detected with an average of 6.53 alleles per locus. The lowest numbers of 3 alleles were observed in CaC-B005 and CaC-C114 and the highest number of 12 alleles in CaC-C101 locus. The average effective number of alleles (3.75), mean expected heterozygosity of (He=0.70) and average observed heterozygosity of (Ho=0.62) were estimated for studied loci. All loci showed high PIC with an average of 0.72 that the highest amount detected in CaC-B011 and CaC-B101 loci with values of 0.85 and 0.84, respectively. A dendrogram was generated by UPGMA clustering method that placed the 90 accessions into 7 main loose groups. According to the results a high genetic diversity was found in the studied population that mainly related to the hazelnut pollination nature that shows sporophytic incompatibility system enhancing out-crossing in natural populations. Keywords: Corylus avellana L., Diversity index, Filbert, Molecular markers. Abbreviations: AFLP_Amplified Fragment Length Polymorphism; He_Expected heterozygosity; Ho_Observed heterozygosity; PCR_Polymerase Chain Reaction; PIC_Polymorphic Information Content; RAPD_Random Amplified Polymorphic DNA; SSRs_Simple Sequence Repeats or microsatellite. Introduction Exploration of the genetic resources would be a great interest for further uses in plant improvement programs. As the next step, plant conservation is urgently needed as they are going to extinct and many others are threatened and endangered. It is undeniable that a disastrous loss of plant genetic diversity is occurring and many species, genes and alleles are being lost and seems to become even worse in future. Also, modern agriculture needs high yield cultivars for profitability, and consequently the number of cultivars being planted has decreased in recent years. Therefore, to avoid losses in local germplasm, efforts need to make on worldwide scale to explore, collect and preserve genetic diversity mainly for those propagate vegetative such as fruit trees. The European hazelnut (Corylus avellana L.) is a member of Betulaceae family considers among the major nut crops in the world that has fifth rank in point of production behind cashew, almond, Persian walnut and chestnut. Turkey with 71%, Italy with over 13%, the United States with 4.1% and Spain with 2.8% are the main producer and exporter countries for hazelnut in the world. Iran, China, Georgia, France, Poland, and Greece are other important producers (FAOSTAT, 2008). The natural geographical distribution of the hazelnut (C. avellana) covers many areas in Europe, Africa, Russia, Caucasus Mountains including Talesh (Iran) and eastern parts of Asia
(Thompson et al., 1996). Morphological data have traditionally been used for hazelnut cultivar evaluation (Thompson et al., 1978; UPOV, 1979). Their weak points for plant genotyping are their influences by environmental conditions. Molecular markers along with morphological traits are recommended to assess genetic relationship among hazelnuts (Ahmad et al., 1987; Chen, 1992; Rovira, 1997; Solar et al., 1997; Radicati et al., 1997; Galderisi et al., 1999; Ghanbari et al., 2005; Boccacci et al., 2006; Gökirmak et al., 2008). In fruit trees, considering their long-term generations, study on genetic diversity may help to select proper genetically different parents lead to make a segregation population to find and select superior individuals. The use of random amplified polymorphic DNA (RAPD) in hazelnut included identification of markers linked to eastern filbert blight resistance gene (Davis and Mehlenbacher, 1997; Lunde et al., 2000; Mehlenbacher et al., 2004; Molnar et al., 2007), self-incompatibility (Pomper et al., 1998; Bassil and Azarenko, 2001), genetic characterization (Galderisi et al., 1999), and phylogenetic relation relationship (Miaja et al., 2001). Amplified fragment length polymorphism (AFLP) markers was also used to investigate close markers linked to eastern filbert blight resistance gene in hazelnut (Chen et al., 2005), and fingerprinting hazelnut cultivars (Ferrari et al.,
1286
2004). Microsatellite or simple sequence repeats (SSRs) markers appear to be the best suited marker for cultivar relatedness identification and measuring diversity index in germplasm of hazelnut. SSRs are highly polymorphic, codominant, even distribution in the genome, highly reproducible and also transferrable across laboratories and sometimes plant genus and families that make them to be the powerful molecular marker in genetic studies. SSRs loci have been used to identify mistakes in nomination of hazelnut accessions (Botta et al., 2005; Gökirmak et al., 2005; Boccacci et al., 2008) and to reveal genetic relatedness among cultivars (Ghanbari et al., 2005; Boccacci et al., 2006; Gökirmak et al., 2008). SSR loci were also mapped in linkage groups that some alleles were linked to EFB resistance gene (Mehlenbacher et al., 2006). Guilan province in the northern part of Iran accounts for 75% of the total hazelnut production. Talesh and Eshkevarat are also among the main areas for hazelnut production in Iran. In Talesh, hazelnut trees have been able to survive for many years along with some other plant species such as Cratagus microphylla, Cratagus pentagyna, Cydonia vulgaris, Malus orientalis, Mespilus germanica, Juglans regia, Purus communis, Prunus spinosa, Acer campestre, Carpinus betulus and Quercus robur. This study covers the characterization of hazelnut genetic diversity by using SSRs molecular markers sampled from Talesh that would be a great of interest, because of representing a source of genetic materials and also as a point of historical and cultural heritage aspects. Results and discussion All 15 SSR primer combinations produced prominent PCR products with different levels of fragment size variation that were scored in native hazelnut germplasm accessions, with exceptions. CaC-B005 failed to amplify in genotypes 4, 35, 36, 40, 41, 42, 55, 66, 73, 82 and 89, CaC-B010 in genotype 60, CAC-B109 in genotype 8 and CaC-B502 in genotypes 4, 18, 23, 49, 57, 59 and 63. Allele number observed at each locus ranged from 3 at CaC-B005 and CaC-C114 to a maximum of 12 at CaC-B101 with an average of 6.53 alleles per locus (Table 1) and altogether, 98 alleles were identified. The average number of alleles per locus was comparable with values reported by others such as Bassil et al. (2005) with 7.25, Boccacci et al. (2006) with 9.43, Boccacci et al. (2008) with 7.1, Ghanbari et al. (2005) with 11.9 and Gökirmak et al. (2008) with 9.81. Levels of polymorphism in our study were 6.53. Except for CaC-B101, all primers indicated certain number of rare alleles. The highest amounts were detected in CaC-B011 and CaC-B113 with 7. CaC-B101 displayed 6 of them. Also CaT-B502 showed 4 and primers CaC-B028, CaC-B209, CaC-B105 and CaC-C008 3 rare alleles, individually. Furthermore, each of primers CaCB109, CaT-B504 and CaT-B507 represented 2. Finally, CaCB005, CaC-C001a and CaC-C114 illustrated the lowest number of rare alleles with 1 (Table 1). The size of amplified microsatellite fragments ranged from 126 bp at CaC-B029 to 296 bp at CaC-B005 (Table 2). Allele’s sizes were determined at 15 SSR loci among 90 genotypes in details (Supplementary data 1). In our study, observed heterozygosity averaged over the 15 loci was 0.62 ranging from a minimum of 0.24 for CaC-B005 to a maximum of 0.80 for CaC-B101 loci (Table 1). These amounts were less than the mean value reported by Bassil et al. (2005) with 0.67, Boccacci et al. (2006) with 0.82, Boccacci et al. (2008) with 0.80 and Gökirmak et al. (2008) with 0.67. The mean of He was 0.70 ranging from 0.50 at CaC-C114 to 0.85 at CaC-
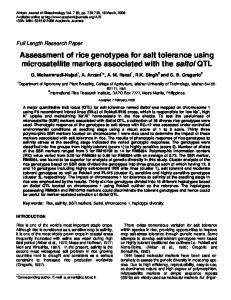
Fig 1. Aerial map of dispersal of Corylus avellana L. in Tondehbin and Makesh regions (red circle) located in Talesh Mountains B011 (Table 1). It's comparable with the results which have been reported in previous studies; Bassil et al. (2005) with 0.68, Boccacci et al. (2006) with 0.78, Boccacci et al. (2008) with 0.70 and Gökirmak et al. (2008) with 0.72. High allele number and heterozygosity among studied accessions indicate the ability of SSR markers to provide genetic diversity of genotypes. The mean value of fixation index (Fin) was 1.94 which showed an excess of heterozygosity among samples. The polymorphism information content (PIC) averaged 0.72 ranging from a minimum of 0.53 for CAC-C114 to a maximum of 0.85 for CAC-B011 (Table 1). Alleles 269 bp of CAC-B028 and 278 bp of CAC-C114 showed the relatively highest frequency, and occurred in 0.63 and 0.6 of genotypes respectively. That is why the PIC of markers CAC-B028 and CAC-C114 were lower than others and dropped dramatically when more cultivars were tested (Table 2). To elucidate genetic relationships among accessions, a dendrogram generated using the program TreeView (Page, 1996). The accessions clustered into 7 main groups, each with subdivision into smaller clusters (Fig. 2). The high level of heterozygosity may be due to consequence of the self-incompatibility of this species. This result indicates that the hazelnut trees in Talesh Mountains are a wild population (land race) and obtained from openpollinated seedling. Surprisingly, this amount was higher than the results which were found in Bassil et al. (2005) and Gökirmak et al. (2008) researches. Genotypes exhibited high genetic diversity in this study. Hazelnut land races, collected over several decades, have become ‘parent’ of the highyielding, pest-resistant and well adapted varieties which resulted in unprecedented increases in hazelnut yields, so this germplasm is highly prized for hazelnut improvement programs. This broad range of genetic diversity existing in Talesh Mountains particularly the primitive and wild gene pool is presently subject to serious genetic erosion and irreversible losses. Hazelnut is indigenous species to Talesh Mountains and has become adapted to this ecological zone, in terms of altitude as well as rainfall and soil conditions. The most crucial ones include displacement of indigenous land races by new, genetically uniform cultivars, changes and development in agriculture or land use, destruction of habitats and ecosystems, and drought. In conclusion, we have generated a database containing the SSR profile of the number of hazelnut genotypes from Talesh Mountains
1287
Fig 2. UPGMA dendrogram of 90 Iranian hazelnut genotypes based on alleles at 15 SSR loci.
germplasm. The information obtained was useful to investigate parentage and genetic relations and will be available for identification of cultivars and synonyms, legal protection, and parentage analysis. The data could be integrated with morphological, phonological, and biometrical data to unambiguously identify genotypes in this germplasm. Further analysis of additional germplasm representing different regions and use more SSRs loci and perhaps other marker system plus morphological traits.
Materials and methods Plant material In this study, 90 local accessions of hazelnut naturally grown in Talesh area (Tandehbin and Makesh regions) (Fig. 1) located in Guilan province in northern part of Iran, were labeled and leaf samples were collected in the spring, and kept under -80°C till DNA extraction. Accessions were selected using GPS and some important morphological differences such as tree height, leaves and fruit shape, length of inflorescence the number of suckers etc, in 400 hectares of
area. Trees were in bearing stage and mostly old with good fruiting habits. Site of sampling had an altitude between 1400 to 1600 m above the sea level. DNA extraction Genomic DNA was extracted from young leaves (approximately 0.1 g) according to Doyle and Doyle method (Doyle and Doyle, 1987) with some modifications, in a 2% CTAB buffer (CTAB 2%, 1.4 M NaCl, 20 mM EDTA, pH: 8.0, 100 mM Tris-HCl, pH: 8.0, 1% PVP 40.000, and 2% βmercaptoethanol), with 2 µL proteinase K (20 mg/mL, Cinnagene, Tehran, Iran). An additional chloroform: isoamylalcohol (24:1) extraction was also performed, and RNA was removed by incubation with 2 µL of 20.3 mg/mL of RNase A for 30 min at 37°C. After purification, total DNA was finally suspended in 100 µL bi-distilled water. PCR amplification and microsatellite allele sizing Fifteen primers pairs related to genomic SSRs extracted from hazelnut genomic library (Bassil et al., 2005, Boccacci et al.,
1288
Table 1. Repeat motifs, primer sequences, annealing temperature (Ta), number of alleles (Na), number of effective alleles (Ne), rare alleles (Ra), polymorphism information content (PIC), expected heterozygosity (He), observed heterozygosity (Ho), and fixation index (Fin), in 90 Corylus avellana L. genotypes CaC-B005
SSR Locus
Motif (GA)22
CaC-B010
(GA)16
CaC-B011
(GA)11
CaC-B028
(AG)16
CaC-B029b
(GA)13
CaC-B101
(AG)14
CaC-B105
(GA)16
CaC-B109
(GA)21
CaC-B113
(GA)14
CaC-C001a
(CACAGAG)3
CaC-C008
(AAG)11
CaC-C114
(TTC)6
CaT-B502
(CT)b
CaT-B504
(CT)18
CaT-B507
c
Mean
(GA)
Primer sequences (5′-3′) FAM-CAAACTTATGATAGGCATGCAA R-TGTCACTTTGGAAGACAAGAGA FAM-AGCTTCCAAATCACACATTACC R-GAAGAGCATCCGTATGATTCAG NED-CACTGGTGATCTCACAGGTTTA R-GTCCTCAAAAGCTAAGCACAAG NED-ATGGACGAGGAATACCCCAGC R-CCTGTTTCTCTTTGTTTTCGAG NED-CAATTTACACCTCAGGGAAGAG R-AAGTTCACCCAAGAAATCCAC HEX-GCAGACCAGAGTCTGTTATTCA R-AGACAATTTCGTGACTGGGTAT HEX-AAAGGAGCAAGCATGTTAGG R-GTTTGTACGGATGATCCACTGAG HEX-AATCCAAGCCTTTTCACTACC R-ACCCATCAAGTTCACCAATC HEX-TTGAGGAAGTCCAGGAAAAT R-GCCAGAGAGAGCAAGAGTTAG FAM-CCCGTAACTAACCAATCACAAT R-TGGAGAAGAGGAGAGCTTAGTG FAM-TTTCCGCAGATAATACAGGG R-TCCTTTGCTTTGGACCAG HEX-TCTCCCTCTCCCTCTCTTCTAC R-GAAAGGAAAAAGCACATAGCAA FAM-CTCATGACTGCCCACCCCTCG R-AGGCATGCAGGCTTCACAC HEX-CGCCATCTCCATTTCCCAAC R-CGGAATGGTTTTCTGCTTCAG FAM-CTAAGCTCACCAAGAGGAAGTTGAT R-GCTTCTGGGTCTCCTGCTCA
Ta (◦C) 58
Na 3
Ne 2.67
Ra 1
PIC 0.63
He 0.63
Ho 0.24
Fin 0.61
58
4
3.51
0
0.73
0.72
0.73
-0.02
62
10
6.63
7
0.85
0.85
0.74
0.12
62
4
2.15
3
0.57
0.53
0.27
0.48
60
8
5.04
3
0.81
0.8
0.74
0.07
58
12
5.61
6
0.84
0.82
0.8
0.02
60
8
4.71
3
0.81
0.79
0.77
0.01
58
8
4.21
2
0.78
0.76
0.80
-0.06
60
10
3.15
7
0.7
0.68
0.78
-0.15
61
4
2.73
1
0.67
0.63
0.47
0.24
56
5
3.33
3
0.71
0.7
0.68
0.01
57.5
3
2
1
0.53
0.5
0.35
0.29
62
7
2.73
4
0.66
0.63
0.39
0.37
58
6
4
2
0.76
0.75
0.76
-0.02
62
6
3.81
2
0.75
0.74
0.76
-0.03
6.53
3.75
0.72
0.7
0.62
1289
2005) were chosen and used in this study. PCR amplification was performed in a volume of 20 µL containing 50 ng of genomic DNA, 0.5 U of Taq-DNA polymerase, 2 µL of 10x PCR buffer, 2 mM MgCl2, 200 µM dNTPs, and 0.4 µM of each primer (MWG Biotech, Ebersberg, Germany). For each primer pairs, a gradient PCR ranging from 50°C to 65°C was carried out to determine the optimum annealing temperature in Corbett Gradient thermocycler (Corbett RESEARCH; CG1-96; Australia). The PCR program consisted of an initial denaturation cycle of 95°C for 3 min, 25 cycles of denaturation at 95°C for 30 sec annealing temperature at 5065°C for 60 sec, and extension at 72°C for 60 sec. The final elongation step was at 72°C for 10 min. Amplified products were checked by electrophoresis on 1.2% Agarose gels, and subsequently alleles separated using 5 µL of each sample, after denaturing in 2 µL of loading buffer (95% Formamide, 20 mM EDTA, 0.05% Bromophenol blue, 0.05% Xylene cyanol) at 95°C for 5 min, on a sequencing polyacrylamide gel (6% polyacrylamide 19:1, 7 M urea, 1×TBE buffer) (BioRad Sequi-Gen, USA). After each run, gels were silver stained according to Creste et al. (2001). All PCR reactions and electrophoreses were repeated at least three times and independently scored. DNA fragments were sized using GeneScan and Genotyper software as well as alleles scoring was done visually. Data analysis The alleles detected for each microsatellite were recorded into a data matrix as presence (1) and absence (0) for each polymorphic band. Similarity matrix and cluster analysis among 90 Iranian hazelnut genotypes were computed using Jaccard’s coefficient and UPGMA method (1000 bootstrapping) with the help of Free-Tree-Free ware Ver. 0.9.1.50 (Pavlicek et al, 1999). The dendrogram was constructed using the TreeView program Ver. 1.6.6 (Page, 1996). Number of alleles per locus, expected heterozygosity (He), observed heterozygosity (Ho), allele frequencies and number of rare alleles for each SSR loci were measured using PopGene software Version 1.31 (Yeh et al., 1999). Polymorphic information content (PIC) value was calculated by the following formula: PIC= 1 - ∑ pi2, where pi was the frequency of the ith allele in each SSR locus (Anderson et al. 1993). References Ahmad Z, Daley LS, Menendez MA, Lagerstedt HB (1987) Characterization of filbert (Corylus) species and cultivars using gradient polyacrylamide gel electrophoresis. J. Environ. Hort. 5: 11-16. Anderson JA, Churchill GA, Autrique JE, Tanksley SD, Sorrels ME (1993) Optimizing parental selection for genetic linkage maps. Genome. 36: 181-186. Bassil NV, Azarenko AN (2001) RAPD markers for self-incompatibility in Corylus avellana L. Acta Hort. 556: 537-543. Bassil NV, Botta R, Mehlenbacher SA (2005) Microsatellite markers in the hazelnut: isolation, characterization and cross-species amplification in Corylus. J. Amer. Soc. Hort. Sci. 130: 543-549. Bassil NV, Botta R, Mehlenbacher SA (2005) Additional microsatellites of the European hazelnut. Acta Hort. 686: 105-110. Boccacci P, Akkak A, Bassil NV, Mehlenbacher SA, Botta R (2005) Characterization and evaluation of microsatellite loci in European hazelnut (Corylus avellana L.) and their
transferability to other Corylus species. Mol. Ecol. Notes. 5: 934-937. Boccacci P, Botta R, Rovira M (2008) Genetic diversity of hazelnut (Corylus avellana L.) germplasm in northeastern Spain. HortSci. 43 (3): 667-672. Boccacci P, Akkak A, Botta R (2006) DNA typing and genetic relationships among European hazelnut (Corylus avellana L.) cultivars using microsatellite markers. Genome. 49: 598-611. Botta R, Akkak A, Boccacci P (2005) DNA typing of hazelnut: a universal methodology for describing cultivars and evaluating genetic relatedness. Acta Hort. 686: 117124. Chen H, Mehlenbacher SA, Smith DC (2005) AFLP markers linked to eastern filbert blight resistance from OSU 408:040 hazelnut. J. Am. Soc. Hort. Sci. 130: 412-417. Creste S, Tulmann-Neto A, Figueira A (2001) A detection of single sequence repeat polymorphisms in denaturing polyacrilamide sequencing gels by silver staining. Plant mol. Boil. Reporter. 19: 299-306. Davis J, Mehlenbacher SA (1997) Identification of RAPD markers linked to eastern filbert blight resistance in hazelnut. Acta Hort. 445: 553-556. Doyle JJ, Doyle JL (1987) A rapid isolation procedure for small quantities of fresh leaf tissue. Phytochem. Bull. 19: 11-15. FAOSTAT (2007) Agriculture data [online]. 26 Feb. 2008. Available from: . Ferrari M, Gori M, Monnanni R, Buiatti M, Scarascia Mugnozza GT, De Pace C (2004) DNA fingerprinting of Corylus Avellana L. accessions revealed by AFLP molecular markers. Acta Hort. 686: 125-134. Galderisi U, Cipollaro M, Di Bernardo G, De Masi L, Galano G, Cascino A (1999) Identification of hazelnut (Corylus Avellana) cultivars by RAPD analysis. Plant Cell Rep. 18: 652-655. Ghanbari A, Akkak A, Boccacci P, Talaie A, Vezvaie A, Botta R (2005) Characterization of hazelnut (Corylus avellana L.) cultivars using microsatellite markers. Acta Hort. 686: 111-115. Gökirmak T, Mehlenbacher SA, Bassil NV (2005) Investigation of genetic diversity among European hazelnut (Corylus avellana L.) cultivars using SSR markers. Acta Hort. 686: 141-147. Gökirmak T, Mehlenbacher SA, Bassil NV (2008) Characterization of European hazelnut (Corylus avellana) cultivars using SSR markers. Genet Resour. Crop Evol. DOI 10.1007/s10722-008-9352-8 Lunde CF, Mehlenbacher SA, Smith DC (2000) Survey of hazelnut cultivars for response to eastern filbert blight inoculation. HortSci. 35: 729-731. Mehlenbacher SA, Brown RN, Davis JW, Chen H, Bassil NV, Smith DC, Kubisiak TL (2004) RAPD markers linked to eastern filbert blight resistance in Corylus avellana. Theor. Appl. Genet. 108: 651-656. Mehlenbacher SA, Brown RN, Nouhra ER, Gökirmak T, Bassil NV, Kubisiak TL (2006) A genetic linkage map for hazelnut (Corylus avellana L.) based on RAPD and SSR markers. Genome. 49: 122-133. Miaja ML, Vallania R, Me C, Akkak A, Nassi O, Lepori G (2001) Varietal characterization in hazelnut by RAPD markers. Acta Hort. 556: 247-250. Molnar TJ, Zaurov DE, Goffreda JC (2007) Survey of hazelnut germplasm from Russia and Crimea for response to eastern filbert blight. HortSci. 42 (1): 51-56.
1290
Page RDM (1996) TreeView: An application to display phylogenetic trees on personal computers. Computer Appl. Biosci. 12: 357-358. Pavlicek A, Harda S, Fleger J (1999) Free- Tree- Free ware program for construction of phylogenetic trees on the basis of distance data and bootstrap/jackknife analysis of the tree robustness. Application in the RAPD analysis of genus Frenkelia. Folia. Biol (Praha). 45: 97-99. Pomper KW, Azerenko AN, Bassil N, Davis JW, Mehlenbacher SA (1998) Identification of random amplified polymorphic DNA (RAPD) markers. Euphytica Theor. Appl. Genet. 97: 479-487. Radiacati L, Botta R, Vergano G, Akkak A (1997) DNA characterization of Corylus seedlings and their evaluation as rootstocks for hazelnut. Acta Hort. 445: 423-431. Rovira M (1997) Genetic variability among hazelnut (C. avellana L.) cultivars. Acta Hort. 445: 45-50.
Solar A, Stampar F, Usenik V (1997) Identification of some hazelnut cultivars (Corylus avellana L.) with isozyme analysis. Acta Hort. 445: 21-29. Thompson MM, Lagerstedt HB, Mehlenbacher SA (1996) Hazelnuts. In: Janick J, Moore JN (eds). Fruit breeding, Vol. 3, Nuts. Wiley, New York. pp 125-184. Thompson MM, Romisondo P, Germain E, Vidal-Barraquer R, Tasias Valls J (1978) An evaluation system for Filberts (Corylus avellana L.). HortSci. 13: 514-517. UPOV (1979) Guidelines for the conduct of test for distinctness, homogeneity and stability. Hazelnut (Corylus avellana L. and Corylus maxima Mill.) TG/71/3 [online]. 26 Feb. 2008. . Yeh FC, Yang RC, Boyle T (1999) POPGENE VERSION 1.31. Microsoft window-based Freeware for Population Genetic Analysis.
1291 1290