Aspects of the Pharmaceutical Business Model: Implications for Australia Draft Working Paper No. 15 Final Draft
Bruce Rasmussen
Pharmaceutical Industry Project Working Paper Series
August 2003
Centre for Strategic Economic Studies Victoria University of Technology PO Box 14428 Melbourne City MC VIC 8001 Australia Telephone +613 9248 1340 Fax +613 9248 1350 Email:
[email protected] Website: http://www.cfses.com
Aspects of the Pharmaceutical Business Model: Implications for Australia Bruce Rasmussen Sources of stress in the pharmaceutical business model
The business model of the large pharmaceutical companies is complex and has become increasingly so with the technological developments in the industry particularly in relation to the innovations introduced by biotechnology. A business model is not a well defined concept but may be paraphrased as a description of ‘how a business makes its money’. It answers a series of questions essential to any business – who are the customers, what do they value, what is the underlying economic logic that explains how that value can be delivered to the customer at an appropriate cost and finally how the business makes its money. It consists of both a narrative of how the business works and the numbers – how it makes a profit (Margretta 2002). Underlying any business model is the structure of its value chain. The business models of large pharmaceutical companies have certain unique aspects. One is the drawn out, highly structured value chain determined in large part by the regulatory process itself. Another is the high cost of product development, with associated high risks of failure. Offsetting these high costs and risks are the high returns for successful product development. A further defining characteristic is the focus on innovation. The pace of innovation both in terms of product innovation and in the process of drug discovery and development has intensified over at least the last decade. These three characteristics while not exhaustive go quite some distance towards identifying the pressure points currently being experienced on the business model of the fully integrated pharmaceutical company and in explaining the changes in strategy necessary to meet these challenges. High risk, cost and return aspects of ethical pharmaceuticals
This may be demonstrated in a number of ways. One is to calculate the probability of successfully taking a drug candidate through the tortuous regulatory process from preclinical to final phase clinical trial and regulatory, generally FDA, approval. Table 1 below provides one estimate of these probabilities, illustrating the low probability of reaching market with an identified drug candidate.
Centre for Strategic Economic Studies
1
Table 1. Industry average success rates: Probability of reaching market from start of each phase* Clinical Phase Pre 10%
I
II
18% 28%
Reg. App. III 66%
91%
* The Pharmaceutical R&D Compendium, CMR International and Scrip’s Complete Guide to Trends in R&D 2000, cited in PAREXEL (2001, p. 195).
Another is focus on the profitability of drugs reaching the market. This too is instructive in that it illustrates the small number of drugs that make a profit. Grabowski and Vernon (1994, 2001) calculated that the NPV of drugs on the market in the period 1980-84 by sales decile. They compared the NPV of drugs in each decile with the estimated average R&D cost of a drug, which they put at just over $200m. The NPV of only the top 20% of drugs exceeded this amount with the NPV of the top 10 % averaging $1000m. In other words 1 out of 10 drugs making it to market returned their owners 5 times their cost. However 3 out of 5 drugs making it to market failed to return to their owners the risk adjusted cost of capital. Perhaps an even more revealing analysis of the dependency of the industry on a small number of drugs for its profitability is provided by Table 2. Table 2. ‘Blockbuster’ sales by major pharmaceutical companies, 2002 Pharma sales $m
Blockbuster sales (>$US $1b) $m
Blockbuster ratio
Number of blockbuster drugs
GlaxoSmithKline Pfizer Merck Aventis BristolMyer Squibb AstraZeneca Johnson & Johnson Novartis Pharmacia Wyeth-Ayerst Eli Lilly
$28,970 $27,815 $21,627 $18,446 $18,119 $17,841 $17,151 $15,181 $12,037 $11,733 $11,078
$14,259 $22,307 $14,055 $5,090 $6,056 $7,746 $5,900 $3,026 $3,050 $3,143 $4,693
49.2% 80.2% 65.0% 27.6% 33.4% 43.4% 34.4% 19.9% 25.3% 26.8% 42.4%
8 8 5 3 3 3 3 2 1 2 2
Total Top 11
$199,998
$89,325
40.7%
40
Company
Source: Annual reports and Credit Suisse First Boston.
The table above lists the 11 largest global pharmaceutical companies by sales of pharmaceuticals for 2001 together with total sales of those drugs with global sales exceeding $US1 billion (‘blockbuster’). According to the measure used in Table 2, there are only 40 blockbusters representing on average 41% of pharmaceutical sales of these companies. The blockbuster ratio
Centre for Strategic Economic Studies
2
however varies widely between companies from a high of 80% for Pfizer to a low of 20% for Novartis. Ownership of the blockbusters is highly concentrated with the three largest companies by sales owning 21 of the 40. The life of a blockbuster drug may not be particularly long. Loss of patent protection is one issue. Another is the entry of follower drugs reducing the market exclusivity period. According to the industry constantly emerging competition from follower drugs has cut market exclusivity from about 4 years in the 1980s to less than 1 year in the 1990s (PhRMA 2001). A number of companies have found themselves caught short, without new blockbusters to keep sales growing. In some cases this arises from a failure to invest adequately in the pipeline. Gambardella (1995) outlines the case of SmithKline which failed to reinvest the proceeds of its Tagamet success in upstream research and it was forced to merge with Beecham in 1989. More often than not mergers occur to cover weaknesses in the R&D pipeline. The need for large pharmaceutical companies to constantly replenish the supply of potential blockbusters requires a consistent and dedicated approach to drug R&D. However no longer is in-house research expertise sufficient and as will be discussed further below pharmaceutical companies have taken the opportunity to utilise various alliance strategies and licensing arrangements to bring prospective drugs into the later stage development processes in which they excel. Improving the productivity of the pharmaceutical company value chain
One of the responses to the need to bring increasing numbers of drugs to market is to improve the productivity of the product pipeline. At one level this has simply involved an increasingly disciplined approach to drug candidate selection and R&D investment. A series of Harvard Business School cases outlines the efforts that Ely Lilly made through the 1990s to improve the focus and efficiency of its drug development pipeline for its blockbuster drugs. The efforts concentrated on improving speed to market, leveraging existing products and establishing a global and focused therapeutic presence. The company narrowed its R&D focus from eight to five therapeutic areas. It organised its staff into product or ‘heavy weight’ teams. These were to break down the functional silos – development, marketing, sales etc into multi functional teams that were designed to take a single drug through the testing process, launch and subsequent marketing. The first such teams were established in 1995 – one for the osteoporosis drug, Evista and the other for Zyprexa, the antipsychotic drug. These teams had an almost free call on resources from the functional groups (Burgleman et al. 2001). Their role evolved over time so that as well as focusing on the sales, marketing and distribution of their blockbuster drugs, they also came to exert more discipline on the drug discovery and development process. Another response has been to in-licence drug candidates from biotech companies. In the pre biotech days, big pharmaceutical companies supplemented their own research
Centre for Strategic Economic Studies
3
with that drawn from university research institutes and hospitals. The new biotech companies offered not only a range of large molecule biologics as drug candidates for range of therapeutic areas, but also an array of new platform technologies that hasten the drug discovery and development process, ranging from high throughput screening based on combitorial chemistry to genomics and proteomics (Granberg and Stankiewicz 2002). This range of specialisations has vastly complicated the lives of pharmaceutical companies. Pharmaceutical companies have actively pursued biotech companies to form alliances for the development of new drugs. Biotech companies have benefited from the funding available from the pharmaceutical companies. It is rare for biotechs to be able to afford to complete the clinical trial process without significant external assistance. Often the pharmaceutical company in return for a revenue stream to be paid to the biotech acquires the development and marketing rights. The structure of these alliances depends on the relative positions of the two companies. Lerner and Merges (1997) have undertaken a detailed analysis of a small number of biotech alliances to determine the balance of control between the biotech and established pharmaceutical company. Their main finding is that, perhaps not surprisingly, the biotechs ceded the greatest control when their financial position is weakest. The study also examined which party was likely to control particular aspects of the alliances. This indicated that the pharmaceutical company was most likely to control the marketing and manufacturing aspects as well as the power to terminate the alliance. The biotech was more likely to retain control over the patents and related litigation. Alliances can take many organisational forms and involve many different payment structures – milestone payments, equity injections, royalty payments etc. Reflecting this the OECD has defined alliances in the following terms: Strategic alliances take a variety of forms, ranging from arm’s-length contract to joint venture. The core of a strategic alliance is an inter-firm co-operative relationship that enhances the effectiveness of the competitive strategies of the participating firms through the trading of mutually beneficial resources such as technologies, skills, etc. Strategic alliances encompass a wide range of inter-firm linkages, including joint ventures, minority equity investments, equity swaps, joint R&D, joint manufacturing, joint marketing, long-term sourcing agreements, shared distribution/services and standards setting. (OECD 2001)
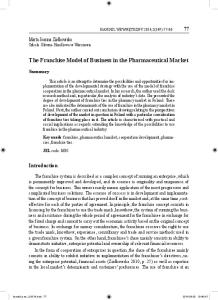
Alliances have not only been formed in pursuit of new drug candidates but have also been with platform companies, which provide the specialist technologies to improve both the drug search process as well as speed up development. Early in the 1990s the sought after technologies related to combinatorial chemistry, high throughput screening, and microarrays while towards the end of the decade the focus moved to technologies relating to genomics. The rapid growth in pharmaceutical related alliances is illustrated in Figure 1.
Centre for Strategic Economic Studies
4
Figure 1. Number of global pharmaceutical and biotech alliances by party, 1990-2002 2000 1800 1600 1400
Number
1200
Uni/ drug Uni/ biotech Bio/biotech Drug/biotech Drug/drug
1000 800 600 400 200 0 1990
1991
1992
1993
1994
1995
1996
1997
1998
1999
2000
2001
2002
Note: 2002 may be incomplete. Source: Recap May 2003.1
There are a number of remarkable aspects to this figure. The first is the growth in total alliances which totalled 314 in 1990 and reached 1776 by 2002. This growth has two phases. The first is the growth between 1990 and 1996 in alliances between pharmaceutical companies (drug) and biotech companies from 180 to 491. The second is the period from 1997 to 2001 when alliances between biotechs grew from 364 to 937 but alliances between pharmaceutical and biotech companies remained virtually unchanged at about 615. The first phase is a product of the pressures being felt by the pharmaceutical companies to maximise the productivity of their pipelines and the complementary need for funding by the emerging biotech companies. In the second the driver seems to be the sharing of technology between the biotechs as will be discussed more fully below. Given that the pressure for pharmaceutical companies to bring drug candidates to market was undiminished, the absence of growth in pharma/biotech alliances perhaps suggests that pharmaceutical companies looked to alternative strategies to obtain drug candidates eg mergers and acquisitions or focused on say a higher proportion of later stage alliances. Certainly the period to 2000 coincided with greater availability of equity capital for biotechs, providing them with increased capacity to internally fund drug development and consequently, with a lower reliance on early stage alliances. Another feature of the chart is the relatively modest growth in alliances with universities or research institutes. This probably reflects the university commercialisation process that begins with the formation of a company, which is often the alliance vehicle rather than the university itself. Most of the university 1
For detailed discussion of the Recap database refer Rasmussen (2002).
Centre for Strategic Economic Studies
5
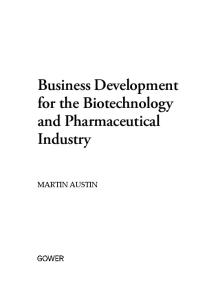
alliances are with biotechs. The number of direct links with large pharmaceutical companies is very small, an average of about 10 per annum over the period. To illustrate some of the ‘technology’ factors behind the two growth phases identified above, Figure 2 shows alliances classified by Recap by type of alliance technologies. Figure 2. Alliance technologies: Genomics and other drug discovery technologies 700
600
500
400 Total other drug disc. Total Genomics 300
200
100
0 1990
1991
1992
1993
1994
1995
1996
1997
1998
1999
2000
2001
2002
Source: Recap May 2003.2
The so-called ‘genomics’ technologies are those involving gene therapy and expression, proteomics and bioinformatics. These grew very rapidly to prominence in the later part of the 1990s and early 2000s from 240 in 1998 to 615 in 2001. Doubtless their growth is a factor behind the second phase of growth in alliances between biotechs. The group of alliance technologies described as ’other drug discovery’ relate to an earlier group of new technologies, combinatorial chemistry, screening, micro arrays etc. Alliance formation based on these technologies began to plateau out in around 1997 at about 250 although they have since risen further to 321 in 2002. The growth in these alliances in the mid 1990s may help explain some of the growth in alliances in the first phase. Although more work on the Recap database would be necessary to dissect alliance technologies by type of alliance partner, this data suggests that the first growth phase in alliances between biotechs and pharmaceutical companies was focused on the acquisition of drug candidates while the next phase had a greater technology focus with alliance between biotechs a dominant feature.
2
For detailed discussion of the Recap database refer to Rasmussen (2002).
Centre for Strategic Economic Studies
6
Implications for Australia
The Australian pharmaceutical and biotechnology industry is small – perhaps 1% of the global industry. It has a number of components, including some of the R&D and other activities of the major foreign owned pharmaceutical companies and some of the activities of Australian owned pharmaceutical companies. However, in terms of the number of companies, the largest component consists of substantially Australian owned companies undertaking drug discovery and development for human purposes and a further group of companies developing supporting technologies and other associated products and services. With one or two exceptions the companies comprising the Australian industry are at an early stage of development. The development prospects of the total industry reduce to the choices made by these young companies on how they obtain the necessary resources and how successfully these resources are applied to transform their early stage product pipelines into marketable drugs and other products. A study of the total drug development pipeline for the larger Australian listed biotechs indicated that it had collectively about 130 drugs under development. More than half of these were at a periclinal stage, only 4 were in phase 3 clinical trail. This compares with over 10,000 under development worldwide (Rasmussen and Sweeny 2002). As with the global industry, the largest 10-20 global pharmaceutical companies have a pivotal role in determining the future direction of the Australian industry. The relationship between these large companies and small biotechs is a vital part of industry development. Many of the same trends for the global, largely US based industry, are observable in Australia. Alliances have been formed by Australian biotechs with the larger pharmaceutical companies and overseas biotechs. Table 3 sets out alliances formed by Australian companies and listed on the ReCap database and supplemented by searches of company web sites, for which detailed information eg via press release provided detail to classify and analyse the purposes of the alliance. Table 3. Australian alliance payouts and trends in the number of alliances, 1996-2002 Total 1996-2002 Partners 1996 1997 1998 1999 2000 2001 2002 Alliances Payouts($m)*
Bio/Biotech 5 2 6 4 Pharma/Biotech 4 3 7 4 Biotech/Uni 0 4 2 3 Uni/Biotech 2 Other 1 0 2 2 Total 10 9 17 10 * Excludes payments made for acquisitions. Source: Recap Aug 2002, updated Aug 2003.
Centre for Strategic Economic Studies
10 9 2
25 6 3
1 22
5 39
11 5 4 3 23
63 38 14 6 14 130
126 222 9 0 357
7
About half of the alliances were between biotechs (63 of 130); about thirty per cent (38) were between biotechs and pharmaceutical companies and 15% involved universities mostly with biotechs. Almost all alliances between biotechs and pharmaceutical companies involved the biotech providing the R&D, with the pharmaceutical companies acting as the funding source. The number of alliances reporting payouts was small – only 17, so drawing firm conclusions are difficult, even though the results are interesting.3 Of the total of $357m reported, almost two thirds ($222m) was for payments made to biotechs by pharmaceutical companies. However almost all of the remainder was for alliances between biotechs ($126m), with payouts to universities from biotechs totalling $9m. While the prominent role played by the pharmaceutical companies is as expected, the magnitude of the biotech payouts to other biotechs is perhaps surprising. This must be qualified to the extent that one of the largest biotech alliance payouts ($43m) involved a biotech company, which was in the process of becoming a subsidiary of a pharmaceutical company. The small number of transactions reported means that the results tend to strongly reflect the activities of a small number of companies. Of the total payout value of $357m, $187m relates to alliances involving AMRAD. Whether this properly reflects AMRAD’s relative position or an under reporting by other companies, is a little difficult to judge. Undoubtedly there are some alliances in which the payments are confidential. The purpose of most of the alliances reviewed in detail fell into one of three categories: • drug discovery or development; • development of platform or other supporting technologies; and • product distribution. A significant proportion (23%) was concerned with drug development although only 4 alliances of this kind were with pharmaceutical companies. Most of the ‘development’ alliances have a biotech as the client and either another biotech or university as the research house. These results provide further evidence of the more influential role being adopted by biotechs in alliance structures. Table 4. The number of alliances by main purpose, 1996-2001 Main purpose* Development Distribution Technology Other
Bio/biotech Pharma/biotech Biotech/Uni Other Total 9 4 24 7
4 9 12 5
Total 44 30 * Includes only alliances announced by press release.
7 0 4 0
1 1 2 1
21 14 42 13
11
5
90
3
The data for payouts is derived from the value disclosed in press release or other documentation announcing the alliance. It is generally a lump sum incorporating an upfront payment (e.g. licence fee) together with expected near term milestone or other payments.
Centre for Strategic Economic Studies
8
By far the largest category (42) was where the main purpose of the alliance was the exchange, or a collaboration with a company to further develop, platform or other supporting technologies (see Table 4). Some of these alliances involve the acquisition or development of Australian technology for use by or incorporation in an overseas company’s product line. In other cases the alliances appear to contemplate a genuine partnership in which different specialisations are to be combined to produce a new prototype product that is to be marketed by both alliance partners. Alliances between biotechs are the largest sub category within the ‘technology’ category, 24 out of 42, although the number with pharmaceutical companies (12) is also significant. With respect to the types of Australian alliance technologies, alliances involving genomics are prominent in recent years, but other features such as the early growth in ‘other drug discovery’ technologies noted earlier for the rest of the world (see Figure 2) seem absent from the Australian data. Overall however similar trends are observable in Australia as for the global industry. Alliances between biotechs are of increasing numerical significance. Typically this involves technology transfers although in a number of cases overseas biotechs are helping fund drug development by Australian biotechs. Nonetheless the pharmaceutical companies continue to be important in underpinning both drug development and technology transfers by Australian firms. Their funding role is especially crucial. Implications for Australian Policy Developments: Some Observations
This paper focuses on the importance of linkages to the large pharmaceutical companies and increasingly overseas biotechs as sources of funding support and opportunities for technology transfers. This analysis suggests that both pharmaceutical companies and larger biotechs have an important role in funding drug development. They have a desperate need for drug candidates to top up their product pipelines and so there is a significant opportunity for Australian companies to form valuable relationships with these companies. The Victorian and Queensland Governments have led the way in supporting international showcasing of Australian talent at the various international fora. However while these events can provide valuable contacts and individual successes, a program of support for tours by in licensing teams of large pharmaceuticals and selected biotechs would seem to allow less pressured consideration of Australian opportunities. The role of the large pharmaceutical companies remains central to alliance funding of drug development. The biotechs seem more important for technology transfer. It seems to be essential that Australian companies form part of the ‘inner circle’ of consideration of alliances by the major overseas pharmaceutical companies. A further aspect is to increase the flow of drug candidates and other biomedical technologies. Despite the heavy investment in medical and biotech related R&D, Australia has little to show by way of commercial outcomes. While having some success in medical equipment, the biomedical industry has produced only one commercial drug, Relenza, in alliance with Glaxo – itself only modest success due to
Centre for Strategic Economic Studies
9
low sales. With a total pipeline of only 130 drug candidates the productivity of the Australian pipeline appears low – 1-2% of the global pipeline and hardly punching above its weight compared say with scientific publications. One issue is whether the scientific community is sufficiently commercially focused. Currently the government’s scientific investment is distributed according to a peer review process that pays scant regard to commercial outcomes. Meanwhile companies involved in discovery process struggle to conduct their R&D programs. An opportunity for greater company input into the allocation of government R&D may help address this pipeline shortfall.
References
Burgleman, R., Maidique, M. and Wheelwright, S. 2001, Strategic Management of Technology and Innovation, McGraw Hill, Boston. Gambardella, A. 1995, Science and Innovation, Cambridge University Press, New York. Grabowski, H. and Vernon, J. 1994, ‘Returns to R&D on new drug introductions in the 1980s’, Journal of Health Economics, vol. 13, no. 4, pp. 383-406. Grabowski, H. and Vernon, J. 2001, ‘Pressures from the demand side: Changing market dynamics and industrial structure’, in H. Kettler (ed.) Consolidation and Competition in the Pharmaceutical Industry, based on papers delivered at the OHE Conference, London 16 October 2000, Office of Health Economics, London. Granberg, A. and Stankiewicz, R. 2002, ‘Biotechnology and the Transformation of the Pharmaceutical Value Chain and Innovation System’, paper presented at the Medicon Valley BioConference 2002, Medicon Valley Academy, 8-10 October, Copenhagen. Lerner, J. and Merges, R. 1997, ‘The control of strategic alliances: An empirical analysis of biotechnology collaborations’, NBER Working Paper No. 6014, National Bureau of Economic Research, Cambridge, Mass. Margretta, J. 2002 ‘Why business models matter’, Harvard Business Online, January, http://harvardbusinessonline.hbsp.harvard.edu Organisation for Economic Cooperation and Development (OECD) 2001, ‘Biotechnology Statistics in OECD member countries: Compendium of existing national statistics’, DSTI/EAS/STP/NESTI(2001)2, Second Ad Hoc Meeting on Biotechnology Statistics, Working Party of National Experts on Science and Technology Indicators, OECD, Paris. Parexel International Corporation 2001, Parexel’s Pharmaceutical R&D Statistical Sourcebook 2001, Boston. Pharmaceutical Research and Manufacturers of America (PHRMA) 2001, Pharmaceutical Industry Profile 2001, PHRMA, Washington DC. Rasmussen, B. 2002, ‘The Role of Pharmaceutical Alliances’, Draft Working Paper No. 2, Pharmaceutical Industry Project, CSES, Victoria University, Melbourne. Rasmussen, B. and Sweeny, K. 2002, ‘Development Options: Technology, Alliances and Australian Biotechnology’, Working Paper No. 9, Pharmaceutical Industry Project, CSES, Victoria University, Melbourne.
Centre for Strategic Economic Studies
10