Indicator A6
Are students who enjoy reading better readers? • Across OECD countries, the quarter of students who most enjoy reading score one-and-a-half proficiency levels higher in reading than the quarter who enjoy reading the least.
• In most countries, students who read fiction for enjoyment are much more likely to be good readers.
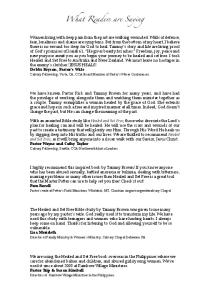
Chart A6.1. Relationship between enjoying reading and performance in reading By national quarters of the index of enjoyment in reading
Mean score
Bottom quarter Second quarter Third quarter Top quarter
600 550 500 450
Finland Australia Ireland Switzerland New Zealand Norway Iceland Sweden United Kingdom Denmark Germany France Estonia Czech Republic Hungary Canada Austria Poland OECD average Spain Korea United States Slovenia Luxembourg Greece Netherlands Belgium Italy Japan Russian Federation Slovak Republic Portugal Shanghai-China Chile Israel Turkey Brazil Mexico Argentina Indonesia
350
27 26 24 22 22 22 22 22 22 21 21 21 21 21 20 20 20 19 18 18 18 17 17 17 17 17 17 16 15 15 14 14 12 8 8 6 5 4 4 3
400
% of variance explained in student performance
Countries are ranked in descending order of the percentage of explained variance in student performance. Source: OECD, PISA 2009 Database, Table A6.1. 1 2 http://dx.doi.org/10.1787/888932460306 How to read this chart The chart shows the variation in student reading performance according to the quarter of the index of enjoyment of reading in which students are classified (see Definitions below). Countries are ranked according to the percentage of the variation in reading performance explained by the index of enjoyment of reading which is indicated next to the name of the country; thus, countries on the left part of the chart are those where a large share of variation in student performance can be explained by how much students reported enjoying reading. Countries where a relatively small share of this variation can be explained by how much students reported enjoying reading are in the right part of this chart.
Context Students who enjoy reading, and therefore make it a regular part of their lives, are able to build their reading skills through practice. PISA shows strong associations between reading enjoyment and performance. This does not mean that results show that enjoyment of reading has a direct impact on reading scores; rather, the finding is consistent with research showing that such enjoyment is an important precondition for becoming an effective reader. Therefore, to bolster reading performance, schools need to both instruct students in reading techniques and foster an interest in reading.
While the strongest readers are those who read fiction, in practice, many students show a preference for other reading materials that have more direct relevance to their daily lives. Encouraging reading of diverse materials, such as magazines, newspapers and non-fiction books, can help to make reading a habit, especially for some weaker readers who might not be inclined to read a work of fiction.
100
Education at a Glance © OECD 2011
Other findings
• On average across OECD countries, 37% of students reported that they do not read for
Indicator A6
enjoyment at all.
• Students who read newspapers, magazines and non-fiction books are better readers in many countries, although the effect of these materials on reading performance is not as much pronounced as the effect of fiction books.
• In every country, girls read for enjoyment more than boys (index for enjoyment is 0.31 and -0.31, respectively). Girls also read fiction and magazines more than boys, but boys are more likely to read newspapers and comic books. Trends Students in 2009 tended to be less enthusiastic about reading than their counterparts were in 2000. Accross the 26 OECD countries that participated in both assessments, the percentage of students who reported reading for enjoyment fell from 69% to 64%. While the majority of students do read for enjoyment, the growth in the minority who do not should prompt schools to try to engage students in reading activities that they find relevant and interesting.
Education at a Glance © OECD 2011
101
chapter A
Analysis Enjoyment of reading and student performance
The quarter of students who show the highest levels of reading enjoyment attain at least proficiency Level 4, meaning that they have a 50% chance of completing a relatively complex reading task. In Australia and Finland, two of the best-performing countries overall, over 25% of differences in reading performance are associated with how much students enjoy reading. In these countries and in New Zealand, the quarter of students who enjoy reading the most reach exceptionally high levels of reading proficiency, around the middle of Level 4. In 16 OECD countries, at least 20% of the variation in reading performance is explained by enjoyment of reading. On average in OECD countries, there is a difference of 103 points between the average scores of the top and bottom quarters of students ranked by reading enjoyment. The quarter of students who score the lowest are generally only able to perform relatively simple reading tasks at baseline proficiency Level 2 (see Definitions below). PISA results show that the group of countries where enjoyment of reading makes the least difference in reading performance tend to have lower reading scores, overall, than those countries where enjoyment of reading makes more of a difference. However, this is not true in Japan, Korea and Shanghai-China (Chart A6.1). Time spent reading for enjoyment is strongly related to reading performance. Better readers tend to read more because they are more motivated to read, which, in turn, leads to improved vocabulary and comprehension skills. In all countries and economies that participated in PISA 2009, students who read for enjoyment tend to be more proficient readers than students who do not read for enjoyment. Chart A6.2 shows the average score in the PISA 2009 reading assessment for five groups of students in each country: students who do not read for enjoyment; students who read for enjoyment for up to 30 minutes per day; students who spend between half an hour and one hour daily reading for enjoyment; students who spend between one and two hours; and a group of extremely dedicated readers who reported spending more than two hours per day reading for enjoyment.
Chart A6.2. Relationship between time spent reading for enjoyment and performance in reading
Mean score
More than 2 hours a day 1 to 2 hours a day More than 30 minutes to less than 60 minutes a day 30 minutes or less a day Do not read for enjoyment
600 550 500 450
350
66 63 63 62 60 60 58 57 57 56 55 55 54 53 52 49 48 48 47 47 45 44 44 41 40 39 37 35 32 32 31 29 25 24 23 12 10 7 4 -1
400
Iceland Shanghai-China Belgium France Switzerland Sweden Norway Austria Netherlands Luxembourg Australia Germany Finland Slovenia New Zealand Canada Czech Republic Ireland United States United Kingdom Estonia OECD average Japan Slovak Republic Italy Denmark Hungary Poland Korea Portugal Spain Greece Russian Federation Turkey Israel Chile Indonesia Brazil Argentina Mexico
A6
The Output of Educational Institutions and the Impact of Learning
Score point difference between students who read up to 30 minutes a day and students who don’t read for enjoyment
Countries are ranked in descending order of the score point difference between students who read up to 30 minutes a day and students who don't read for enjoyment. Source: OECD, PISA 2009 Database, Table A6.2. 1 2 http://dx.doi.org/10.1787/888932460325
102
Education at a Glance © OECD 2011
Are Students Who Enjoy Reading Better Readers? – Indicator A6
chapter A
On average across OECD countries, over one-third of students – and 40% or more in Austria, Belgium, the Czech Republic, Germany, Ireland, Japan, Luxembourg, the Netherlands, Norway, the Slovak Republic, Switzerland and the United States – reported that they did not read for enjoyment at all. The average score among these students, 460 points on the PISA reading scale, is well below the OECD average of 493 score points. Another one-third of students across OECD countries read for 30 minutes or less per day. Their mean performance, 504 score points, is in line with the OECD average. A further 17% of students across OECD countries read for between half-an-hour and one hour per day, and achieve an average score of 527 points. Students who reported reading for longer – between one and two hours per day – and assiduous readers, who read for enjoyment for more than two hours daily, achieve scores of 532 and 527 points, respectively (Table A6.2). In more than two-thirds of countries that participated in PISA, the score point difference associated with at least some daily reading for enjoyment is far greater than the score point difference associated with increasing amounts of time spent reading. The gap in performance between students who read for enjoyment for 30 minutes or less per day and students who do not read for enjoyment at all is more than 30 points in 31 countries; in Belgium, France and Iceland it is more than 60 points. However, the performance gap between students who read for enjoyment between 30 minutes and one hour per day and students who read 30 minutes or less is more than 30 points in only five countries: Australia, the Czech Republic, Germany, Ireland and New Zealand. In no country is the performance gap between students who read for enjoyment between one and two hours per day and students who read between half-an-hour and one hour per day more than 20 points. The poor reading performance among students who do not read for enjoyment at all demands that education systems encourage reading both in and outside of school. Given that the association between reading daily for enjoyment and reading proficiency is stronger than that between how many hours a day students read and reading proficiency, policy makers should focus on encouraging students to read daily for enjoyment rather than on how much time they spend reading. Reading material and student performance
PISA 2009 offers a valuable opportunity to explore the association between what students report reading in their free time and reading performance. Although no causal relationship can be established, PISA results offer a glimpse of how reading certain materials is associated with reading proficiency. Chart A6.3 presents the difference in reading performance between students who reported reading regularly, either several times a month or several times a week, and for their enjoyment, different types of material: magazines, comic books, fiction (novels, narratives, stories), non-fiction, and newspapers, and students who reported not reading these materials for enjoyment. Reading fiction for a student’s own enjoyment appears to be positively associated with higher performance in the PISA 2009 reading assessment, while reading comic books is associated with little improvement in reading proficiency in some countries, and with lower overall reading performance in other countries (Table A6.3). In most countries, students who read fiction are particularly likely to be good readers. On average across OECD countries, students who read fiction for their own enjoyment at least several times a month score 53 points above those who do so less frequently. This is equivalent to three-quarters of a proficiency level and more than a year’s worth of formal schooling. However, the link between reading fiction and strong reading performance varies greatly across countries. In Argentina, Brazil, Mexico and Turkey there is no positive relationship of this kind. However, in the OECD countries Australia, Austria, Finland, Luxembourg and Sweden, there is a gap of at least one proficiency level between the scores of those 15-year-olds who read fiction frequently and those students who read fiction less often. Students who read magazines and newspapers regularly for enjoyment also tend to be better readers than those who do not. However, the relationship is less strong than that between performance and reading fiction. Only in Iceland, Israel and Sweden do regular readers of newspapers score at least 35 points more, on average, than other students. Students who read magazines regularly score at least 35 points above those who do not in Finland, Hungary, the Netherlands and the Slovak Republic. Education at a Glance © OECD 2011
103
A6
chapter A
The Output of Educational Institutions and the Impact of Learning
Chart A6.3. [1/2] Relationship between the types of materials students read and performance in reading
A6
Score point difference between students who read these materials and students who do not OECD average 53 score points
OECD average -3 score points
Fiction
OECD average 22 score points
Comic books
Non-fiction
Australia
Belgium
Spain
Luxembourg
Norway
Slovenia
Sweden
Italy
Sweden
Austria
Iceland
Netherlands
Finland
Switzerland
Poland
France
Netherlands
Australia
Czech Republic
France
Portugal
Switzerland
Sweden
Iceland
Germany
Denmark
Ireland
United Kingdom
Finland
Slovak Republic
Iceland
Indonesia
Korea
New Zealand
Japan
Chile United Kingdom
Norway
Spain
Slovenia
Slovak Republic
Estonia
Belgium
Czech Republic
Indonesia
Ireland
Canada
Czech Republic
Canada
Australia
Finland
Slovak Republic
Greece
Denmark
Spain
Argentina
Japan
Poland
Portugal
Greece
Netherlands
Luxembourg
New Zealand
Greece
Germany
Mexico
United States
Chile
Canada
Japan
Korea
Luxembourg
Italy
Mexico
Russian Federation
Denmark
Slovenia
Hungary
Portugal
United States
Italy
Estonia
Poland
Brazil
Russian Federation
Hungary
Belgium
Hungary
Turkey
Israel
Korea
Shanghai-China
Austria
Israel
Brazil
Shanghai-China
Chile
New Zealand
Switzerland
Shanghai-China
Austria
Germany
Indonesia
United Kingdom
Norway
Turkey
Israel
Argentina
Argentina
Ireland
France
Brazil
Estonia
United States
Mexico
Russian Federation
Turkey
-40 -20 0 20 40 60 80
-40 -20 0 20 40 60 80
-40 -20 0 20 40 60 80
Score point difference
Score point difference
Score point difference
Note: Score point differences that are statistically significant are marked in a darker tone. Source: OECD, PISA 2009 Database, Table A6.3. 1 2 http://dx.doi.org/10.1787/888932460344
104
Education at a Glance © OECD 2011
Are Students Who Enjoy Reading Better Readers? – Indicator A6
chapter A
Chart A6.3. [2/2] Relationship between the types of materials students read and performance in reading
A6
Score point difference between students who read these materials and students who do not OECD average 15 score points
OECD average 16 score points
Magazines Netherlands
Newspapers Iceland
Hungary
Israel
Finland
Sweden
Slovak Republic
Shanghai-China
Sweden
Netherlands
Poland
Korea
Belgium
Chile
Argentina
Japan
Israel
Turkey
Chile
Switzerland
Brazil
Norway
Iceland
Estonia
France
Austria
Switzerland
Italy
Denmark
Finland
Slovenia
Hungary
Indonesia
Poland
Estonia
Germany
Greece
Indonesia
Norway
Belgium
Mexico
Denmark
Shanghai-China
France
Luxembourg
Brazil
Italy
Australia
Czech Republic
Slovak Republic
Austria
Argentina
Russian Federation
Canada
Spain
Spain
Canada
Slovenia
Germany
Czech Republic
United States
New Zealand
Ireland
Mexico
Korea
United States
United Kingdom
Luxembourg
Portugal
Greece
Turkey
United Kingdom
Japan
Russian Federation
Australia
Portugal
New Zealand
Ireland
-40 -20 0 20 40 60 80
-40 -20 0 20 40 60 80
Score point difference
Score point difference
Note: Score point differences that are statistically significant are marked in a darker tone. Source: OECD, PISA 2009 Database, Table A6.3. 1 2 http://dx.doi.org/10.1787/888932460344
Education at a Glance © OECD 2011
105
chapter A
Frequent readers of non-fiction read at a higher level than average in some countries, but in most countries, there is no significant positive relationship. The difference is greater than 35 score points in the Netherlands, Poland, Slovenia, Spain and Sweden. Reading comic books is generally associated with a low level of reading performance. This could well be because weaker readers find comic books more accessible. These findings need to be set alongside the actual frequency with which students read different materials for enjoyment. On average in OECD countries:
• 62% of students read newspapers at least several times a month; • 58% read magazines; • 31% read fiction; • 22% read comic books; and • 19% read non-fiction books. Reading habits of boys and girls
In every country except Korea, girls reported reading for enjoyment more than boys. On average across OECD countries, just over half of boys (52%) but nearly three-quarters of girls (73%) said that they read for enjoyment (Chart A6.4). The gender gap in reading for enjoyment is greatest in Estonia and the Netherlands, where it is at least 30 percentage points. In 12 countries, only a minority of boys reported that they read for enjoyment. In Austria, Luxembourg and the Netherlands, fewer than 40% of boys said that they read for enjoyment.
Chart A6.4. Percentage of students, by whether they spend any time reading for enjoyment and by gender All students
%
100 90 80 70 60 50 40 30 20 10 0
Boys
Girls
Netherlands Estonia Poland Slovenia Portugal Germany Finland Czech Republic Canada Italy Luxembourg Sweden Switzerland Slovak Republic Austria United States OECD average Iceland Australia Israel Norway Chile Belgium Spain United Kingdom New Zealand Turkey Denmark Brazil Hungary France Argentina Russian Federation Mexico Greece Ireland Indonesia Shanghai-China Japan Korea
A6
The Output of Educational Institutions and the Impact of Learning
Countries are ranked in descending order of the percentage point difference between girls and boys. Source: OECD, PISA 2009 Database, Table A6.4. 1 2 http://dx.doi.org/10.1787/888932460363
In some of the countries that show small gender differences in enjoyment of reading, both boys and girls are relatively unlikely to report that they enjoy reading. In Japan, for example, only 54% of boys and 58% of girls reported that they enjoy reading. In some countries, the narrow gender gap reflects the opposite: both boys and girls enjoy reading to nearly the same extent. For example, in Indonesia and in Shanghai-China, at least 80% of boys and 90% of girls reported that they read for enjoyment.
106
Education at a Glance © OECD 2011
chapter A
Are Students Who Enjoy Reading Better Readers? – Indicator A6
Other data from PISA show that girls and boys typically enjoy different kinds of reading. Girls are twice as likely to read fiction for enjoyment, and are more likely than boys to read magazines; boys more commonly read newspapers and comic books. The fact that two in three boys, on average in OECD countries, reported that they read newspapers for pleasure, compared to only one in five who said they read fiction for enjoyment, shows that there could be far more potential for strengthening boys’ reading skills by encouraging boys to read other materials in addition to literature (Chart A6.5).
Chart A6.5. What boys and girls read for enjoyment, OECD average
Percentage of boys and girls who reported that they read “several times a month” or “several times a week” the following materials because they want to Percentage of students
Boys
70 60 50 40 30 20 10 0
Magazines
Comic books
Girls
Fiction (novels, narratives, stories)
Non-fiction books
Newspapers
Note: All differences between boys and girls are significant. Source: OECD, PISA 2009 Database, Table A6.5, available on line. 1 2 http://dx.doi.org/10.1787/888932460382
Changes in whether students read for enjoyment
In 18 of the 30 countries for which comparable data are available, the percentage of 15-year-olds who reported that they enjoy reading fell between 2000 and 2009. In nine countries it did not change significantly, and in three the percentage grew (Chart A6.6).
Chart A6.6. Percentage of students who read for enjoyment in 2000 and 2009 Percentage of students who read for enjoyment
2000
2009
90 80 70 60 50
2009 higher than 2000
2009 lower than 2000
No statistically significant difference
+
–
o
Switzerland –
Japan +
Belgium o
United States o
Czech Republic –
Ireland –
Argentina –
Norway –
Germany o
Chile –
Spain –
France –
Korea –
Iceland –
Sweden o
Australia –
Israel o
Portugal –
Italy –
Denmark –
Poland –
Finland –
New Zealand o
Canada +
Hungary o
Brazil –
Mexico –
Greece +
30
Russian Federation o
40 Change in the percentage of students who read for enjoyment between 2000 and 2009
95% confidence level
Countries are ranked in descending order of the percentage of students who read for enjoyment in 2009. Source: OECD, PISA 2009 Database, Table A6.2. 1 2 http://dx.doi.org/10.1787/888932460401
Education at a Glance © OECD 2011
107
A6
chapter A
A6
The Output of Educational Institutions and the Impact of Learning
The largest declines in reading enjoyment, by at least double the average rate, occurred in Argentina, Chile, the Czech Republic, Finland, Mexico, Portugal. In some cases, students who had been very enthusiastic about reading in 2000 were considerably less so in 2009. For example, in Portugal, more than one student in three did not read for enjoyment in 2009, compared to fewer than one in five in 2000. In three countries, however, the percentage of students who reported that they read for enjoyment rose. The increase was greatest in Japan, where the smallest proportion of students – just 45% – reported that they read for enjoyment in 2000. By 2009 this proportion had grown to 56%, although this was still well below the OECD average.
Definitions The index of enjoyment of reading was derived from students’ level of agreement with the following statements: i) I read only if I have to; ii) reading is one of my favourite hobbies; iii) I like talking about books with other people; iv) I find it hard to finish books; v) I feel happy if I receive a book as a present; vi) for me, reading is a waste of time; vii) I enjoy going to a bookstore or library; viii) I read only to get information that I need; ix) I cannot sit still and read for more than a few minutes; x) I like to express my opinions about books I have read; and xi) I like to exchange books with my friends. PISA reading proficiency levels summarise student performance on a scale that provides an overall picture of students’ accumulated reading skills, knowledge and understanding at age 15. Seven levels of reading proficiency were constructed for PISA 2009, with Level 6 describing very high levels of proficiency and Level 1b describing students with the least proficiency in reading. Level 2 is considered the baseline level of proficiency, at which students begin to demonstrate the reading skills that will enable them to participate effectively and productively in life. Students at that level can locate information that meets several conditions, make comparisons or contrasts around a single feature, work out what a well-defined part of a text means, even when the information is not prominent, and make connections between the text and personal experience. Across OECD countries, some 81% of students are proficient at reading at Level 2 or higher. Students who attain Level 4 proficiency can tackle more difficult reading tasks, such as locating embedded information, construing meaning from nuances of language, and critically evaluating a text. Across OECD countries, 28% of students are proficient at Level 4 or higher.
Methodology The statistical data for Israel are supplied by and under the responsibility of the relevant Israeli authorities. The use of such data by the OECD is without prejudice to the status of the Golan Heights, East Jerusalem and Israeli settlements in the West Bank under the terms of international law. References OECD (2010c), PISA 2009 Results: Learning to Learn: Student Engagement, Strategies and Practices (Volume III), OECD, Paris. The following additional material relevant to this indicator is available on line: • Table A6.5. Percentage of boys and girls who read diverse materials 1 2 http://dx.doi.org/10.1787/888932462852
108
Education at a Glance © OECD 2011
Are Students Who Enjoy Reading Better Readers? – Indicator A6
chapter A
Table A6.1. [1/2] Index of enjoyment of reading and reading performance, by national quarters of this index Results based on students’ self-reports Index of enjoyment of reading
OECD
All students
Australia Austria Belgium Canada Chile Czech Republic Denmark Estonia Finland France Germany Greece Hungary Iceland Ireland Israel Italy Japan Korea Luxembourg Mexico Netherlands New Zealand Norway Poland Portugal Slovak Republic Slovenia Spain Sweden Switzerland Turkey United Kingdom United States
Other G20
OECD average Argentina Brazil Indonesia Russian Federation Shanghai-China
Boys
Girls
Gender difference (B - G)
Bottom quarter
Second quarter
Third quarter
Top quarter
Mean index
S.E.
Mean index
S.E.
Mean index
S.E.
Dif.
S.E.
Mean index
S.E.
Mean index
S.E.
Mean index
S.E.
Mean index
S.E.
0.00 -0.13 -0.20 0.13 -0.06 -0.13 -0.09 -0.03 0.05 0.01 0.07 0.07 0.14 -0.06 -0.08 0.06 0.06 0.20 0.13 -0.16 0.14 -0.32 0.13 -0.19 0.02 0.21 -0.10 -0.20 -0.01 -0.11 -0.04 0.64 -0.12 -0.04
(0.02) (0.03) (0.02) (0.01) (0.01) (0.02) (0.02) (0.02) (0.02) (0.03) (0.02) (0.02) (0.02) (0.02) (0.02) (0.02) (0.01) (0.02) (0.02) (0.02) (0.01) (0.03) (0.02) (0.02) (0.02) (0.02) (0.02) (0.01) (0.01) (0.02) (0.02) (0.02) (0.02) (0.03)
-0.33 -0.55 -0.45 -0.28 -0.28 -0.44 -0.35 -0.38 -0.41 -0.23 -0.38 -0.24 -0.15 -0.38 -0.30 -0.26 -0.27 0.02 0.00 -0.51 -0.04 -0.66 -0.17 -0.50 -0.36 -0.15 -0.36 -0.53 -0.28 -0.47 -0.44 0.34 -0.37 -0.35
(0.02) (0.03) (0.02) (0.02) (0.02) (0.02) (0.02) (0.02) (0.02) (0.03) (0.02) (0.02) (0.03) (0.02) (0.03) (0.03) (0.01) (0.03) (0.02) (0.02) (0.01) (0.03) (0.02) (0.02) (0.02) (0.02) (0.02) (0.02) (0.02) (0.02) (0.02) (0.02) (0.02) (0.03)
0.31 0.26 0.07 0.55 0.16 0.22 0.17 0.33 0.50 0.24 0.52 0.36 0.43 0.25 0.15 0.35 0.41 0.38 0.27 0.20 0.32 0.02 0.44 0.13 0.39 0.54 0.15 0.14 0.26 0.26 0.37 0.95 0.13 0.28
(0.02) (0.03) (0.02) (0.02) (0.02) (0.02) (0.02) (0.02) (0.02) (0.03) (0.03) (0.02) (0.02) (0.02) (0.03) (0.03) (0.01) (0.02) (0.02) (0.03) (0.01) (0.03) (0.02) (0.03) (0.03) (0.02) (0.02) (0.02) (0.01) (0.03) (0.03) (0.02) (0.02) (0.03)
-0.64 -0.81 -0.52 -0.83 -0.44 -0.66 -0.52 -0.71 -0.91 -0.47 -0.89 -0.60 -0.58 -0.63 -0.45 -0.60 -0.68 -0.36 -0.27 -0.71 -0.35 -0.69 -0.61 -0.63 -0.75 -0.69 -0.51 -0.67 -0.55 -0.72 -0.80 -0.61 -0.50 -0.63
(0.03) (0.04) (0.03) (0.02) (0.02) (0.03) (0.03) (0.03) (0.03) (0.04) (0.03) (0.03) (0.04) (0.03) (0.04) (0.04) (0.02) (0.03) (0.03) (0.03) (0.01) (0.03) (0.03) (0.03) (0.03) (0.02) (0.03) (0.03) (0.02) (0.03) (0.03) (0.03) (0.03) (0.03)
-1.36 -1.52 -1.42 -1.25 -1.01 -1.21 -1.17 -1.07 -1.25 -1.26 -1.33 -0.95 -0.94 -1.28 -1.30 -1.16 -1.10 -1.07 -0.82 -1.43 -0.77 -1.47 -1.07 -1.41 -1.21 -0.87 -1.07 -1.35 -1.15 -1.29 -1.46 -0.34 -1.29 -1.27
(0.01) (0.02) (0.01) (0.01) (0.01) (0.01) (0.01) (0.01) (0.02) (0.01) (0.01) (0.01) (0.01) (0.02) (0.02) (0.01) (0.01) (0.01) (0.01) (0.02) (0.01) (0.02) (0.02) (0.01) (0.01) (0.02) (0.02) (0.01) (0.01) (0.02) (0.02) (0.01) (0.02) (0.01)
-0.37 -0.65 -0.58 -0.24 -0.37 -0.46 -0.40 -0.37 -0.28 -0.33 -0.45 -0.22 -0.19 -0.43 -0.44 -0.28 -0.28 -0.19 -0.15 -0.58 -0.13 -0.66 -0.21 -0.56 -0.43 -0.09 -0.41 -0.55 -0.35 -0.45 -0.50 0.33 -0.45 -0.41
(0.00) (0.01) (0.00) (0.00) (0.00) (0.00) (0.01) (0.00) (0.01) (0.01) (0.01) (0.00) (0.01) (0.01) (0.01) (0.00) (0.00) (0.01) (0.00) (0.01) (0.00) (0.01) (0.01) (0.01) (0.00) (0.00) (0.00) (0.00) (0.00) (0.01) (0.01) (0.00) (0.00) (0.00)
0.31 0.16 0.11 0.45 0.10 0.10 0.15 0.20 0.36 0.34 0.42 0.29 0.37 0.18 0.19 0.31 0.37 0.48 0.31 0.12 0.32 -0.03 0.40 0.09 0.21 0.44 0.06 0.06 0.23 0.18 0.32 0.80 0.14 0.19
(0.00) (0.01) (0.01) (0.00) (0.00) (0.00) (0.01) (0.01) (0.01) (0.01) (0.01) (0.01) (0.01) (0.01) (0.01) (0.01) (0.00) (0.01) (0.00) (0.01) (0.00) (0.01) (0.01) (0.01) (0.01) (0.00) (0.00) (0.01) (0.00) (0.00) (0.01) (0.00) (0.00) (0.01)
1.42 1.47 1.11 1.57 1.02 1.06 1.07 1.10 1.35 1.30 1.63 1.14 1.30 1.27 1.23 1.35 1.27 1.58 1.17 1.25 1.15 0.88 1.41 1.12 1.49 1.35 1.02 1.04 1.22 1.14 1.48 1.77 1.13 1.33
(0.01) (0.02) (0.01) (0.01) (0.02) (0.02) (0.02) (0.02) (0.02) (0.02) (0.02) (0.02) (0.02) (0.02) (0.02) (0.02) (0.01) (0.02) (0.02) (0.02) (0.01) (0.02) (0.02) (0.02) (0.02) (0.02) (0.02) (0.02) (0.01) (0.02) (0.02) (0.02) (0.02) (0.02)
0.00
(0.00)
-0.31
(0.00)
0.31
(0.00)
-0.62
(0.01)
-1.17
(0.00)
-0.36
(0.00)
0.26
(0.00)
1.27
(0.00)
-0.16 0.27 0.43 0.07 0.57
(0.02) (0.01) (0.01) (0.01) (0.01)
-0.34 0.05 0.32 -0.15 0.39
(0.02) (0.01) (0.01) (0.02) (0.02)
-0.01 0.47 0.55 0.29 0.75
(0.02) (0.01) (0.01) (0.02) (0.01)
-0.34 -0.42 -0.22 -0.44 -0.35
(0.03) (0.02) (0.02) (0.02) (0.02)
-1.02 -0.64 -0.16 -0.73 -0.29
(0.01) (0.01) (0.01) (0.01) (0.01)
-0.43 -0.01 0.27 -0.19 0.36
(0.00) (0.00) (0.00) (0.00) (0.00)
0.00 0.45 0.55 0.23 0.78
(0.00) (0.00) (0.00) (0.00) (0.00)
0.81 1.28 1.07 0.99 1.43
(0.02) (0.01) (0.01) (0.01) (0.01)
Note: Values that are statistically significant are indicated in bold. Source: OECD, PISA 2009 Database. 1 2 http://dx.doi.org/10.1787/888932462776
Education at a Glance © OECD 2011
109
A6
chapter A
The Output of Educational Institutions and the Impact of Learning
Table A6.1. [2/2] Index of enjoyment of reading and reading performance, by national quarters of this index Results based on students’ self-reports
A6
Other G20
OECD
Performance on the reading scale, by national quarters of this index
Bottom quarter
Second quarter
Third quarter
Mean score
S.E.
Mean score
S.E.
Mean score
Australia Austria Belgium Canada Chile Czech Republic Denmark Estonia Finland France Germany Greece Hungary Iceland Ireland Israel Italy Japan Korea Luxembourg Mexico Netherlands New Zealand Norway Poland Portugal Slovak Republic Slovenia Spain Sweden Switzerland Turkey United Kingdom United States
454 422 461 473 430 436 448 456 475 435 451 435 452 444 445 455 445 471 495 426 412 464 466 450 464 453 451 445 439 442 449 444 446 454
(2.4) (3.5) (2.4) (2.0) (3.3) (3.3) (3.1) (3.2) (2.7) (4.9) (4.0) (6.2) (3.8) (2.8) (3.9) (4.5) (2.3) (4.3) (4.5) (2.7) (2.3) (5.1) (3.3) (3.6) (3.4) (3.4) (3.4) (2.3) (2.6) (3.3) (3.1) (4.3) (3.2) (2.8)
489 446 482 506 433 446 477 480 518 475 468 463 468 485 467 447 459 505 526 445 411 487 489 484 472 470 447 457 461 474 475 451 466 474
(2.7) (3.8) (3.2) (2.1) (4.1) (3.7) (3.4) (3.2) (2.9) (3.7) (3.5) (6.0) (3.5) (2.7) (3.6) (4.8) (2.0) (4.2) (3.6) (2.9) (2.4) (5.2) (3.2) (3.3) (3.5) (3.7) (3.8) (2.4) (2.5) (3.8) (2.9) (3.8) (2.6) (4.3)
536 481 514 542 450 488 509 515 557 514 520 494 500 516 513 479 500 540 555 483 427 522 541 518 508 498 479 494 493 515 516 469 508 511
OECD average
450
(0.6)
471
(0.6)
Argentina Brazil Indonesia Russian Federation Shanghai-China
390 397 393 426 515
(4.9) (2.7) (4.3) (4.0) (3.3)
388 399 395 439 550
(5.6) (3.8) (3.8) (4.5) (3.3)
S.E.
Mean score
S.E.
Effect
S.E.
Ratio
%
S.E.
(2.7) (4.2) (3.7) (2.2) (3.7) (2.8) (2.9) (3.3) (3.0) (4.0) (3.1) (4.6) (4.9) (3.3) (4.0) (4.2) (2.2) (3.4) (3.5) (3.4) (2.3) (5.2) (3.8) (3.3) (3.3) (3.3) (3.5) (2.4) (2.3) (3.8) (3.0) (3.6) (3.2) (4.2)
588 536 571 582 490 547 549 555 596 562 562 540 559 564 567 534 544 573 584 537 454 560 593 564 563 541 538 543 537 563 565 498 562 563
(2.7) (4.2) (2.9) (1.9) (3.6) (3.5) (3.1) (3.4) (2.7) (4.1) (3.0) (3.3) (3.4) (2.5) (3.0) (3.9) (2.1) (3.6) (3.4) (2.7) (2.4) (5.7) (3.2) (3.4) (3.1) (3.3) (3.9) (2.6) (1.9) (3.6) (3.2) (4.7) (2.7) (5.0)
44.9 37.2 40.9 35.7 29.0 46.0 43.2 43.3 43.3 47.1 36.6 46.8 45.1 43.4 45.1 30.1 40.4 35.8 40.4 39.9 21.6 38.5 48.2 42.1 35.2 35.6 39.8 39.0 38.4 46.8 37.7 23.5 45.0 38.3
(1.04) (1.63) (1.21) (0.80) (1.57) (1.53) (1.46) (1.71) (1.17) (2.28) (1.36) (2.35) (1.92) (1.37) (1.56) (1.91) (1.02) (1.89) (2.29) (1.34) (1.12) (1.88) (1.56) (1.51) (1.31) (1.59) (2.42) (1.39) (0.97) (1.54) (1.20) (2.03) (1.52) (1.81)
2.7 2.0 1.8 2.5 1.4 2.0 2.5 2.4 3.2 2.5 2.3 2.3 2.1 2.7 2.4 1.2 1.9 2.3 2.5 1.9 1.2 2.0 2.3 2.5 1.9 1.9 1.5 1.9 2.2 2.4 2.3 1.5 2.2 2.0
(0.12) (0.15) (0.10) (0.10) (0.09) (0.11) (0.16) (0.17) (0.16) (0.16) (0.12) (0.15) (0.16) (0.18) (0.15) (0.08) (0.07) (0.13) (0.15) (0.12) (0.04) (0.16) (0.15) (0.18) (0.13) (0.11) (0.09) (0.10) (0.11) (0.18) (0.14) (0.11) (0.13) (0.12)
26.0 19.8 16.7 20.1 8.4 20.7 21.4 20.7 27.0 20.7 21.0 17.2 20.1 22.2 23.8 7.9 16.2 15.0 17.6 17.4 4.0 16.7 22.3 22.2 18.7 14.0 14.3 17.4 17.8 21.7 22.4 6.2 21.5 17.5
(0.80) (1.40) (0.93) (0.83) (0.84) (1.10) (1.27) (1.28) (1.22) (1.55) (1.13) (1.36) (1.61) (1.12) (1.36) (0.90) (0.71) (1.12) (1.35) (1.09) (0.40) (1.46) (1.37) (1.27) (1.19) (1.00) (1.39) (1.09) (0.74) (1.32) (1.13) (0.94) (1.34) (1.30)
506
(0.6)
553
(0.6)
39.5
(0.28)
2.1
(0.02)
18.1
(0.20)
388 411 404 464 570
(5.3) (3.3) (4.1) (3.2) (2.9)
442 444 417 514 590
(6.6) (3.8) (5.1) (4.6) (3.2)
27.4 25.8 21.2 48.6 39.8
(3.65) (1.87) (2.89) (2.70) (2.56)
1.1 1.2 1.3 1.8 2.4
(0.07) (0.06) (0.09) (0.12) (0.16)
3.6 4.6 2.5 14.5 12.2
(0.91) (0.62) (0.71) (1.35) (1.22)
Note: Values that are statistically significant are indicated in bold. Source: OECD, PISA 2009 Database. 1 2 http://dx.doi.org/10.1787/888932462776
110
Education at a Glance © OECD 2011
Top quarter
Change in the reading score per unit of this index
Increased likelihood of students in the bottom quarter of this index scoring in the bottom Explained quarter of the variance national reading in student performance performance distribution (r-squared x 100) S.E.
chapter A
Are Students Who Enjoy Reading Better Readers? – Indicator A6
Table A6.2. [1/2] Percentage of students and reading performance, by time spent reading for enjoyment Results based on students’ self-reports Percentage of students, by time spent reading for enjoyment I read for enjoyment
Other G20
OECD
I do not read for enjoyment
More than 30 minutes to 30 minutes or less less than 60 minutes a day a day
1 to 2 hours a day
More than 2 hours a day
Total
%
S.E.
%
S.E.
%
S.E.
%
S.E.
%
S.E.
%
S.E.
Australia Austria Belgium Canada Chile Czech Republic Denmark Estonia Finland France Germany Greece Hungary Iceland Ireland Israel Italy Japan Korea Luxembourg Mexico Netherlands New Zealand Norway Poland Portugal Slovak Republic Slovenia Spain Sweden Switzerland Turkey United Kingdom United States
36.7 50.0 44.4 31.1 39.7 43.0 33.6 38.6 33.0 38.8 41.3 17.5 25.5 38.0 41.9 34.5 33.9 44.2 38.5 48.2 23.8 48.6 31.3 40.0 32.2 35.2 40.9 39.8 39.6 37.3 44.6 22.9 39.6 42.0
(0.6) (0.9) (0.8) (0.5) (0.8) (0.8) (0.9) (1.1) (0.8) (1.0) (0.9) (0.8) (0.8) (0.8) (1.0) (0.9) (0.6) (0.9) (0.8) (0.8) (0.4) (1.3) (0.8) (0.9) (0.8) (0.7) (1.1) (0.7) (0.7) (0.9) (0.9) (0.7) (0.9) (1.0)
30.7 23.7 26.2 30.5 35.9 27.8 41.1 26.4 32.4 31.1 24.7 24.3 34.7 32.5 26.0 26.5 28.5 25.4 29.8 24.6 44.4 30.8 33.1 32.9 30.4 32.8 32.1 34.5 25.6 34.0 30.1 27.5 31.5 29.3
(0.5) (0.6) (0.5) (0.5) (0.7) (0.7) (0.8) (0.8) (0.7) (0.8) (0.7) (0.8) (0.8) (0.8) (0.7) (0.6) (0.4) (0.9) (0.8) (0.7) (0.4) (0.9) (0.8) (0.8) (0.8) (0.6) (0.8) (0.7) (0.5) (0.7) (0.7) (0.6) (0.8) (0.8)
18.0 14.7 17.2 19.0 15.5 14.5 15.5 18.9 18.6 16.4 16.8 21.5 22.1 16.6 16.3 16.3 18.9 16.4 19.1 13.9 18.6 12.6 19.7 16.8 17.6 19.2 14.1 15.6 19.5 17.4 14.4 22.2 15.5 15.1
(0.5) (0.7) (0.5) (0.4) (0.5) (0.5) (0.7) (0.7) (0.6) (0.6) (0.6) (0.7) (0.7) (0.5) (0.6) (0.5) (0.3) (0.5) (0.6) (0.6) (0.3) (0.6) (0.7) (0.7) (0.6) (0.5) (0.7) (0.5) (0.5) (0.6) (0.6) (0.6) (0.6) (0.5)
9.0 7.2 9.1 13.3 6.4 10.2 7.4 10.5 12.7 9.8 11.3 23.6 13.6 9.6 11.7 15.8 13.7 9.6 8.4 8.8 10.3 6.3 10.2 6.9 12.5 9.7 8.9 8.0 11.3 8.2 8.0 21.5 9.8 8.7
(0.3) (0.4) (0.3) (0.4) (0.4) (0.5) (0.5) (0.4) (0.5) (0.5) (0.5) (0.7) (0.6) (0.5) (0.6) (0.6) (0.3) (0.4) (0.4) (0.5) (0.2) (0.4) (0.4) (0.4) (0.6) (0.4) (0.5) (0.5) (0.4) (0.4) (0.4) (0.7) (0.4) (0.4)
5.5 4.3 3.1 6.0 2.5 4.6 2.3 5.7 3.2 3.9 5.9 13.1 4.2 3.3 4.1 6.9 5.0 4.4 4.2 4.4 2.9 1.8 5.6 3.4 7.4 3.1 3.9 2.2 3.9 3.1 2.9 6.0 3.6 4.9
(0.3) (0.3) (0.2) (0.2) (0.2) (0.3) (0.2) (0.4) (0.3) (0.3) (0.4) (0.6) (0.3) (0.3) (0.3) (0.4) (0.2) (0.3) (0.3) (0.3) (0.2) (0.2) (0.3) (0.3) (0.4) (0.2) (0.3) (0.2) (0.2) (0.3) (0.3) (0.4) (0.3) (0.3)
63.3 50.0 55.6 68.9 60.3 57.0 66.4 61.4 67.0 61.2 58.7 82.5 74.5 62.0 58.1 65.5 66.1 55.8 61.5 51.8 76.2 51.4 68.7 60.0 67.8 64.8 59.1 60.2 60.4 62.7 55.4 77.1 60.4 58.0
(0.6) (0.9) (0.8) (0.5) (0.8) (0.8) (0.9) (1.1) (0.8) (1.0) (0.9) (0.8) (0.8) (0.8) (1.0) (0.9) (0.6) (0.9) (0.8) (0.8) (0.4) (1.3) (0.8) (0.9) (0.8) (0.7) (1.1) (0.7) (0.7) (0.9) (0.9) (0.7) (0.9) (1.0)
OECD average
37.4
(0.1)
30.3
(0.1)
17.2
(0.1)
10.6
(0.1)
4.5
(0.1)
62.6
(0.1)
Argentina Brazil Indonesia Russian Federation Shanghai-China
41.7 21.8 12.1 21.4 8.0
(1.0) (0.6) (0.6) (0.8) (0.4)
29.4 39.5 37.9 31.1 35.9
(0.8) (0.5) (0.9) (0.9) (0.8)
14.8 20.3 26.7 27.5 36.5
(0.6) (0.5) (0.8) (0.8) (0.7)
10.4 12.9 15.2 13.2 13.2
(0.6) (0.4) (0.6) (0.5) (0.5)
3.7 5.5 8.0 6.9 6.4
(0.3) (0.3) (0.6) (0.4) (0.3)
58.3 78.2 87.9 78.6 92.0
(1.0) (0.6) (0.6) (0.8) (0.4)
Source: OECD, PISA 2009 Database. 1 2 http://dx.doi.org/10.1787/888932462795
Education at a Glance © OECD 2011
111
A6
chapter A
The Output of Educational Institutions and the Impact of Learning
Table A6.2. [2/2] Percentage of students and reading performance, by time spent reading for enjoyment Results based on students’ self-reports
A6
Change between 2000 and 2009 in the percentage of students reading for enjoyment (PISA 2009 – PISA 2000)
Performance on the reading scale, by time spent reading for enjoyment
Other G20
OECD
I do not read for enjoyment
30 minutes or less a day
More than 30 minutes to less than 60 minutes a day
1 to 2 hours a day
More than 2 hours a day
All students
Boys
Girls
Mean score
S.E.
Mean score
S.E.
Mean score
S.E.
Mean score
S.E.
Mean score
S.E.
% dif.
S.E.
% dif.
S.E.
% dif.
S.E.
Australia Austria Belgium Canada Chile Czech Republic Denmark Estonia Finland France Germany Greece Hungary Iceland Ireland Israel Italy Japan Korea Luxembourg Mexico Netherlands New Zealand Norway Poland Portugal Slovak Republic Slovenia Spain Sweden Switzerland Turkey United Kingdom United States
469 437 469 481 437 441 464 469 492 450 457 450 453 455 458 460 449 492 518 437 421 478 472 465 463 459 445 446 453 455 461 444 458 467
(2.2) (3.1) (2.7) (1.9) (3.3) (3.2) (2.9) (2.8) (2.5) (4.4) (3.5) (7.5) (4.2) (2.5) (3.5) (4.4) (2.3) (3.9) (4.4) (1.9) (2.4) (4.5) (3.4) (3.2) (3.2) (3.0) (3.6) (1.7) (2.4) (3.1) (2.6) (4.1) (2.6) (3.0)
524 494 532 530 449 489 503 514 545 512 513 480 490 521 505 483 489 536 550 493 420 534 525 523 498 490 486 499 484 515 521 468 505 514
(2.6) (3.5) (2.9) (1.8) (3.5) (3.5) (2.5) (3.4) (2.7) (3.8) (3.3) (6.5) (3.5) (2.6) (3.9) (4.1) (1.8) (4.2) (4.0) (3.3) (2.0) (5.9) (3.9) (3.0) (2.9) (3.8) (3.1) (2.4) (2.5) (3.8) (2.8) (3.6) (3.2) (4.8)
560 517 547 555 472 520 518 525 569 538 545 490 517 544 540 498 516 550 558 516 444 552 558 540 526 519 514 526 510 539 548 480 531 532
(3.0) (5.7) (3.1) (2.2) (4.1) (4.5) (3.0) (3.9) (3.3) (4.9) (3.5) (4.6) (4.3) (3.8) (3.8) (4.9) (2.7) (4.0) (3.6) (3.7) (2.4) (5.5) (3.8) (4.6) (3.8) (3.6) (4.7) (3.1) (2.5) (4.9) (4.3) (3.9) (4.3) (6.0)
570 530 548 565 478 532 537 530 572 546 548 492 533 542 550 492 521 552 560 524 430 541 574 542 544 530 523 520 515 539 558 473 549 541
(3.5) (5.8) (4.2) (2.5) (6.7) (4.0) (3.9) (4.8) (4.0) (5.9) (4.5) (4.1) (4.8) (4.5) (4.5) (5.2) (2.2) (5.1) (5.0) (4.8) (3.6) (8.5) (4.8) (5.8) (4.6) (4.9) (5.2) (5.3) (3.1) (5.0) (4.2) (4.5) (4.7) (5.9)
563 504 523 559 499 522 536 527 568 543 532 507 536 533 549 484 528 537 535 519 437 514 573 528 549 538 516 521 517 532 533 472 539 544
(4.0) (9.8) (8.2) (3.7) (8.3) (6.7) (9.5) (6.1) (9.1) (8.8) (6.8) (4.9) (9.1) (9.4) (8.2) (7.8) (3.5) (7.1) (8.8) (7.2) (8.4) (10.6) (6.9) (8.8) (5.4) (5.7) (9.3) (10.8) (4.2) (8.2) (7.6) (7.6) (7.5) (6.6)
-3.6 m -2.2 1.6 -13.4 -16.7 -6.9 m -10.7 -8.8 0.5 4.5 0.6 -8.2 -8.5 2.5 -3.3 10.9 -8.0 m -10.2 m -1.4 -4.6 -8.0 -16.8 m m -7.9 -1.3 -9.5 m m -1.3
(1.3) m (1.2) (0.7) (1.1) (1.2) (1.2) m (1.0) (1.3) (1.2) (1.1) (1.2) (1.0) (1.3) (2.6) (1.2) (1.6) (1.2) m (0.8) m (1.2) (1.2) (1.4) (1.1) m m (1.1) (1.3) (1.4) m m (1.7)
-6.9 m -0.7 -1.3 -16.6 -17.0 -6.8 m -11.4 -8.4 -0.4 1.0 -1.0 -11.5 -5.1 3.3 -8.1 8.8 -8.3 m -12.1 m -3.8 -4.0 -14.6 -20.4 m m -7.5 -4.5 -7.6 m m -2.5
(1.9) m (1.7) (1.0) (1.5) (1.7) (1.7) m (1.6) (1.7) (1.6) (1.8) (1.7) (1.7) (1.9) (2.5) (1.5) (1.9) (1.5) m (1.3) m (1.7) (1.7) (2.2) (1.7) m m (1.5) (1.6) (1.9) m m (2.2)
-1.5 m -4.1 4.5 -9.0 -13.4 -7.3 m -9.2 -9.0 1.6 7.8 2.3 -5.0 -11.7 5.0 2.3 13.1 -7.7 m -8.3 m 1.4 -5.3 -1.3 -13.0 m m -7.6 2.0 -10.9 m m 1.2
(1.6) m (1.2) (0.7) (1.3) (1.4) (1.5) m (1.2) (1.6) (1.4) (1.3) (1.4) (1.5) (1.6) (3.0) (1.3) (2.0) (2.0) m (0.9) m (1.4) (1.6) (1.3) (1.0) m m (1.4) (1.7) (1.5) m m (2.0)
OECD average
460
(0.6)
504
(0.6)
527
(0.7)
532
(0.8)
527
(1.3)
-5.0
(0.3)
-6.4
(0.3)
-3.2
(0.3)
Argentina Brazil Indonesia Russian Federation Shanghai-China
394 396 380 427 497
(5.5) (3.0) (3.7) (4.9) (5.5)
398 403 390 452 560
(5.2) (2.5) (3.2) (3.4) (2.6)
414 428 414 472 563
(6.0) (3.3) (4.1) (3.4) (2.9)
416 431 412 489 564
(9.0) (4.2) (5.9) (4.9) (3.7)
418 429 429 498 548
(10.4) (6.3) (7.8) (6.6) (4.8)
-12.4 -2.5 1.3 -1.9 m
(1.3) (1.1) (1.2) (1.1) m
-12.8 -4.2 -1.3 -4.4 m
(1.8) (1.7) (1.4) (1.5) m
-11.3 -0.6 4.1 0.5 m
(1.8) (1.1) (1.6) (1.1) m
Note: Changes between 2000 and 2009 that are statistically significant are indicated in bold. Source: OECD, PISA 2009 Database. Please refer to the Reader’s Guide for information concerning the symbols replacing missing data. 1 2 http://dx.doi.org/10.1787/888932462795
112
Education at a Glance © OECD 2011
Are Students Who Enjoy Reading Better Readers? – Indicator A6
chapter A
Table A6.3. Reading diverse materials and performance Students who reported that they read the following materials because they want to “several times a month” or “several times a week” Performance on the reading scale of students who read different materials Magazines Do not read
Fiction (novels, narratives, stories)
Comic books
Read
Do not read
Read
Do not read
Read
Non-fiction books Do not read
Read
Newspapers Do not read
Read
Other G20
OECD
Mean Mean Mean Mean Mean Mean Mean Mean Mean Mean score S.E. score S.E. score S.E. score S.E. score S.E. score S.E. score S.E. score S.E. score S.E. score S.E. Australia Austria Belgium Canada Chile Czech Republic Denmark Estonia Finland France Germany Greece Hungary Iceland Ireland Israel Italy Japan Korea Luxembourg Mexico Netherlands New Zealand Norway Poland Portugal Slovak Republic Slovenia Spain Sweden Switzerland Turkey United Kingdom United States
524 470 492 523 438 476 483 488 510 483 503 473 469 488 497 469 482 524 540 463 419 487 531 494 480 492 448 471 479 480 487 467 496 500
OECD average
486 (0.6)
501 (0.5)
495 (0.5)
492 (0.8)
480 (0.5)
533 (0.6)
492 (0.5)
513 (0.7)
484 (0.6)
501 (0.5)
Argentina Brazil Indonesia Russian Federation Shanghai-China
387 402 392 455 547
415 427 410 463 563
404 421 398 468 561
400 402 407 434 543
402 414 394 439 548
406 416 408 477 563
402 414 393 458 554
404 424 420 472 561
397 409 393 464 531
407 422 407 459 566
(2.6) (4.1) (3.8) (1.6) (3.7) (3.8) (3.4) (3.8) (3.5) (4.5) (3.1) (5.4) (4.6) (2.3) (4.0) (4.1) (1.9) (4.5) (3.5) (3.1) (2.4) (5.3) (3.2) (3.2) (3.5) (3.8) (5.3) (2.6) (2.2) (3.6) (3.2) (4.0) (3.1) (3.9)
(4.8) (2.7) (3.5) (4.6) (2.5)
510 478 523 528 463 485 503 506 551 505 506 490 512 511 499 495 492 519 539 479 435 530 515 511 512 489 487 491 484 513 508 465 495 502
(2.5) (2.8) (2.2) (1.9) (2.9) (2.9) (2.0) (2.7) (2.2) (3.3) (3.1) (4.3) (2.8) (1.7) (3.1) (3.4) (1.7) (3.4) (4.5) (1.7) (1.8) (5.0) (2.6) (2.7) (2.6) (3.0) (2.3) (1.4) (2.3) (2.9) (2.4) (3.5) (2.2) (3.9)
(5.0) (3.3) (4.4) (3.0) (2.7)
517 478 505 526 452 482 494 506 530 493 506 483 499 495 500 483 483 516 543 475 430 509 525 495 503 491 478 488 482 496 498 470 498 502
(2.2) (2.8) (2.6) (1.5) (3.2) (2.7) (2.4) (2.6) (3.0) (3.6) (2.6) (4.6) (3.1) (1.8) (3.0) (3.6) (1.7) (4.7) (3.9) (1.4) (2.1) (5.2) (2.3) (2.9) (2.6) (3.0) (2.6) (1.2) (2.0) (2.9) (2.5) (3.5) (2.2) (3.6)
(5.2) (3.1) (3.8) (3.4) (2.3)
517 458 529 526 444 484 506 476 540 507 499 483 482 516 476 459 505 522 534 470 417 522 506 517 487 486 481 474 485 510 513 451 475 488
(4.8) (4.8) (2.7) (2.6) (3.7) (5.7) (2.9) (4.5) (2.4) (4.5) (5.6) (4.9) (4.6) (2.6) (6.7) (4.7) (2.5) (3.4) (4.1) (3.4) (1.9) (6.2) (5.8) (2.8) (5.0) (3.9) (5.4) (4.0) (3.8) (4.0) (3.2) (4.5) (4.9) (6.4)
(4.9) (2.5) (4.0) (4.3) (3.3)
488 456 499 502 446 470 483 493 517 477 483 472 484 484 480 471 471 501 526 452 429 501 494 487 491 479 469 476 466 475 480 462 475 483
(2.0) (2.9) (2.4) (1.6) (3.1) (2.9) (2.3) (2.6) (2.2) (3.6) (3.0) (4.9) (3.1) (1.7) (3.1) (3.6) (1.8) (4.0) (4.0) (1.4) (2.0) (5.5) (2.6) (2.5) (2.5) (3.0) (2.6) (1.2) (2.1) (2.7) (2.4) (3.7) (2.3) (3.1)
(4.7) (2.8) (4.0) (3.9) (2.5)
564 530 561 558 462 541 525 531 590 549 551 523 519 549 542 500 517 548 556 527 424 552 559 551 544 518 524 538 519 549 550 468 542 532
(2.8) (4.0) (3.1) (1.7) (3.8) (4.1) (2.7) (3.5) (2.8) (3.9) (2.9) (3.5) (4.6) (2.8) (3.5) (4.2) (1.9) (3.3) (3.1) (2.6) (2.2) (5.1) (3.0) (3.4) (4.0) (3.8) (4.9) (3.9) (2.2) (3.3) (3.3) (3.7) (3.0) (4.8)
(5.8) (3.5) (3.9) (3.3) (2.8)
510 474 512 522 446 479 490 493 532 497 504 482 490 496 494 477 486 518 530 471 423 507 518 503 494 485 473 478 473 495 500 472 491 502
(2.3) (3.1) (2.1) (1.5) (3.0) (2.9) (2.2) (2.7) (2.2) (3.8) (2.9) (4.4) (3.3) (1.5) (3.0) (3.5) (1.6) (3.5) (3.7) (1.4) (1.9) (5.3) (2.5) (2.6) (2.7) (2.9) (2.5) (1.1) (2.1) (2.7) (2.3) (3.6) (2.3) (3.7)
(4.8) (2.7) (3.6) (3.5) (2.4)
544 483 522 539 475 505 514 521 558 494 509 504 504 528 526 486 497 542 562 487 442 547 538 507 530 519 504 527 523 541 507 450 519 498
(3.4) (4.4) (5.6) (2.5) (4.1) (4.4) (2.7) (3.3) (4.2) (4.7) (4.1) (7.4) (3.9) (3.6) (5.1) (4.5) (3.9) (4.8) (3.6) (3.4) (2.6) (5.8) (3.4) (3.7) (3.8) (5.1) (4.0) (3.2) (2.7) (5.5) (4.5) (4.0) (3.7) (5.2)
(5.6) (4.1) (4.3) (3.9) (3.3)
510 458 505 521 436 477 489 485 523 491 495 482 483 457 505 444 477 506 527 472 424 497 518 487 489 494 470 480 478 468 482 444 497 499
(2.2) (4.6) (2.9) (1.7) (3.5) (4.0) (2.5) (4.5) (3.2) (4.0) (3.7) (4.7) (5.0) (4.1) (4.2) (5.1) (1.9) (4.0) (3.7) (3.1) (2.1) (5.8) (2.9) (4.0) (3.6) (3.3) (4.2) (2.5) (2.2) (3.9) (3.4) (4.9) (2.6) (3.9)
(5.1) (2.9) (3.5) (5.0) (3.5)
523 479 520 531 461 485 503 506 540 504 511 484 499 511 495 491 496 531 556 474 429 527 526 510 504 486 482 488 487 511 506 468 495 504
(2.9) (2.9) (2.6) (1.9) (3.2) (2.8) (2.5) (2.6) (2.3) (3.9) (2.8) (4.6) (3.0) (1.6) (3.0) (3.3) (1.7) (3.5) (3.6) (1.7) (2.0) (5.2) (2.8) (2.4) (2.7) (3.3) (2.4) (1.3) (2.4) (2.8) (2.5) (3.7) (2.5) (4.2)
(4.9) (3.3) (4.2) (3.0) (2.6)
Note: Differences between students who read and students who do not that are statistically significant are indicated in bold. Source: OECD, PISA 2009 Database. 1 2 http://dx.doi.org/10.1787/888932462814
Education at a Glance © OECD 2011
113
A6
chapter A
The Output of Educational Institutions and the Impact of Learning
Table A6.4. [1/2] Percentage of students and reading performance, by whether students spend any time reading for enjoyment and gender
A6
Results based on students’ self-reports Percentage of students, by whether they spend any time reading for enjoyment I do not read for enjoyment
Other G20
OECD
%
Percentage of students who read for enjoyment by gender
I read for enjoyment1
S.E.
%
S.E.
Boys %
Girls S.E.
%
S.E.
Reading performance, by whether students read for enjoyment
Difference (B-G)
I do not read for enjoyment
I read for enjoyment
%
Mean score
Mean score
S.E.
S.E.
S.E.
Australia Austria Belgium Canada Chile Czech Republic Denmark Estonia Finland France Germany Greece Hungary Iceland Ireland Israel Italy Japan Korea Luxembourg Mexico Netherlands New Zealand Norway Poland Portugal Slovak Republic Slovenia Spain Sweden Switzerland Turkey United Kingdom United States
36.7 50.0 44.4 31.1 39.7 43.0 33.6 38.6 33.0 38.8 41.3 17.5 25.5 38.0 41.9 34.5 33.9 44.2 38.5 48.2 23.8 48.6 31.3 40.0 32.2 35.2 40.9 39.8 39.6 37.3 44.6 22.9 39.6 42.0
(0.6) (0.9) (0.8) (0.5) (0.8) (0.8) (0.9) (1.1) (0.8) (1.0) (0.9) (0.8) (0.8) (0.8) (1.0) (0.9) (0.6) (0.9) (0.8) (0.8) (0.4) (1.3) (0.8) (0.9) (0.8) (0.7) (1.1) (0.7) (0.7) (0.9) (0.9) (0.7) (0.9) (1.0)
63.3 50.0 55.6 68.9 60.3 57.0 66.4 61.4 67.0 61.2 58.7 82.5 74.5 62.0 58.1 65.5 66.1 55.8 61.5 51.8 76.2 51.4 68.7 60.0 67.8 64.8 59.1 60.2 60.4 62.7 55.4 77.1 60.4 58.0
(0.6) (0.9) (0.8) (0.5) (0.8) (0.8) (0.9) (1.1) (0.8) (1.0) (0.9) (0.8) (0.8) (0.8) (1.0) (0.9) (0.6) (0.9) (0.8) (0.8) (0.4) (1.3) (0.8) (0.9) (0.8) (0.7) (1.1) (0.7) (0.7) (0.9) (0.9) (0.7) (0.9) (1.0)
53.0 38.5 46.2 56.2 50.7 44.3 57.3 47.1 53.3 52.1 45.1 76.4 65.7 51.5 52.5 55.2 53.9 53.6 60.5 39.6 69.5 35.8 59.4 50.4 53.1 50.2 47.3 46.1 51.0 50.7 43.6 68.4 50.7 47.4
(0.8) (1.0) (1.0) (0.8) (1.0) (1.0) (1.1) (1.4) (1.1) (1.3) (1.1) (1.1) (1.2) (1.3) (1.4) (1.5) (0.8) (1.1) (1.0) (1.1) (0.7) (1.5) (1.1) (1.1) (1.3) (1.0) (1.5) (1.2) (0.9) (1.1) (1.1) (1.0) (1.0) (1.2)
73.1 60.9 65.4 81.6 70.3 71.5 75.3 76.8 80.6 69.8 72.5 88.4 83.5 72.3 63.8 75.1 79.0 58.2 62.6 64.2 82.8 66.8 78.3 70.0 82.5 78.7 70.5 74.9 70.0 75.0 67.6 86.5 69.7 69.2
(0.8) (1.2) (1.0) (0.5) (0.9) (1.2) (1.1) (1.2) (1.0) (1.3) (1.1) (0.9) (0.9) (1.0) (1.3) (1.0) (0.6) (1.3) (1.4) (1.0) (0.4) (1.4) (1.0) (1.1) (0.9) (0.8) (1.1) (0.8) (0.8) (1.0) (1.0) (1.0) (1.1) (1.3)
-20.1 -22.4 -19.2 -25.4 -19.6 -27.2 -18.0 -29.8 -27.3 -17.7 -27.4 -12.0 -17.8 -20.8 -11.3 -19.9 -25.1 -4.6 -2.2 -24.6 -13.3 -31.1 -18.9 -19.6 -29.4 -28.4 -23.2 -28.8 -19.0 -24.3 -24.0 -18.1 -19.0 -21.8
(1.1) (1.6) (1.4) (0.8) (1.3) (1.5) (1.4) (1.7) (1.5) (1.7) (1.3) (1.3) (1.5) (1.7) (1.8) (1.7) (1.1) (1.5) (1.8) (1.5) (0.7) (1.5) (1.4) (1.5) (1.4) (1.3) (1.8) (1.5) (1.2) (1.3) (1.3) (1.5) (1.4) (1.4)
469 437 469 481 437 441 464 469 492 450 457 450 453 455 458 460 449 492 518 437 421 478 472 465 463 459 445 446 453 455 461 444 458 467
(2.2) (3.1) (2.7) (1.9) (3.3) (3.2) (2.9) (2.8) (2.5) (4.4) (3.5) (7.5) (4.2) (2.5) (3.5) (4.4) (2.3) (3.9) (4.4) (1.9) (2.4) (4.5) (3.4) (3.2) (3.2) (3.0) (3.6) (1.7) (2.4) (3.1) (2.6) (4.1) (2.6) (3.0)
545 507 539 546 460 507 512 521 558 526 530 490 509 531 527 489 506 543 553 507 428 539 546 530 519 507 500 509 500 525 534 473 521 525
(2.5) (3.5) (2.4) (1.5) (3.3) (3.0) (2.0) (2.7) (2.3) (3.3) (2.7) (3.9) (3.2) (1.6) (2.9) (3.3) (1.6) (3.5) (3.4) (2.1) (2.1) (5.4) (2.7) (2.7) (2.6) (3.2) (2.7) (1.5) (2.0) (3.1) (2.7) (3.4) (2.6) (4.4)
OECD average
37.4
(0.1)
62.6
(0.1)
52.2
(0.2)
73.1
(0.2)
-20.9
(0.2)
460
(0.6)
517
(0.5)
Argentina Brazil Indonesia Russian Federation Shanghai-China
41.7 21.8 12.1 21.4 8.0
(1.0) (0.6) (0.6) (0.8) (0.4)
58.3 78.2 87.9 78.6 92.0
(1.0) (0.6) (0.6) (0.8) (0.4)
49.4 68.7 83.4 70.6 89.0
(1.2) (1.0) (0.9) (1.2) (0.6)
65.8 86.6 92.2 86.6 95.0
(1.3) (0.5) (0.6) (0.9) (0.4)
-16.4 -17.9 -8.8 -16.0 -6.1
(1.7) (1.0) (1.1) (1.4) (0.6)
394 396 380 427 497
(5.5) (3.0) (3.7) (4.9) (5.5)
407 416 405 469 561
(4.8) (2.5) (3.9) (3.1) (2.3)
Note: Values that are statistically significant are indicated in bold. 1. The “I read for enjoyment” category groups students who: read “30 minutes or less per day”, students who read “between 30 minutes and 60 minutes”, students who read “between 1 hour and 2 hours” and students who read “more than 2 hours daily”. Source: OECD, PISA 2009 Database. 1 2 http://dx.doi.org/10.1787/888932462833
114
Education at a Glance © OECD 2011
chapter A
Are Students Who Enjoy Reading Better Readers? – Indicator A6
Table A6.4. [2/2] Percentage of students and reading performance, by whether students spend any time reading for enjoyment and gender
A6
Other G20
OECD
Results based on students’ self-reports Reading performance of boys, by whether they read for enjoyment
Reading performance of girls, by whether they read for enjoyment
Difference between boys and girls, by whether they read for enjoyment
I do not read for enjoyment
I do not read for enjoyment
I do not read for enjoyment (B-G)
I read for enjoyment
I read for enjoyment
I read for enjoyment (B-G)
Mean score
S.E.
Mean score
S.E.
Mean score
S.E.
Mean score
S.E.
Score dif.
S.E.
Score dif.
S.E.
Australia Austria Belgium Canada Chile Czech Republic Denmark Estonia Finland France Germany Greece Hungary Iceland Ireland Israel Italy Japan Korea Luxembourg Mexico Netherlands New Zealand Norway Poland Portugal Slovak Republic Slovenia Spain Sweden Switzerland Turkey United Kingdom United States
460 429 465 476 434 433 455 462 479 439 452 437 444 440 445 450 440 476 499 429 413 474 460 451 451 451 432 433 446 445 452 438 452 462
(2.9) (4.2) (3.6) (2.2) (3.8) (3.7) (3.6) (3.0) (3.0) (5.1) (4.2) (8.6) (4.9) (2.8) (5.1) (5.2) (2.7) (5.9) (6.1) (2.5) (2.9) (4.7) (4.1) (3.6) (3.4) (3.4) (4.4) (2.2) (2.6) (3.8) (3.3) (4.5) (3.4) (3.9)
533 486 531 535 446 485 501 500 534 511 516 466 492 517 509 467 487 524 538 493 414 538 529 510 499 490 475 486 489 508 522 449 514 517
(3.5) (4.9) (3.8) (2.1) (4.6) (4.5) (2.8) (3.7) (3.3) (4.5) (4.0) (5.0) (4.1) (3.2) (4.3) (5.2) (2.3) (5.3) (4.8) (3.7) (2.3) (5.8) (4.1) (3.4) (3.4) (4.1) (3.5) (2.5) (2.6) (3.7) (3.4) (3.8) (4.2) (5.2)
484 449 476 493 442 459 481 486 522 467 467 475 471 481 475 475 470 512 540 451 434 485 496 487 494 476 470 474 466 476 476 460 467 474
(3.1) (4.3) (3.7) (3.0) (4.2) (4.5) (4.1) (4.2) (4.3) (5.5) (4.4) (7.2) (5.3) (4.1) (3.5) (5.2) (3.6) (3.9) (5.3) (2.7) (2.8) (5.2) (4.3) (3.7) (4.7) (3.8) (4.3) (3.5) (3.1) (4.0) (3.5) (6.6) (3.0) (4.1)
552 519 545 554 470 523 520 536 574 537 540 510 522 541 543 504 520 562 569 516 439 539 558 545 532 517 517 524 509 537 542 493 526 530
(2.6) (4.5) (2.7) (1.7) (3.7) (2.9) (2.6) (2.9) (2.3) (3.5) (3.0) (3.5) (3.8) (2.0) (3.2) (3.7) (1.9) (4.8) (3.8) (2.1) (2.2) (5.7) (3.0) (3.1) (2.8) (3.1) (3.3) (1.7) (2.2) (3.4) (2.7) (3.9) (3.5) (4.5)
-25 -20 -11 -17 -8 -26 -26 -24 -43 -28 -15 -38 -28 -41 -30 -25 -30 -36 -40 -22 -20 -11 -36 -36 -42 -25 -38 -41 -20 -31 -24 -22 -15 -12
(3.9) (6.1) (5.0) (3.3) (4.6) (5.5) (5.1) (4.3) (5.2) (6.1) (5.1) (7.5) (5.9) (4.7) (5.8) (5.9) (4.3) (7.0) (7.7) (3.6) (3.2) (3.8) (5.5) (3.7) (4.6) (4.1) (5.1) (4.3) (3.1) (4.7) (4.4) (6.9) (4.0) (5.4)
-19 -33 -14 -19 -24 -38 -19 -36 -40 -26 -24 -44 -29 -24 -34 -37 -34 -38 -31 -23 -25 -1 -29 -35 -33 -27 -41 -38 -20 -29 -20 -44 -12 -13
(3.6) (6.5) (4.3) (2.2) (5.0) (4.4) (3.6) (3.7) (3.1) (4.5) (4.5) (4.3) (4.5) (4.1) (5.0) (5.7) (2.7) (7.4) (5.8) (3.9) (1.8) (3.7) (4.6) (3.5) (3.3) (3.0) (3.8) (3.0) (2.7) (3.5) (2.7) (3.6) (5.7) (3.9)
OECD average
450
(0.7)
500
(0.7)
477
(0.7)
528
(0.6)
-27
(0.9)
-28
(0.7)
Argentina Brazil Indonesia Russian Federation Shanghai-China
380 393 372 415 482
(6.0) (3.6) (4.2) (5.0) (5.9)
387 399 386 447 543
(5.8) (3.1) (4.0) (3.6) (2.9)
413 402 397 452 532
(6.2) (4.6) (5.4) (6.5) (8.4)
419 428 422 487 578
(5.1) (2.5) (4.0) (3.3) (2.3)
-34 -10 -25 -37 -50
(5.5) (5.3) (6.3) (5.7) (9.0)
-32 -29 -36 -40 -35
(5.0) (2.1) (3.4) (3.0) (2.9)
Note: Values that are statistically significant are indicated in bold. 1. The “I read for enjoyment” category groups students who: read “30 minutes or less per day”, students who read “between 30 minutes and 60 minutes”, students who read “between 1 hour and 2 hours” and students who read “more than 2 hours daily”. Source: OECD, PISA 2009 Database. 1 2 http://dx.doi.org/10.1787/888932462833
Education at a Glance © OECD 2011
115